Báo cáo lâm nghiệp: "Steep slopes promote downhill dispersal of Quercus crispula seeds and weaken the fine-scale genetic structure of seedling populations" doc
Bạn đang xem bản rút gọn của tài liệu. Xem và tải ngay bản đầy đủ của tài liệu tại đây (821.73 KB, 8 trang )
Ann. For. Sci. 64 (2007) 405–412 Available online at:
c
INRA, EDP Sciences, 2007 www.afs-journal.org
DOI: 10.1051/forest:2007017
Original article
Steep slopes promote downhill dispersal of Quercus crispula seeds
and weaken the fine-scale genetic structure of seedling populations
Takafumi O
a
*
, Yoshiaki T
a,b
,YokoS
a
,HaruoS
c,d
,YujiI
a
a
Department of Ecosystem Studies, Graduate School of Agricultural and Life Sciences, University of Tokyo, Yayoi 1-1-1,
Bunkyo-ku, Tokyo 113-8657, Japan
b
Forestry and Forest Products Research Institute, Matsunosato 1, Tsukuba-shi, Ibaraki 305-8687, Japan
c
University Forest in Chichibu, Graduate School of Agricultural and Life Sciences, University of Tokyo, Hinoda 1-1-49,
Chichibu-shi, Saitama 368-0034, Japan
d
University Forest in Aichi, Graduate School of Agricultural and Life Sciences, University of Tokyo, Goizuka 11-44, Seto-shi, Aichi 489-0031, Japan
(Received 26 June 2006; accepted 19 January 2007)
Abstract – The seed dispersal patterns and genetic structure of plant populations in mountainous forests may differ from those on flat sites, because
some seeds that fall from adults are likely to roll downhill, and thus cause the seed shadows from different mother trees to merge. In the study reported
here we used six polymorphic microsatellite markers to track seed dispersal and examine the fine-scale spatial genetic structure of adults and first-year
seedlings of Quercus crispula in 2500 m
2
plots on four slopes. In each of the four plots, leaves of adults, seedlings and endocarps of hypogeal cotyledons
attached to the seedlings were genotyped to identify the seedlings’ mother trees. The results showed that steeper slopes result in larger dispersionsand
smaller genetic structure of seedlings. These findings are a crucial step towards an understanding of the effect of topography on tree regeneration.
genetic structure / microsatellite marker / Quercus crispula / seed dispersal / slope
Résumé – Influence des pentes fortes sur la dispersion et la structure génétique des populations de Quercus crispula. Les modes de dispersion
des graines et la structure génétique des populations d’arbres peuvent être différents en forêts de montagne par rapport à ceux en forêts de plaine.
En effet, les graines qui tombent des arbres adultes roulent probablement vers le bas de la pente entraînant un regroupement des descendances de
différentes mères. Dans cette étude, nous avons suivi la dispersion des graines de Quer cus crispula et nous avons examiné à l’aide de six marqueurs
microsatellites polymorphiques la structure spatiale génétique des arbres adultes et de leurs descendants (semis de 1 an) sur des placeaux de 2500 m
2
dans quatre pentes. Dans chacun des placeaux, les feuilles des arbres adultes et des semis ainsi que les endocarpes des cotylédons attachés aux semis
ont été génotypés de manière à identifier les mères des semis. Les résultats montrent que les pentes fortes contribuent à une forte dispersion et à une
faible structuration génétique des semis. Ces résultats sont une étape importante pour la compréhension des effets de la topographie sur la régénération
des arbres.
structure génétique / marqueur microsatellite / Quercus crispula / dispersion des graines / pente
1. INTRODUCTION
Information on seed dispersal and genetic structure is very
important for elucidating the processes involved in the estab-
lishment of forests and for forecasting future changes in their
composition and dynamics. Many studies of seed dispersal
have concentrated on long-distance dispersal, since it influ-
ences many key aspects of plant biology, including the spread
of invasive species, metapopulation dynamics, and the diver-
sity of plant communities [3, 28, 32]. Similarly, most previous
studies of genetic variation within plant populations have fo-
cused on variation at the macrogeographic (10
2
∼ 10
3
km)
scale [1, 5, 21, 24]. Information on seed dispersal and micro-
geographic or fine-scale genetic structure, on the other hand,
is also important for elucidating fine-scale evolutionary pro-
cesses such as the establishment of sibling neighborhoods and
* Corresponding author:
fine-scale selection effects [6]. However, several recent stud-
ies have inferred general patterns in populations where lim-
ited gene flow has resulted in fine-scale genetic structure, with
‘patches’ of genetically similar individuals [2, 6,14, 33], in ac-
cordance with the neighborhoods or demes theoretically pro-
posed by Wright [37].
However, seed dispersal patterns and the genetic structure
of populations in mountainous forests may differ from those
on flat sites and those proposed by Wright [37] because some
seeds that fall from adults are likely to roll downhill, caus-
ing the seed shadows of different mother trees to overlap.
Shiokawa and Kagaya [26] have reported that litter from de-
ciduous trees on slopes of around 30
◦
in Japan moves downhill
at a rate of 1200 g/m/y. Similarly, seeds which are dispersed
by gravity may also move downhill, thereby limiting the for-
mation of fine-scale genetic structure. Such processes may oc-
cur widely, because many forests are located in mountainous
regions. However, few researchers have previously examined
Article published by EDP Sciences and available at or />406 T. Ohsawa et al.
N
N
Yamanakako (plot D)
Chichibu
0 100m
1000m
1
10
0m
1
2
0
0
m
1
3
0
0
m
1
4
0
0
m
plot A
plot B
plot C
0 10km
Japan
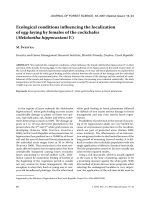
Figure 1. Location of the three Q. crispula plots in the University Forest in Chichibu and the single plot in the University Forest in Yamanakako.
This map of the central Japan was prepared by use of the software Kashmir 3D, by Tomohiko Sugimoto.
whether such processes actually occur in mountains or not, al-
though fine-scale genetic structure due to limited gene flow
at flat sites has been extensively investigated. This is partly
because no convenient methods for monitoring seed dispersal
have been available until fairly recently [3, 22, 35]. For exam-
ple, Sork [29] examined seed dispersal of Quercus rubra using
metal tags, but such methods are time- and labor-intensive in
the field. Furthermore, many tags may be missed. However, re-
cent advances, such as the development of stable isotope ratio
and molecular genetic marker techniques, are helping to over-
come this difficulty [12, 35]. For example, Grivet et al. [10]
successfully tracked seeds dispersal by acorn woodpeckers
(Melanerpes formicivorus) in granaries using microsatellite
markers.
Quercus crispula Blume (Fagaceae) is a common tree
species throughout the cool temperate deciduous forests of
southern Sakhalin, the Kuril Islands, Japan and Korea. It is
intermediately shade-tolerant, capable of sustained regenera-
tion, and lives for several hundred years, attaining a maximum
height and diameter of 30 m and 1.5 m, respectively [36].
Q. crispula is a monoecious, highly out-crossed, and wind-
pollinated species [36]. Its seeds are dispersed by gravity or ro-
dents and birds, and supply important foods for animals [36].
Thus it is an important species in the forest ecosystem, and is
also economically valuable for forestry. Since its large (length:
2−3 cm, width: 1.2−1.5 cm) [11] and heavy (fresh weight:
1.7−4.3 g) [25] seeds are likely to roll downhill, this species
is suitable for elucidating the effects of slope on seed dispersal
and fine-scale genetic structure.
In the study reported here we tracked seed dispersal and
examined the genetic structure of Q. crispula populations on
various slopes using polymorphic microsatellite markers. Few
seeds survive to become seedlings, and few seedlings reach the
adult stage. So, information on seedlings is more valuable than
information on seeds for assessing the effects of slopes on for-
est establishment. For this reason we focused on seed dispersal
and genetic structure at the seedling stage. More specifically,
the following questions were addressed. First, in which direc-
tion and to what extent are seeds of Q. crispula dispersed on
slopes? Second, is genetic structure formed even on slopes?
And if so, it is weaker than on flat sites?
2. MATERIALS AND METHODS
2.1. Field Site and Sampling
This study was performed in the University of Tokyo Forests in
Chichibu (138
◦
48’ E, 35
◦
56’ N) and Yamanakako (138
◦
52’ E,
35
◦
24’ N), both of which are located in the central area of Japan
(Fig. 1). The major oak species in this region are Q. crispula and
Q. serrata, the latter predominantly in warmer areas than Q. crispula.
Two study plots (plots A and B) were established in 2004 and one
plot (plot C) in 2005 on the same southwest-facing hillside in this
forest. The meteorological data, which were recorded at near to the
southwest-facing hillside from 2001 to 2004, indicate that the strong
wind, whose maximum velocity was larger than 10 m/s, has gen-
erally blown from west in 0 to 3 days per month in autumn [34].
Probably this is caused by typhoon. The adult trees in the sampling
Seed dispersal and genetic structure on slopes 407
plots were around 70 years old. One plot (plot A) consists of a frag-
mented forest composed of 35 mature oak trees (33 Q. crispula and
2 Q. serrata), in a triangular area of 2500 m
2
, situated on a steep
slope (around 31
o
). Such steep areas with poor soil escaped afforesta-
tion, although the surrounding forests have been replaced by artificial
forests of conifers. The nearest natural forest to this stand is 50 m
away. By contrast, plot B covers an area of 50 m × 50 m plot on
a gentle slope (around 19
o
), in which there were 72 adults of Q.
crispula. Similarly, plot C covers an area of 50 m × 50 m on a gen-
tler slope (around 9
o
), in which there were 35 adults of Q. crispula.
The vegetation at the three plots is similar – consisting of secondary
deciduous forests dominated by Q. crispula, Fagus crenata,andAcer
spp. Seed-dispersing animals, including mouse (Apodemus speciosus
and Apodemus argenteus), squirrel (Sciurus lis), jay (Garrulus glan-
darius), spotted nutcracker (Nucifrag a caryocatactes) and varied tit
(Parus varius) have been identified in the Chichibu Mountains [13].
In addition, one 50 m × 50 m plot (plot D) was established in 2005
on a flat site (around 6
o
) in the University Forest in Yamanakako as a
reference. In this plot, there were 12 adults of Q. crispula.
We collected leaves of every adult and all seedlings that germi-
nated in 2004 in plots A and B, and in 2005 in plots C and D, to de-
tect and compare vertical dispersal events on steep and gentle slopes.
The endocarps of hypogeal cotyledons attached to the seedlings were
also sampled, where possible, since the endocarp is a tissue of ma-
ternal origin, allowing the mother trees of the respective seedlings to
be identified [9, 10, 31]. However, too many seedlings germinated in
2005 in plot C to analyze them all, so we collected at random one
fifth of these seedlings, together with their endocarps. The collected
samples were stored at −80
◦
C until DNA extraction. The location of
individuals found within each plot was also recorded.
2.2. Genetic analysis
DNA was extracted by a modified CTAB procedure [38]. How-
ever, the sampled endocarps had been buried under ground for more
than six months, and the sampled material included impurities. There-
fore, polymerase chain reaction (PCR) amplification of the endocarp
DNA was often imperfect or resulted in multiple bands that were dif-
ficult to genotype. In an attempt to solve these problems, the endo-
carp extracts were purified using a Wizard SV Gel and PCR Clean-
Up System (Promega) before PCR amplification using a multiplex
PCR Kit (QIAGEN) with six nuclear microsatellite (SSR) primers:
QpZAG1/5, QpZAG9, QpZAG15, QpZAG16, QpZAG110 [30] and
MSQ13 [8]. Maternally inherited chloroplast DNA markers were not
used because of a lack of variation at the scale of this study. The
5.0 µL amplification reaction mixtures included 2.5 µL of MasterMix
solution (QIAGEN), 1.3 µL of RNase-free water, 0.5 µLofprimer
mix solution, and 0.7 µL of extracted DNA solution (10−100 µg/mL
for leaf DNA and 10−50 µg/mL for endocarp DNA). The primer
mix solution included six primer pairs, each at a concentration
0.5 pmol/µL. The reactions were performed with the following tem-
perature program: 15 min denaturing at 95
◦
Cfollowedby30cycles
of 30 s denaturing at 94
◦
C, 90 s annealing at 57
◦
C and 60 s exten-
sion at 72
◦
C, with a final extension step of 60
◦
C for 30 min. For
the endocarp DNA, the number of PCR cycles was increased from 30
to 40, to ensure sufficient amplification for genotyping. Finally, the
PCR products were loaded into an ABI3100 Genetic Analyzer (Ap-
plied Biosystems) and amplified allele sizes were determined using
GeneMapper software (Applied Biosystems).
2.3. Parentage analysis
We determined the genotypes of all the sampled adults and
seedlings with respect to all six of the markers, but the endocarps
were genotyped with respect to only three markers (QpZAG1/5,
QpZAG16, and MSQ13) in order to avoid miss-genotyping them.
After the genotyping we calculated the Polymorphism Information
Content (PIC) of each marker using the CERVUS program [19] to
estimate their resolution power. In CERVUS, PIC is defined as fol-
lowing formula:
PIC = 1 −
n
i=1
p
2
i
−
n−1
i=1
n
j=i+1
2p
2
i
p
2
j
where p
i
and p
j
are the frequencies of the ith and jth alleles in
the population. To identify the mother trees of the seedlings in the
four plots, we then detected adult trees with genotypes that exactly
matched those of endocarps at the three markers, regarding such
adults as the mothers of the respective seedlings. In cases where more
than one tree genotypically matched an endocarp, the other three
markers were also used to identify the true mother tree. However,
few endocarps from plot A were successfully genotyped. Therefore,
we identified the mother tree of seedlings whose endocarp had not
been found or genotyped in plot A, by recording the genotypes of
adults and the seedlings at six markers. Before this parentage analy-
sis, we calculated the total exclusion probability (EP) [4] for the first
parent in plot A using the CERVUS program in order to estimate the
resolution power of these six markers. The exclusion probability EP
l
at a locus l with k codominant alleles is given by:
EP
l
= a
1
− 2a
2
+ a
3
+ 3
(
a
2
a
3
− a
5
)
− 2
a
2
2
− a
4
where a
n
=
k
i=1i
p
n
i
And p
i
is the frequency of allele i,anda
1
= 1[4].
If then M loci are investigated, EP is:
EP = 1 −
M
l=1
(
1 − EP
l
)
We then conducted a simple parentage exclusion analysis by the fol-
lowing procedure. If a seedling matched no adult in the forest, its
parent trees were assumed to be located outside of the sampled plot.
Second, if a seedling matched only one adult in the plot, the match-
ing adult was assumed to be its maternal rather than paternal parent,
because of the low assumed probability of a female flower located
outside the plot being fertilized by pollen from within the plot and
developing a seed that is subsequently transported into the plot. Sim-
ilar approaches have been applied in previous studies [7]. Third, if a
seedling matched multiple adults in the forest, both of its parent trees
were assumed to be present in this forest, but its mother tree could
not be identified from the multiple candidates.
2.4. Seed dispersal analysis and supplementary survey
We calculated the spatial vectors (x, y, z) of seed dispersal based
on the positions of seedlings and their respective mother trees. The
direction of the horizontal (x and y) axes have no particular signifi-
cance, while the positive and negative orientations along the z axis
indicate up and down from the base of the maternal tree, respec-
tively. The mean horizontal and vertical dispersal distances were then
408 T. Ohsawa et al.
Table I. Field site characteristics and description of the Q. crispula sampled.
Plot A Plot B Plot C Plot D
Location Chichibu Chichibu Chichibu Yamanakako
Altitude 1100m 1300m 1200m 1000m
Study year 2004 2004 2005 2005
Mean gradient 31
◦
19
◦
9
◦
6
◦
Number
Adults 35 72 35 12
Collected seedlings 70 238 232* 126
Collected endocarps 52 216 125 120
Genotyped endocarps 36 172 116 104
Seedlings whose mother trees were identified 62** 111 79 83
* 1160 seedlings were found in plot C, but only 232 of them were randomly selected.
** Mother trees of seedlings whose endocarps were not genotyped in plot A were identified following the approach of Dow and Ashley [7].
calculated from the resulting vectors. To compare the dispersal dis-
tance distributions among plots, histograms were described. Upward
dispersal was distinguished from other dispersal events. To discrimi-
nate between upward dispersal mediated by animals and gravity, we
mapped the seed dispersal and crown projection of every mother tree
for which daughter seedling had been identified above the point at
which it was rooted. Seeds may fall from the crown of a mother tree
to sites above the point at which it is rooted. Thus, short upward dis-
persal within the mother tree’s crown projection is probably caused
by gravity. However, the seeds of Q. crispula are heavy and wind gen-
erally has little effect on their dispersal. So, upward dispersal beyond
the mother tree’s crown projection is probably caused by animals.
In this study, the seeds that had settled within the upper portion of
their mothers’ crowns were assumed to have been dispersed by grav-
ity, while those that had settled above and beyond their mother trees’
crowns were assumed to have been dispersed by animals.
2.5. Fine-scale genetic structure
Spatial genetic structure was assessed using a spatial autocorre-
lation approach for multilocus genotypes based on genetic distance
methods. For this purpose the distances between the seedlings and
adults in all four plots were classified in 5-m intervals, and the
GenAlEx 5.1 program [23] was used to calculate the spatial autocor-
relation coefficient (r) [27]. Briefly, Smouse and Peakall [27] defined
the genetic distance, d
ij
, between a pair of individuals, considering a
trio of codominant alleles (A, B, C) and a sextet of diploid genotypes.
In the triangle consisted of the three vertexes, d
ij
between heterozy-
gotes sharing a single allele (ex: AB and AC) is 1, and that between
any heterozygote and the opposite vertex homozygote (ex: AB to CC)
is
√
3. Again, d
ij
between any genotype and itself is 0. To obtain a
multilocus distance, Smouse and Peakall [27] simply add the squared
values of d
ij
across loci. The multilocus distance can be then used
to compute c
ij
which is the inter-individual covariance terms provid-
ing a measure of the tendency of the ith and jth individuals to vary
in the same genetic direction from the centroid. Finally, Smouse and
Peakall [27] defined the coefficient for all pairs of individuals that are
h steps apart as the following formula;
r
(h)
=
N
i j
x
(h)
ij
c
ij
N
i=1
x
(h)
ii
c
ii
where x
(h)
ij
= 1 for all pairs of individuals (i and j)thatareh spa-
tial distance classes apart, and x
(h)
ij
= 0 otherwise. The coefficient r
is a proper correlation coefficient, with a mean of zero when there
is no autocorrelation, and bounded by [−1, +1]. GenAlEx [23] of-
fers then tests for statistical significance, based on two methods with
999 permutations respectively: (i) random permutation and (ii) boot-
strap estimates of r.
3. RESULTS
The number of samples from each plot is listed in Table I.
The average PIC value with three markers in the four plots
was 0.8065, and the EP with six markers for the first parent
in plot A was 0.9967. The differences in genotypes among
adult trees allowed every adult to be discriminated from other
trees. There were also many uncharacterized seed dispersal
events due to the lack of endocarps to genotype or seed dis-
persal from outside the plot, but we identified mother trees
of 62 seedlings in plot A following the method described
above. In plot B, 108 seedlings matched just one adult. In ad-
dition, three seedlings each matched two adults at the three
markers, but the true mother trees of these seedlings was iden-
tified from their respective candidates using the other three
markers. Similarly, mother trees of 79 and 83 seedlings were
identified in plots C and D, respectively, using just the three
markers.
The mean spatial vector of seed dispersal was (x =
+3.84 m, y = −6.77 m, z = −5.07 m) in plot A, (x = −1. 95 m,
y = −5.63 m, z = −3.18 m) in plot B, (x =+7.14 m,
y = −4.92 m, z = −0.14 m) in plot C, and (x =+1.66 m,
y =+0.24 m, z = −0.26 m) in plot D. The mean horizontal
seed dispersal distances were 16.84, 10.38, 12.94 and 4.84 m
Seed dispersal and genetic structure on slopes 409
Table II. Mean horizontal and vertical seed dispersal distances, and spatial autocorrelation coefficients [23] for multilocus genotypes of
adults (r
a
) and seedlings (r
s
) at the 5 m scale, together with the probability of [r
a
or r
s
> permutated r] in the four Quercus crispula plots.
Plot A Plot B Plot C Plot D
Mean horizontal seed dispersal distance (m)* 16.84 (11.05) 10.38 (7.96) 12.94 (10.01) 4.84 (3.45)
Mean vertical seed dispersal distance (m)* –5.07 (11.57) –3.18 (3.44) –0.14 (3.09) –0.26 (9.59)
Autocorrelation coefficient (r
a
) at 5 m scale (adult) 0.06 0.04 0.05 0.00
Probability of (r
a
> permutated r) 0.128 0.029 0.078 1.000
Autocorrelation coefficient (r
s
) at 5 m scale (seedling) 0.04 0.05 0.12 0.10
Probability of (r
s
> permutated r) 0.014 0.001 0.001 0.001
∗
The value in parenthesis indicates standard deviation.
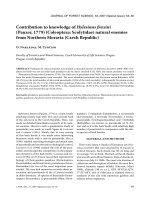
Figure 2. Distributions of seed dispersal distances along horizontal
and vertical axes in four Q. crispula plots. The minus and plus in
vertical distance mean downward and upward dispersals respectively.
in plots A, B, C, and D, respectively (Tab. II). The distribu-
tions of horizontal and vertical distances tended to be more
widen on steeper sites (Fig. 2). Addition to this, the distri-
bution of vertical distance biased left in plots A and B. Two
typical examples of seed dispersal on slopes are shown in Fig-
ures 3 and 4 (for plots A and B, respectively). Most seeds
were dispersed downwards, and the routes of some dispersed
seeds crossed. A few upward seed dispersal events were also
detected in plots A, B, and C. As illustrated in these figures,
eleven out of 12 upward dispersal events detected in plot A
and five out of 11 in plot B involved movement beyond the
crown projections of the mother trees.
There were no clear trends in the autocorrelation coeffi-
cients for the adults, but the autocorrelation coefficients of
first-year seedlings at the 5 m scale were 0.04, 0.05, 0.12
and 0.10 in plots A, B, C and D, respectively (Tab. II). There-
fore, the coefficients were low on steep slopes, while they were
relatively high on gentle slopes. But the probability for the au-
tocorrelation coefficient to be greater than that which would be
expected among a random sample from the sampled individu-
als, was less than 0.05 in every plot.
4. DISCUSSION
Both the PIC and EP of the microsatellite markers used
was high enough to identify the mother trees of seedlings,
and we detected evidence of both upward and downward dis-
persal events. The relatively large movement along x axis in
plot C might be attributed to the influence of strong winds
from west. But on the whole, distributions of seed dispersal
distances suggest that movements of most seeds were limited
along horizontal and vertical axes in plots C and D on gen-
tle slopes, but that many seeds were dispersed downwards in
plots A and B on steep slopes. This is the most likely rea-
son for why both the mean vertical and horizontal dispersed
distances were much greater in plot A, on the steepest slope,
than in the other plots. Large proportions of seeds (35%) in
plot B flowed from outside the plot, which may also be due
to the topographical slope. However, evidence of upward dis-
persal was often detected even in plot A on the steep slope.
We cannot definitively determine the cause of the upward dis-
persal from our data, but upward dispersal within the crown
projection of the mother trees was probably mediated by grav-
ity. However, evidence of long upward dispersal beyond crown
projections of the mother trees was also found, and such dis-
persal is more likely to be mediated by animals than by grav-
ity. Both rodents and birds are known to transport Q. crispula
seeds [20, 36]. However, rodents generally move oak seeds
horizontally or downhill to conserve energy [18], and birds
are the most likely to move seeds upwards. In support of this
hypothesis, upward bird-mediated dispersal of seeds of vari-
ous other species has been observed. For example, nutcrack-
ers (Nucifraga caryocataactes) often transport seeds of beech
(Fagus crenata), allowing F. crenata to immigrate into alpine
zones or other high-altitude areas [36].
The spatial genetic structure of the adult populations of
Q. crispula seemed to have no relation with topographical
410 T. Ohsawa et al.
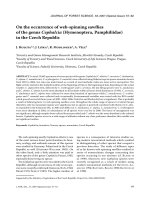
Figure 3. Seed flow, estimated from the adult and seedling genotype analysis in plot A. Contour lines are shown with intervals of 5 m. The
crown projections (hatched areas) are shown for mother trees whose seeds were dispersed upwards.
Figure 4. Seed flow, estimated from the adult and seedling genotype analysis in plot B. Contour lines are shown with intervals of 5 m. The
crown projections (hatched areas) are shown for mother trees whose seeds were dispersed upward.
slopes. However, this may have been because the number of
adults varied among the plots and the numbers of samples
may have been too low in some cases for reliable evaluation
of spatial genetic structure in these populations [15]. There-
fore, the difference in the results among plots may reflect dif-
ferences in sample size. For this reason the seedling data may
be more suitable for detecting relationships between genetic
structure and topographical slopes since more seedlings were
sampled than adults. Accordingly, larger spatial autocorrela-
tions amongst the seedlings were found on gentler slopes,
despite the differences in the numbers of seedlings sampled
in each plot. In other words, neighboring seedlings are more
likely to be related to each other on gentle slopes than on
steeper slopes. This is because most seeds are likely to be
dispersed within limited areas on gentle slopes, as reported
in several previous studies [16, 17, 33]. For example, Jones
et al. [16] found that the spatial autocorrelation coefficient (r)
for Quercus rubra seedlings at the 5 m scale was around 0.20
in a 40 × 80 m plot on flat ground in an aspen-white pine for-
est in northern Michigan, USA. However, many seeds were
dispersed relatively long distances from their mother trees on
the steep slopes we investigated, so low spatial autocorrela-
tion coefficients were found there. Another factor that may
have contributed to the weakness of the genetic structure on
the steep slopes was that the dispersal routes of some of the
seeds crossed, thereby merging the seed shadows of the mother
trees.
In conclusion, most seeds of Q. crispula are dispersed
downhill on steep slopes. Thus, neighboring seedlings are less
likely to be related to each other than those on flat sites, al-
though we found no relation between the genetic structure
(patchiness) of the adult populations and the topographical
slopes. In this study, we collected data only for Q. crispula,but
similar phenomena may affect other tree species whose seeds
Seed dispersal and genetic structure on slopes 411
Figure 5. Correlograms of spatial autocorrelation (r) of adults (left column) and first-year seedlings (right column) for multilocus genotypes
based on genetic distance methods [23] in four Q. crispula plots, with error bars showing the 95% confidence interval about r as determined
by bootstrap resampling. The two dotted lines in each correlogram show the 95% confidence intervals for the null hypothesis of no spatial
structure derived from the combined data set.
are dispersed by gravity. Therefore, more research is needed
to fully understand the effects of topographical slopes on the
seed dispersal and genetic structure of trees.
Acknowledgements: Dr. K. Ishida, of the Graduate School of Agri-
cultural and Life Sciences, the University of Tokyo, provided survey
references and helpful advice. We are pleased to acknowledge the
permission granted by Dr. S. Ishibashi, the chief of the University of
Tokyo’s Forest in Chichibu, and Dr. M. Kaji, the former chief, for us
to take samples. Mr. Y. Watano, Mr. M. Takagaki, Mr. K. Uchiyama,
and Mr. B. Wong, the laboratory of Forest Ecosystem Studies, helped
with our sampling. We wish to thank everyone mentioned above.
REFERENCES
[1] Berg E.E., Hamrick J.L., Regional genetic variation in turkey oak,
Quer cus l aevis, Can. J. For. Res. 23 (1992) 1270−1274.
[2] Berg E.E., Hamrick J.L., Fine-scale genetic structure of a turkey
oak forest, Evolution 49 (1995) 110−120.
[3] Cain M.L., Milligan B.G., Strand A.E., Long-distance seed disper-
sal in plant populations, Am. J. Bot. 87 (2000) 1217−1227.
[4] Chakravarti A., Li C.C., The effect of linkage on paternity calcula-
tions, in: Walker RH. (Ed.), Inclusion probabilities in parentage test-
ing, American Association of Blood Banks, Arlington, VA, 1983,
pp. 411−420.
[5] Chung M.Y., Nason J., Chung M.G., Kim K.J., Park C.W., Sun
B.Y., Pak J.H., Landscape-level spatial genetic structure in Quercus
acutissima (Fagaceae), Am. J. Bot. 89 (2002) 1229−1236.
[6] Cottrell J.E., Munro R.C., Tabbener H.E., Milner A.D., Forrest G.I.,
Lowe A.J., Comparison of fine-scale genetic structure using nuclear
microsatellites within two British oakwoods differing in population
history, For. Ecol. Manage. 176 (2003) 287−303.
[7] Dow B.D., Ashley M.V., Microsatellite analysis of seed dispersal
and parentage of saplings in bur oak, Quercus macr ocarpa,Mol.
Ecol. 5 (1996) 615−627.
[8] Dow B.D., Ashley M.V., Howe H.F., Characterization of highly
variable (GA/CT)
n
microsatellites in the bur oak, Quer cus macro-
carpa, Theor. Appl. Genet. 91 (1995) 137−141.
[9] Godoy J.A., Jordano P., Seed dispersal by animals: exact identifica-
tion of source trees with endocarp DNA microsatellites, Mol. Ecol.
10 (2001) 2275−2283.
[10] Grivet D., Smouse P.E., Sork V., A novel approach to an old prob-
lem: tracking dispersed seeds, Mol. Ecol. 14 (2005) 3585−3595.
[11] Hashizume H., Nakata G., Niizato T., Somego M., Takikawa
S., Uchimura E., Practical dendrology, Asakura, Tokyo, 1993 (in
Japanese).
[12] Hobson K.A., Using stable isotopes to trace long-distance dispersal
in birds and other taxa, Diver. Distri. 11 (2005) 157−164.
[13] Ishida K., The observation of the physical movement of bird com-
munity and mammal, The report of grant-in-aid for scientific re-
search from 1998 to 1999: study of forest ecosystem in a long-term
ecological research plot, 2000, pp. 56−72 (in Japanese).
[14] Ishida T.A., Kimura M.T., Assessment of within-population genetic
structure in Quercus crispula and Q. dentata by amplified fragment
length polymorphism analysis, Ecol. Res. 18 (2003) 619−623.
[15] Jensen J.S., Olrik D.C., Siegismund H.R., Lowe A.J., Population
genetics and spatial autocorrelation in an undamaged stand of
Quer cus petraea in Denmark, Scand. J. For. Res. 18 (2003)
295−304.
[16] Jones F.A., Hamrick J.L., Peterson C.J., Squiers E.R., Inferring col-
onization history from analyses of spatial genetic structure within
populations of Pinus str obus and Quercus rubra, Mol. Ecol. 15
(2006) 851−861.
412 T. Ohsawa et al.
[17] Kanazawa Y., Some analyses of the reproduction process of a
Quer cus crispula Blume population in Nikko. II. Analyses of spa-
tial distribution of individuals based on differences in tree size and
peroxidase isoenzyme bands, Jpn. J. Ecol. 32 (1982) 463−471.
[18] Li H J., Zhang Z B., Effects of rodents on acorn dispersal and
survival of the Liaodong oak (Quercus liaotungensis Koidz.), For.
Ecol. Manage. 176 (2003) 387−396.
[19] Marshall T.C., Slate J., Kruuk L., Pemberton J.M., Statistical con-
fidence for likelihood-based paternity inference in natural popula-
tions, Mol. Ecol. 7 (1998) 639−655.
[20] Miyaki M., Kikuzawa K., Dispersal of Quercus mongolica acorns
in a broadleaved deciduous forest 2. Scatterhoarding by mice, For.
Ecol. Manage. 25 (1988) 9−16.
[21] Muir G., Lowe A.J., Fleming C.C., Vogl C., High nuclear genetic
diversity, high levels of outcrossing and low differentiation among
remnant populations of Quercus petraea at the margin of its range
in Ireland, Ann. Bot. 93 (2004) 691−697.
[22] Nathan R., Muller-Landau H.C., Spatial patterns of seed dispersal,
their determinants and consequences for recruitment, Trends Ecol.
Evol. 15 (2000) 278−285.
[23] Peakall R., Smouse P.E., GenAlEx: Genetic analysis in Excel.
Population genetic software for teaching and research, Australian
National University, Canberra, Australia, www.anu.edu.au/
BoZo/GenAlEx/, 2001.
[24] Schnabel A., Hamrick J.L., Comparative analysis of population ge-
netic structure in Quercus macrocarpa and Q. gambelii (Fagaceae),
Syst. Bot. 15 (1990) 240−251.
[25] Seiwa K., Effects of seed size and emergence time on tree seedling
establishment: importance of developmental constraints, Oecologia
123 (2000) 208−215.
[26] Shiokawa S., Kagaya T., Movement and decomposition of litters on
mountainous slope: Colonies of Sasamorpha borealis var. borealis
prevent movement of litters and promote decomposition, Abstracts
of Annual Meeting of the Ecological Society of Japan 51 (2004)
644 (in Japanese).
[27] Smouse P.E., Peakall R., Spatial autocorrelation analysis of individ-
ual multiallele and multilocus genetic structure, Heredity 82 (1999)
561−573.
[28] Soons M.B., Ozinga W.A., How important is long-distance seed dis-
persal for the regional survival of plant species? Diver. Distri. 11
(2005) 165−172.
[29] Sork V.L., Examination of seed dispersal and survival in red oak,
Quer cus rubra (Fagaceae), using metal-tagged acorns, Ecology 65
(1984) 1020−1022.
[30] Steinkellner H., Fluch S., Turetschek E., Lexer C., Streiff
R., Kremer A., Burg K., Glossl J., Identification and char-
acterization of (GA/CT)
n
-microsatellite loci from Quercus
petraea, Plant. Mol. Biol. 33 (1997) 1093 (ckwell-
synergy.com/na102/home/ACS/publisher/synergy/journals/entities/
2013.gif) isn’t in document 1096.
[31] Suyama Y., Identification of mother trees based on microsatellite
analysis of maternal tissues from seeds, fruits, and seedlings, J. Jpn.
For. Soc. 86 (2004) 177−183 (in Japanese with English abstract).
[32] Trakhtenbrot A., Nathan R., Perry G., Richardson D.M., The impor-
tance of long-distance dispersal in biodiversity conservation, Diver.
Distri. 11 (2005) 173−181.
[33] Ubukata M., Itahana N., Kohono K., Examination of the mating of
Mizunara (Quercus mongolica var. grosseserata) in a natural stand
based on spatial genetic structure and inbreeding depression, J. Jpn.
For. Soc. 81 (1999) 280−285.
[34] University Forest of the University of Tokyo, Meteorological data,
/>(it was cited 12 Jan 2007).
[35] Wang B.C., Smith W.T., Closing the seed dispersal loop, Trends
Ecol. Evol. 17 (2002) 379−385.
[36] Watanabe S., Tree specia, Tokyo Univ. Press, Tokyo, 1994 (in
Japanese).
[37] Wright S., Isolation by distance, Genetics 28 (1943) 114−138.
[38] Zhou Z., Miwa M., Hogetsu T., Analysis of genetic structure of a
Suillus grevillei population in a Larix kaempferi stand by polymor-
phism of inter-simple sequence repeat (ISSR), New. Phytol. 144
(1999) 55−63.