Báo cáo lâm nghiệp: "Evaluation of competition and light estimation indices for predicting diameter growth in mature boreal mixed forests" pdf
Bạn đang xem bản rút gọn của tài liệu. Xem và tải ngay bản đầy đủ của tài liệu tại đây (1.34 MB, 14 trang )
Ann. For. Sci. 64 (2007) 477–490 Available online at:
c
INRA, EDP Sciences, 2007 www.afs-journal.org
DOI: 10.1051/forest:2007025
Original article
Evaluation of competition and light estimation indices for predicting
diameter growth in mature boreal mixed forests
Kenneth J. S
*
, Carolyn H
,K.DavidC, Zhili F,MarkR.T.D, Victor J. L
Department of Renewable Resources, General Services Building 751, University of Alberta, Edmonton, Alberta T6G 2H1, Canada
(Received 23 March 2006; accepted 15 February 2007)
Abstract – A series of conventional distance-independent and distance-dependent competition indices, a highly flexible distance-dependent crowd-
ing index, and two light resource estimation indices were compared to predict individual tree diameter growth of five species of mature trees from
natural-origin boreal mixed forests. The crowding index was the superior index for most species and ecosites. However, distance-independent in-
dices, such as basal area of competing trees, were also effective. Distance-dependent light estimation indices, which estimate the fraction of seasonal
photosynthetically-active radiation available to each tree, ranked intermediate to low. Determining separate competition indices for each competitor
species accounted for more variation than ignoring species or classifying by ecological groups. Species’ competitive ability ranked (most competitive to
least): paper birch ≈ white spruce ≈> trembling aspen > lodgepole pine > balsam poplar. Stratification by ecosite further improved model performance.
However, the overall impact of competition on mature trees in these forests appears to be small.
competition index / photosynthetically active radiation / distance dependence / growth model / boreal mixed forest
Résumé – Évaluation de la compétition et indices d’éclairement pour la prédiction de la croissance radiale dans des forêts boréales mixtes
adultes. Ce travail a évalué la capacité d’indices de compétition à prédire la croissance radiale individuelle d’arbres adultes de cinq espèces de forêts
mixtes boréales. Ont ainsi été comparés : (1) une série d’indices conventionnels de compétition indépendants ou dépendants de la distance, (2) un indice
très flexible d’encombrement dépendant de la distance et (3) deux indices d’estimation de l’éclairement. L’indice d’encombrement a été le plus efficace
dans la plupart des stations et des espèces. Cependant, les indices indépendants de la distance tels que la surface terrière des arbres en compétition,
ont été également efficaces. Les indices dépendants de la distance, d’estimation de l’éclairement, qui estiment la fraction saisonnière du rayonnement
photosynthétiquement actif disponible pour chaque arbre, se sont classés en position intermédiaire. L’identification d’indices de compétition spécifiques
de chaque espèce compétitrice a mieux rendu compte de la diversité des stations qu’un indice non spécifique ou qu’un classement des espèces par
groupes écologiques. L’aptitude à la compétition des espèces a été classée de la manière suivante (de la plus à la moins compétitive) : Betula papyrifera,
Picea glauca, Populus t remuloides, Pinus contorta, Populus balsamifera. La stratification par station améliore encore la performance du modèle.
Cependant, l’impact général de la compétition sur les arbres adultes dans ces forêts semble être faible.
indice de compétition / rayonnement photosynthétiquement actif / distance dépendante / modèle de croissance / forêt boréale mixte
1. INTRODUCTION
Mixed species forests cover 26 million ha of the boreal
plains and cordilleran regions of western Canada, compris-
ing 75% of the forest area in Alberta, 50% of the forests of
Saskatchewan, and a significant portion of southern Manitoba
and northeast British Columbia [41]. The natural origin, up-
land forests of this region have heterogeneous mixtures of
trembling aspen (Populus tremuloides), white spruce (Picea
glauca (Moench.) Voss), balsam poplar (Populus balsam-
ifera L.), lodgepole pine (Pinus contorta Dougl. ex. Loud.),
and paper birch (Betula papyrifera Marsh.), which may be
even- or uneven-aged [17, 38]. Management goals for these
forests focus on maintaining species and structural mixtures
for biodiversity and productivity [29, 34]. As these forests
are converted from natural to “semi-natural” managed sys-
* Corresponding author:
tems [29] there is a pressing need to develop management-
sensitive growth models to predict future yields. This study
was undertaken to evaluate methods of modeling the complex-
ity of intra- and inter-specific interactions in these forests.
Interactions among trees are frequently competitive,
but amensalism, commensalism, and facilitation occur as
well [15, 42]. Due to the predominance of competitive inter-
actions, indices to quantify inter-tree interactions and model
tree or stand growth have been characterized as competition
indices. These attempt to incorporate information about a sub-
ject tree and its neighbours, or the stand as a whole, in a way
that is thought to characterize the competition levels experi-
enced by the subject tree [9].
Distance-dependent indices are designed to capture fine-
scale changes in competition due to the spatial arrangement
of neighbours, while distance-independent indices ignore the
effects of distance within the prescribed plot area. For this rea-
son, some authors have suggested distance-dependent indices
Article published by EDP Sciences and available at or />478 K.J.Stadtetal.
may be more effective for describing effects of competition on
tree growth [27, 44, 49]; however, several comparative stud-
ies have found little difference between these [2, 16,19, 20,22,
33, 36, 51]. It can be argued that most of these comparisons
have been conducted in plantations, where there is limited
variation among individual tree neighbourhoods other than
the overall density [16], so distance-dependent indices may
perform more effectively in more heterogeneous stands. Cer-
tainly, as stem locations are expensive and time-consuming
to obtain, distance-dependent indices should demonstrate in-
cremental benefits over distance-independent indices to justify
their greater costs.
Competition indices vary in their degree of mechanis-
tic information [40]. Recent attempts to model light levels
reaching subject trees through the surrounding forest struc-
ture [3, 8, 10,11, 46] attempt to model the process of resource
competition (light capture and shading), while simpler indices
such as basal area or a distance-weighted size ratio [21] are
less obviously related to resources. Several studies have eval-
uated conventional vs. resource indices for predicting juvenile
tree growth reductions due to shrub, herb and tree competi-
tion [14,37, 48], but only one study has extended this compar-
ison to the growth of older trees [12].
Many of the published competition indices have been de-
veloped and tested in single species stands. Studies which have
applied competition indices to mixed species forests have gen-
erally treated all competing species similarly, other than al-
lowing for different crown, stem and root allometry [22, 33].
Crown and root zone size alone may not fully characterize
differences among species. Shade tolerant species, for exam-
ple, have much higher crown foliage density than intolerant
species, resulting in more light capture by crowns of similar
size [10, 11, 46]. Determining a separate competition index for
each species may offer an effective method of dealing with
species effects.
In the absence of competition, tree size affects the potential
growth response. Younger trees develop more leaf area as they
grow, increasing their photosynthetic capacity and their poten-
tial volume and stem diameter increment. However, due to the
increasingly large bole perimeter, diameter increment may de-
cline in mature individuals [18]. In inventory data where only
stem diameter is measured, the effect of initial tree size may
therefore be non-linear and unimodal.
Site quality is also a critical variable in forest growth mod-
eling as it affects growth rates and may alter the competitive
interactions among species. Frequently the past height growth
rate of dominant trees (site index) is used to quantify site qual-
ity, but this data is often lacking in the boreal region. An al-
ternate approach is to stratify the data by ecosites, which are
designated based on climate, local topography, soil properties,
and indicator species, and exhibit a relatively narrow range of
SI [4,5,24].
The objective of this paper is to use the large dataset of
natural-origin, spatially-mapped trees in the permanent sample
plot (PSP) program maintained by the Alberta Land and For-
est Division [1] to compare competition indices for modeling
the growth of individual trees. Specifically we wanted to test:
(1) the effectiveness of conventional distance-independent and
distance-dependent competition indices as well as distance-
dependent light resource indices as predictors of future tree di-
ameter growth, (2) examine differences in competitive ability
among the common boreal forest species, (3) compare func-
tions for determining the effect of tree size on diameter incre-
ment, and (4) determine if competitive ability and coefficients
for competition indices are different across ecosites.
2. METHODS
2.1. Growth and competition data
The Alberta Land and Forest Division Permanent Sample Plot
(PSP) program is a network of more than 600 plots covering the
forested areas of the province [1]. The earliest plots were established
in 1960, and additional plots have been added up to the present. The
original purpose of these plots was to determine the optimal rotation
age for this forest, consequently plots were placed in stands nearing
merchantable size, which were typically older than 60 years. Remea-
surement intervals varied from 3–11 years. PSP areas are from 200 to
2000 m
2
. For this study, only plots equal to or larger than 400 m
2
were
used to allow an adequate buffer for calculating distance-dependent
competition indices.
PSPs have been established in many ecosites; however, as num-
bers are low in some, we chose plots from the four most frequent
and commercially important mixedwood ecosites: boreal mixedwood
(BM) d and e, and lower foothills (LF) e and f. The BM ecoregion is
characterized by typical maximum summer temperatures of 20.2
◦
C,
mean annual temperatures of 1.5
◦
C and 389 mm of precipitation. The
LF ecoregion is at higher elevation, has cooler summers (18.3
◦
C typ-
ical maximum) and 75 mm more precipitation than the BM area. The
BMd and LFe ecosites are characterized by the presence of Viburnum
edule and have a mesic moisture class and medium nutrient class.
BMe and LFf ecosites are subhygric and rich. The former is char-
acterized by Cornus stolonifera and the latter by Lonicera involu-
crata [4, 5].
Individual tree data included the tree species, a disease and dam-
age assessment, stem diameter at breast height (dbh;1.3m),and
stem location as distance and bearing from plot centre. Only the trees
with dbh greater or equal to 9.1 cm were consistently identified and
mapped. The top height and live crown length of one to three trees in
most of the PSPs were also measured.
In this study, the five most abundant tree species in the PSPs, trem-
bling aspen, balsam poplar, paper birch, lodgepole pine, and white
spruce, were selected for analysis. Lodgepole pine rarely occurs in the
BM ecosites, and paper birch did not occur in BMe PSPs, so analysis
of these species was confined to ecosites where they are common.
Jack pine (Pinus banksiana) is abundant in the boreal mixedwood re-
gion, but uncommon in the PSP dataset, since few plots were located
in northeast region of the province. PSPs with a significant presence
(defined as 5% of the total plot basal area at breast height, BA) of
species other than the common species noted above, were excluded
from the analysis. Where other species occurred at low abundance
(< 5% BA) they were assigned to the most ecologically similar com-
petitor species, i.e. black spruce and balsam fir were treated as white
spruce in all ecosites, as were lodgepole pine and jack pine in BM
ecosites. Growth increment data from these less common species was
not used in the analysis. Dead trees were ignored completely.
Competition indices in boreal mixed forest 479
Annual diameter growth increments were calculated for undam-
aged subject trees, which occurred near the centre of the plot, a min-
imum of 8 m from the plot edge and within a 20 × 20 m square area
surrounding plot centre. Annual growth was calculated as the change
in diameter between remeasurements divided by the remeasurement
interval. Since the numerous plots and trees provided ample spatial
replication, only the first remeasurement interval was used in this
analysis, avoiding temporal dependencies in the data.
2.2. Competition indices
A series of distance-independent, distance-dependent competition
and light estimation indices (Tab. I) were calculated for each sub-
ject tree. Distance-independent indices were calculated based on trees
in the central 20 × 20 m section of each PSP. To attempt to cap-
ture the asymmetric nature of competition for light in a distance-
independent index, the sum of competitor basal area indices was also
determined using only the trees with greater height than the subject
tree (CBA > H; Tab. I). Height was estimated from stem diameter us-
ing the provincial height vs. diameter equations [23]. Most distance-
dependent indices were calculated using an 8 m search radius of each
subject tree. This was a practical radius given the size of the plots and
approximately conforms to Lorimer’s [33] recommendation of a plot
radius approximately 3.5 times the radius of the crowns of the conif-
erous trees. We also tested an angle gauge selector to include trees if
the elevation angle from the mid-crown position on the subject tree
to the top of the competitor tree was greater than 45
◦
. Gauges that
include trees based on the horizontal angle to the competitor trees’
diameter have been more commonly tested in the literature, but for
mixtures of species with different stem-crown allometry and compet-
itive ability, the elevation angle gauge makes more sense in terms of
competition for light [51]. The 45
◦
angle limit was chosen since this
approximates the average elevation angle of the brightest region of
the sky over the growing season (determined using techniques out-
lined in previous work [43, 46]. We used the 45
◦
gauge for two in-
dices: the sum of horizontal angles (HAS45) and the sum of sine of
elevation angles (SEAS45) (Tab. I). We developed the SEAS45 index
as an elevation angle analog to Lin’s [32] horizontal angle sum.
To determine the impacts of neighbours of different species within
each ecosite, conventional competition indices were calculated sepa-
rately for each species of competitor. These competitor species in-
dices were then used with subject tree diameter (see below) in a
multiple regression model to predict future growth of the subject
tree (Eq. (4)). To introduce ecosite, we fit lengthy linear models us-
ing Equation (4) plus additional indicator variables for ecosite and
ecosite interactions with initial dbh and each competitor species’ in-
dex. These models (one for each competition index listed in Tab. I)
were then compared in terms of the model’s R
2
and RMSE. We
also tested for similarity among the competitive ability of ecologi-
cal groupings of species by calculating selected competition indices
at a group level rather than a species level. Groups tested were hard-
wood (aspen, poplar, birch) and softwood (spruce, pine), shade toler-
ant (birch, spruce) and shade-intolerant (aspen, poplar). A model was
also tested that combined all species into a single competition in-
dex (e.g. total competitor basal area vs. species-specific basal area).
The test was for a reduction in the residual sum-of-squares compar-
ing group-level to species-level competition indices [39]. For groups
of species, Equation 4 was used, with the competition index calcu-
lated and a corresponding coefficient estimated for the group (e.g.
β
Hardwood
CI
Hardwood
).
The crowding index [12] is a more flexible extension of traditional
distance-dependent competition models, and has been incorporated
into the spatially-explicit SORTIE-BC forest dynamics model [13].
The crowding effect of a neighbouring tree on the diameter growth
of a subject tree of a given species is assumed to vary as a power
function of the size of the neighbour, and as an inverse power func-
tion of the distance to the neighbour. The net effect of an individual
neighbour is multiplied by a species-specific modifier (λ
i
) that ranges
from 0 to 1 and allows for differences among species in their compet-
itive effect on the subject tree. The analysis also estimates the neigh-
bourhood area as a fraction of the maximum neighbourhood radius
(8 m). The best performing formulation of this crowding index from
Canham et al. [12] was tested here (CRWD∼, Tab. I, Eq. (5)).
The light resource indices were estimates of the average grow-
ing season (May to September) transmission of photosynthetically-
active radiation as a percentage of above-canopy radiation at the cen-
ter of each subject tree crown (with the subject crown removed).
This was estimated using two PAR penetration algorithms [12, 46].
Both algorithms summarize the radiation sources (sunlight, skylight)
into a hemispherical radiance distribution then use this distribution
to weight the penetration of beams into the tree canopy. In the sim-
pler PAR penetration model, (PARO = PAR model with O
paque
crowns, [12]), tree crowns are represented as rectangular billboards
orthogonal to a line drawn from the crown center of the subject tree
to the neighbour, and with the height, crown length and width of the
tree. The crowns are assumed to be opaque, as previous work indi-
cated that intercrown gaps account for much of the light penetration in
northern coniferous forests [11,26]. PAR transmission is estimated as
the radiance-weighted proportion of 21 600 rays which do not inter-
cept a crown, each ray representing areas of equal solid angle across
the upper hemisphere above 30 degrees elevation.
The more complex PAR penetration model (PART = PAR model
with T
ransmissive crowns, [46]) uses a similar radiance-weighted,
beam penetration technique to calculate PAR transmission, but in-
cludes both inter- and intra-crown gaps. It represents individual tree
crowns as geometric shapes (cylinders, cones, ellipsoids, paraboloids
or combinations) and places leaf area randomly within each geomet-
ric crown. Rays that intersect crowns have their PAR transmission re-
duced by the probability of finding a gap over the distance the beam
travels through the crown, given the leaf area density and leaf incli-
nation distribution specified for crowns of that species. Interspecific
differences are accounted for in this model, both in terms of crown
size – stem diameter relationships and within-crown leaf area density
and inclination. 480 rays are traced across the full upper hemisphere,
and their transmission values are radiance-weighted to give the aver-
age seasonal PAR transmission value.
The two PAR indices required several variables that were not in-
cluded in the original PSP data set. Tree height was calculated from
the provincial height vs. stem diameter functions [23]. Crown length
and crown width were also estimated from diameter, using functions
developed in this region [47]. Species-specific crown shapes, leaf area
density and leaf inclination values for the PART index were taken
from [46].
2.3. Subject tree size effects
Ideally, the effect of subject tree size on potential diameter growth
is assessed by monitoring competition-free phytometer trees [9]. In
our natural origin boreal stands, this information is not available and
must be estimated from the available data. We assumed that potential
480 K.J.Stadtetal.
Table I. Conventional competition and light resource indices tested in this study.
Index Abbreviation Formula
e
(units)
No competition (Eqs. (1), (3)) NOCI
Basal area
a
– all competitors CBA
i
1
A
π
4
n
i
j=1
dbh
2
ij
– taller competitors CBA>H
i
(m
2
/ha)
Sum of ratios of competitor to C/SDBH
i
1
A
1
dbh
st
n
i
j=1
dbh
ij
subject dbh [33]
a
(/m
2
)
Sum of ratios of competitor to C/SBA
i
1
A
1
dbh
2
st
n
i
j=1
dbh
2
ij
subject tree basal area [16]
a
(/m
2
)
Sum of overtopping competitor CRCOV
π
A
n
i
j=1
cr
2
ij
crown areas [7]
a
(unitless)
Hegyi [21]
b
HEYG8
i
1
dbh
st
n
i
j=1
dbh
ij
d
ij
+ 1
(/m)
Martin-Ek [36]
b
MAEK8
i
1
dbh
st
n
i
j=1
dbh
ij
exp
−
16 × d
ij
dbh
ij
+ dbh
st
Alemdag [2]
b
ALEM8
i
π
n
i
j=1
dbh
st
× d
ij
dbh
st
+ dbh
ij
2
dbh
ij
/d
ij
n
s
t=1
dbh
ij
/d
ij
Horizontal angle sum
c
HAS45
i
2
n
i
j=1
tan
−1
1
2
dbh
ij
d
ij
(Lin [32])
c
(radians)
Sine of elevation angle sum SEAS45
i
n
i
j=1
sin
tan
−1
h
ij
−
h
st
−
1
2
cl
st
d
ij
(radians)
Crowding [12]
d
CRWD
i
n
s
i=1
λ
i
n
i
j=1
dbh
α
ij
d
β
ij
(cm
α
/m
β
)
Seasonal PAR, opaque crowns [12] PARO See Materials and methods
Seasonal PAR, transmissive PART See Methods
crowns [46]
a
Distance-independent indices calculated based on trees selected in the central 20 × 20 m region of the plot but are scaled to be independent of
plot area.
b
Distance-dependent indices based on an 8 m search radius.
c
Distance-dependent indices based on a > 45 elevation angle selection.
d
Distance-dependent index based on a search radius 8 m (see Methods).
e
dbh (cm) is stem diameter at 1.3 m height, n
s
is the number of competitor species, n
i
is the number of trees of competitor species i in the plot,
j is the competitor tree number, s is the subject tree species, t is the subject tree number, A (m
2
) is the plot area, and cr
ij
is the crown radius (m)
of the competitor, d
ij
(m) is the distance from the competitor tree to the subject tree, h(m) is tree height, and cl(m) is crown length. The subject
tree was not included as a competitor in any index.
Competition indices in boreal mixed forest 481
diameter growth would vary with the diameter of the target tree. We
tested two growth vs. diameter functions: a simple linear function
(Eq. (1)) and a log-normal function (Eq. (2)). These represent two
strategies to model the balance of leaf area and maintenance demands
as well as allocation changes as a tree increases in size [12].
POTG
st
= β
0,s
+ β
dbh,s
dbh
st
(1)
POTG
st
= MAXG
s
exp
−
1
2
ln
(
dbh
st
/m
s
)
b
s
2
(2)
Here POTG
st
is the annual breast-height diameter growth of a tree t
of species s without competition, dbh
st
is the current diameter of the
same tree, MAXG
s
is the maximum diameter growth achieved by the
species at a diameter of m
s
,andb
s
is the standard deviation (breadth)
of the species’ log-diameter response. These parameters were esti-
mated simultaneously with coefficients for the competition indices.
2.4. Growth models
Diameter growth of a subject tree was modeled first by testing
the current diameter effect alone without competitor effects (NOCI,
Eq. (3)), then by adding the competition effect of the various species
(Eq. (4)). The reduction in the sum of squares from Equations (3)
to (4) measures the effect of including competition.
G
st
= POT G
st
+ ε
st
(3)
G
st
= POT G
st
+ β
Aspen
CI
Aspen
+
β
Poplar
CI
Poplar
+ β
Birch
CI
Birch
+ β
Pine
CI
Pine
+ β
Spruce
CI
Spruce
+ ε
st
(4)
Here, G
st
is the annual diameter growth of subject tree t of species s,
POTG
st
is the annual stem diameter growth of a tree of this size and
species without competition (Eq. (1) or (2)), β
Aspen
,β
Poplar
, β
Birch
,
β
Pine
,andβ
Spruce
are the coefficients for the competition indices
for each competitor species (CI
Aspen
,CI
Poplar
, CI
Birch
, CI
Pine
, and
CI
Spruce
; see Tab. I for formulae for each index), and ε
st
is the er-
ror, which was assumed to be independent and normally distributed
for these and all subsequent models. A multiplicative model of ini-
tial size and species’ competitive effects was also assessed; however,
like Canham et al. [12], we found the additive model (Eq. (4)) much
superior. A multiplicative model may perform well for juvenile and
mid-rotation growth, but for mature stands, size and competition ap-
pear to have additive effects.
For the neighbourhood crowding index, the competitor species ef-
fects are estimated by both the magnitude of the crowding coefficient,
c, and the individual species’ coefficients, λ
i
. The software written to
estimate these coefficients [12] did not include the ability to estimate
a linear current diameter effect, so only the log-normal function was
tested for this index. The growth model is given by Equation (5),
G
st
= MAXG
s
exp
−1/2[ln(dbh
st
/m
s
)/b
s
]
2
+ c
Σ
i
[λ
i
Σ
j
(dbh
α
ij
/d
β
ij
)]
+ ε
st
(5)
where dbh
ij
is the breast-height diameter (cm) of the jth competing
tree of species i,andd
ij
is the distance (m) from the subject tree to
this competitor. The exponents α and β are coefficients that modify
the shape of the diameter and distance response.
Table II. Plot density and basal area by ecosite and species for the Al-
berta Land and Forest Division mixedwood permanent sample plots.
Ecosite Species Plots
(# of plots) Density (stems/ha) Basal area (m
2
/ha)
Mean Min Max Mean Min Max
BMd All 1066 20 2173 25.3 0.6 49.6
(109) Aspen 582 5 1930 12.4 0.2 37.7
Birch 110 5 1481 1.7 0.1 15.0
Poplar 129 5 690 3.3 0.1 23.2
Spruce 559 5 2148 15.2 0.2 36.3
BMe All 795 30 1630 28.9 0.2 50.3
(13) Aspen 275 30 1160 7.0 0.2 13.1
Birch 43 5 70 1.0 0.2 2.0
Poplar 204 10 460 7.9 1.0 19.2
Spruce 671 320 1290 28.4 18.1 41.1
LFe All 884 110 2467 29.0 3.2 51.1
(82) Aspen 338 5 1498 11.0 0.2 33.9
Birch 71 10 247 1.7 0.1 7.0
Poplar 127 5 425 4.1 0.0 17.4
Pine 528 10 2437 15.9 0.2 35.6
Spruce 356 5 1235 12.9 0.0 51.1
LFf All 903 89 2519 28.7 10.2 44.7
(95) Aspen 108 5 1540 5.4 0.1 20.4
Birch 49 5 198 1.2 0.1 5.9
Poplar 97 5 360 3.9 0.2 9.7
Pine 785 5 2173 22.8 0.5 35.8
Spruce 218 2 1187 8.3 0.1 40.2
The seasonal PAR resource indices account for the species com-
position surrounding the subject tree by determining light penetra-
tion between and through the crowns of the different species. Since
species effects are thus accounted for already, the growth model us-
ing the PARO or PART indices (PAR_) is given by Equation (6). To
convert the PAR indices from light availability to shading (i.e. com-
petition), we used their complement (i.e. shading = 100 – PAR_).
G
st
= POTG
st
+ β
PAR
× (100 − PAR_) + ε
st
(6)
To allow for separate indices of above and below ground competi-
tion, we also tested combinations of light resource and conventional
indices. The first assumed competitor basal area captured the below-
ground competition [27] if the transmissive tree PAR index simulta-
neously captured above-ground competition (CBA+PART, Eq. (7)).
G
st
= POT G
st
+ β
Aspen
CBA
Aspen
+ β
Poplar
CBA
Poplar
+ β
Birch
CBA
Birch
+
β
Pine
CBA
Pine
+ β
Spruce
CBA
Spruce
+ β
PAR
(100 − PART) + ε
st
(7)
where CBA is the basal area per hectare of the competitors of the
subscript species and the other indexes and coefficients are as defined
above.
The second combination tested crowding as the below-ground in-
dex of competition and opaque tree PAR as the above-ground index
(CRWD+PARO, Eq. (8)).
G
st
= MAXG
s
exp{−1/2[ln(dbh
st
/m
s
)/b
s
]
2
} + c{Σ
i
[λ
i
Σ
j
(dbh
α
ij
/d
β
ij
)]}
+ β
PAR
(100 − %PARO) + ε
st
. (8)
482 K.J.Stadtetal.
Table III. Mean and range of stem diameter (dbh) and annual diameter increment of subject trees in each species and ecosites.
Ecosite Species # of trees dbh (cm) Annual dbh growth (cm/y)
Mean Min Max Mean Min Max
BMd Aspen 1160 15.7 9.1 48.8 0.038 –0.178 0.728
Birch 130 14.5 9.1 31.2 0.038 –0.092 0.340
Poplar 216 17.6 9.1 53.4 0.048 –0.040 0.714
Spruce 668 18.3 9.1 66.0 0.032 –0.120 0.728
BMe Aspen 99 17.0 9.1 46.8 0.064 0.000 0.640
Poplar 96 22.1 9.2 48.8 0.070 –0.080 0.614
Spruce 127 22.1 9.1 67.1 0.032 –0.066 0.640
LFe Aspen 646 19.7 9.1 51.3 0.048 –0.100 0.684
Birch 71 17.5 9.4 29.5 0.054 –0.050 0.328
Poplar 235 19.1 9.1 39.1 0.066 0.000 0.716
Pine 579 19.5 9.1 47.2 0.034 –0.072 0.684
Spruce 447 21.2 9.1 56.6 0.054 –0.066 0.766
LFf Aspen 283 25.0 9.1 55.6 0.088 –0.072 0.716
Birch 83 16.9 9.1 31.2 0.034 –0.100 0.328
Poplar 235 20.9 9.1 58.9 0.124 0.000 0.766
Pine 2065 19.9 9.1 54.1 0.050 –0.134 0.766
Spruce 457 21.7 9.1 60.2 0.058 –0.162 0.794
2.5. Model fitting, comparison and reduction
Ordinary least-squares regression was used to fit growth mod-
els with conventional empirical indices and linear current diameter
functions (PROC REG, SAS v.9.1, SAS Institute Inc. 2004). The
full model, including all competitor species, ecosite and interaction
effects, was used to compare competition indices. Best subsets re-
gression was used to determine the best fitting (highest R
2
) combina-
tion of competitor species’ CBA indices that had significance levels
greater than 0.05. An iterative least-squares procedure using a secant
approximation (PROC NLIN METHOD=DUD, SAS v.9.1, SAS In-
stitute Inc. 2004) was used to fit the conventional and PART indices
using the log-normal current diameter function. We used the diameter
of the largest tree of each species – ecosite combination to set the ini-
tial value for the diameter (m
s
, Eq. (2)) at maximum growth. Since the
crowding index has coefficients nested within the summation (Eq. (5),
Tab. I), more complex techniques were required to estimate these pa-
rameters. We used maximum likelihood with simulated annealing to
fit this model (see [12] for details).
For the commonly used competitor basal area index (CBA),
we tested for differences due to distinguishing ecosites, competi-
tor species, and competitor hardwood/softwood and shade toler-
ant/intolerant groups with a test for differences in residual sums-
of-squares between the more detailed “full” (SS
res, full
) and reduced
models (SS
res,reduced
) [39]. For distinguishing ecosites, we compared
the SS
res
values from fitting Equation (4) separately to each ecosite
(SS
res, full
= SS
res,BM d
+ SS
res,BM e
+SS
res,LF e
+SS
res,LF f
)totheSS
res
from fitting Equation (4) once to all ecosites together (SS
res,reduced
).
For distinguishing among competitor species, we computed resid-
ual sums of squares using Equation (4) vs. a modification of this
equation with only one competition index term (and only one β)
calculated across all species (SS
res,reduced
). We also compared distin-
guishing among all species (SS
res, full
, Eq. (4)) with only considering
hardwood/softwood or shade tolerant/intolerant groups by modify-
ing Equation (4) to determine competition indices for these groups
(SS
res,reduced
). The F statistic for these comparisons is given by Equa-
tion (9) with (df
res,reduced
df
res, full
)anddf
res, full
degrees of freedom.
F =
SS
res,reduced
−SS
res, full
df
res,reduced
−df
res, full
SS
res, full
df
res, full
· (9)
3. RESULTS
The plot density and basal area for the five subject species
(aspen, balsam poplar, lodgepole pine, paper birch and white
spruce) are summarized by species and ecosite in Table II.
Each species showed a wide range of variation in density and
basal area within each ecosite, although birch and poplar were
generally less abundant components of the plots. In the BMe
plots, which are wetter and richer [4], aspen was also less
abundant. White spruce had the largest range of initial diam-
eter as well as the highest diameter growth rates (Tab. III)
in the data set, followed closely by poplar, aspen and pine,
while birch were smaller trees with less than half the diame-
ter growth of other species (Tab. III). Negative growth values
were seen frequently in suppressed trees. This is a common
problem in a harsh climate where measurement error is fre-
quently larger than the growth of suppressed trees, even over
long remeasurement intervals.
A linear model of initial subject tree diameter alone with-
out competition effects (Eqs. (1) and (3), NOCI in Fig. 1) ac-
counted for 11 to 31% of the total variation (i.e. the coeffi-
cient of determination, R
2
) in diameter growth across ecosites.
When fit separately by ecosite, this model was not signifi-
cant (P > 0.05) in three cases: aspen in the BMd ecosite,
birch in the BMd ecosite, and poplar in the LFf ecosite. For
Competition indices in boreal mixed forest 483
pine, the log-normal function of diameter (Eqs. (2) and (3))
was marginally better (larger coefficient of determination) than
the linear function, but for all other species across the four
ecosites, values of the coefficient of determination (R
2
)were
similar (data not shown). Further, the diameter at maximum
growth parameter (m
s
) converged on values near or greater
than the maximum diameter for each species in the data, so
that these log-normal functions describe an increase in diam-
eter growth with current diameter up to the maximum values,
similar to the linear diameter function.
However, since the trees in these data were subject to vary-
ing degrees of competition, the subject-tree diameter effect
is better evaluated when coupled with a competition index
(Eqs. (4) and (5)). In this case, the effects of diameter were
similar. Linear functions of diameter were significant for most
species and ecosites (Tab. IV). Here too, the log-normal diam-
eter function converged on typically high values of diameter
(m
s
, Tab. IV) at maximum growth. R
2
values were virtually
identical for both the linear and log-normal diameter functions
and inspection of residuals demonstrated no obvious patterns
to favour one function over the other. The linear function of
diameter is more parsimonious (2 vs. 3 parameters), though
both functions yielded similar trends for the range of diameter
in this data.
All diameter growth models were significant with residual
standard errors of 0.06–0.15, and coefficients of determination
(R
2
) varying from 0.08 to 0.55 (Fig. 1, Tabs. IV and V). These
models accounted for significantly more of the total variation
than a model based on subject-tree diameter (NOCI) alone
(P < 0.05).
To check for collinearity among the predictors, we exam-
ined the condition number [39] for each linear model be-
fore any model reduction was performed (Tab. IV). The birch
growth model for the BMe ecosite had a condition number
(= 40) that was greater than the critical value of 30 [39], indi-
cating a moderate degree of collinearity. Further investigation
indicated that the presence of birch in this ecosite was weakly
associated with aspen, so some caution would be prudent in
using the parameters of this model. No significant collinearity
was found for the predictors in other species and ecosites.
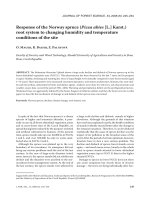
Figure 1 shows the coefficient of determination (R
2
)of
each competition index model including ecosite and ecosite
interactions in order to assess the effectiveness of the nu-
merous competition indices across ecosites by each subject
tree species. Among the single competition index models,
the distance-dependent crowding index (CRWD) was supe-
rior for all species except aspen. The distance-dependent
Martin-Ek index (MAEK8) and sum of the sine of the el-
evation angles (from subject tree midcrown to competitors’
apices; SEAS45) were second and third in rank, followed
closely by several distance-independent indices, basal area
of competitors (CBA), Biging and Dobbertin’s [7] overtop-
ping crown cover (CRCOV), and basal area of taller com-
petitors (CBA > H). The competitor/subject tree size ratio
indices (HEYG8, C/SBA, C/SDBH) were intermediate and
there was no consistent improvement in fit in Heygi’s [21]
distance-dependent diameter ratio index over a similar but
distance independent index (C/SDBH, [33]). Alemdag’s [2]
Figure 1. Coefficients of determination (R
2
) for models with current
subject-tree diameter response functions only (Eqs. (1–3), NOCI) and
models with both current diameter response functions and competi-
tion indices (Eqs. (4–8), abbreviations and formulae for competition
indices are listed in Tab. I). To evaluate which are the more effective
competition indices overall, results shown here are for models com-
mon to all ecosites. Distance-dependent models are shown in white,
distance-independent in gray. The response variable is the annual di-
ameter growth of each of the five subject species.
484 K.J.Stadtetal.
Table IV. Regression coefficients and statistics for a model using a linear function of subject tree diameter (dbh, cm) and the basal area of the
competitors of each species as the competition index (Eq. (4)). The response variable is annual diameter growth at breast height (cm/y).
Ecosite Species R
2
Residual Coefficients for a linear Coefficients for competitor basal Condition number
standard growth response to subject tree dbh area as a competition index
a
(before model reduction
b
)
error Intercept (β
0
) β
dbh
β
Aspen
β
Birch
β
Poplar
β
Pine
β
Spruce
BMd Aspen 0.16 0.109 +0.188 +0.00539 –0.00342 * * –0.00586 8.37
Birch 0.32 0.071 +0.291 * –0.00795 –0.00862 * –0.00876 24.62
Poplar 0.30 0.111 +0.162 +0.00587 –0.00587 * * –0.00576 11.31
Spruce 0.34 0.099 +0.220 +0.00515 * * * –0.00635 12.92
BMe Aspen 0.26 0.116 +0.359 * –0.00770 –0.00549 –0.00659 10.10
Poplar 0.11 0.121 +0.250 * * * –0.00471 10.48
Spruce 0.35 0.095 +0.089 +0.00617 * * –0.00261 13.18
LFe Aspen 0.36 0.093 +0.145 +0.00807 –0.00439 * * –0.00476 –0.00651 11.30
Birch 0.27 0.062 –0.009 +0.00878 * –0.00338 * * * 40.88
Poplar 0.08 0.116 +0.142 +0.00544 * * * –0.00262 * 10.72
Pine 0.23 0.088 +0.034 +0.00797 –0.00373 * –0.00359 * –0.00944 14.70
Spruce 0.51 0.109 +0.279 +0.00688 –0.00769 –0.00414 * –0.00348 –0.00738 11.86
LFf Aspen 0.25 0.129 +0.143 +0.00699 –0.00537 * +0.00374 * –0.00627 12.93
Birch 0.27 0.072 –0.062 +0.00876 * * * * * 14.06
Poplar 0.17 0.145 +0.366 * –0.00574 –0.01264 * * –0.00783 11.53
Pine 0.19 0.090 +0.082 +0.00796 –0.00480 –0.01180 –0.00711 –0.00222 –0.00570 15.84
Spruce 0.32 0.118 +0.191 +0.00623 –0.00635 * –0.00863 –0.00288 –0.00411 13.57
a
An asterisk (*) indicates this regressor was removed by best subsets regression. Where cells are blank, the subject species did not occur in sufficient
numbers to estimate a coefficient.
b
Condition number with all competitor species included in the model.
Table V. Regression coefficients and statistics for a model using a log-normal function of subject tree diameter (dbh, cm) and the neighbourhood
crowding index (Eq. (5)). The response variable is annual diameter growth at breast height (cm/y).
Ecosite Subject R
2
Residual Coefficients for a Coefficients for Search
tree species standard lognormal growth response the crowding index radius, R (m)
error to subject tree dbh
MAXG m
s
bcλ
Aspen
λ
Birch
λ
Poplar
λ
Pine
λ
Spruce
αβ
BMd Aspen 0.22 0.106 0.449 106.5 2.02 –0.782 0.312 0.034 0.249 0.065 0.690 2.316 0.161 5.7
Birch 0.42 0.068 0.208 98.6 3.00 –0.038 0.167 0.001 0.042 0.726 0.918 0.134 0.308 5.3
Poplar 0.34 0.110 0.369 55.0 1.32 –0.351 0.401 0.727 0.191 0.001 0.745 1.612 0.692 5.8
Spruce 0.41 0.095 0.410 100.9 2.89 –0.258 0.012 0.101 0.158 0.900 0.743 1.560 0.649 7.6
BMe Aspen 0.40 0.111 0.455 29.6 1.14 –0.773 0.851 0.040 0.256 0.151 0.695 2.891 0.013 7.5
Poplar 0.48 0.100 0.480 82.0 2.01 –0.956 0.367 0.791 0.520 0.621 0.795 2.181 0.728 6.8
Spruce 0.55 0.082 0.351 113.4 1.55 –0.013 0.021 0.097 0.119 0.921 0.957 0.067 0.365 3.4
LFe Aspen 0.28 0.099 0.392 64.0 1.31 –0.228 0.396 0.143 0.016 0.476 0.879 2.525 0.001 8.0
Birch 0.40 0.061 0.450 139.1 1.48 –0.550 0.254 0.969 0.262 0.033 0.273 2.810 0.050 6.1
Poplar 0.16 0.114 0.335 54.1 1.93 –0.047 0.629 0.031 0.159 0.431 0.466 0.753 0.541 8.0
Pine 0.29 0.085 0.282 30.0 0.78 –0.640 0.344 0.891 0.394 0.126 0.695 1.963 0.582 7.3
Spruce 0.54 0.106 0.592 188.1 2.63 –0.075 0.982 0.542 0.037 0.453 0.749 1.450 0.002 7.7
LFf Aspen 0.21 0.135 0.508 170.1 1.80 –0.951 0.111 0.924 0.014 0.002 0.914 3.206 0.090 5.5
Birch 0.44 0.068 0.235 40.5 1.09 –0.379 0.458 0.497 0.033 0.098 0.600 2.421 0.011 7.8
Poplar 0.27 0.139 0.462 50.7 3.89 –0.087 0.921 0.741 0.466 0.705 0.548 0.806 0.435 7.3
Pine 0.26 0.086 0.437 86.7 1.48 –0.964 0.582 0.952 0.620 0.668 0.916 3.259 0.281 7.9
Spruce 0.41 0.110 0.445 44.2 1.38 –0.411 0.700 0.049 0.237 0.567 0.621 2.435 0.158 7.5
Competition indices in boreal mixed forest 485
Table VI. Effect of distinguishing among competitor species and competitor groups when calculating competing basal area. Table values are F
statistics (df
numerator
,df
denominator
, and P value) for the change in residual sums-of-squares (Eq. (9)).
Subject species Ecosite Comparison
Combine competitor species Distinguish Distinguish shade
vs. distinguish all hardwood/softwood tolerant/intolerant competitor
competitor species competitor groups vs. groups vs. distinguish all
distinguish all competitor species competitor species
Aspen BMd 10.42 (4, 1153, P < 0.0001) 2.29 (3, 1153, P = 0.0773) 2.05 (3, 1153, P = 0.1058)
BMe 1.09 (3, 93, P = 0.3568) 0.48 (2, 93, P = 0.6217) 0.39 (2, 93, P = 0.6775)
LFe 13.24 (4, 639, P < 0.0001) 9.90 (3, 639, P < 0.0001) 8.83 (3, 639, P < 0.0001)
LFf 11.68 (4, 276, P < 0.0001) 14.84 (3, 276, P < 0.0001) 6.64 (3, 276, P = 0.0002)
Birch BMd 5.33 (4, 123, P = 0.0005) 4.48 (3, 123, P = 0.0051) 4.73 (3, 123, P = 0.0037)
LFe 3.30 (4, 64, P = 0.0160) 0.35 (3, 64, P = 0.7858) 2.53 (3, 64, P = 0.0648)
LFf 1.62 (4, 76, P = 0.1773) 2.15 (3, 76, P = 0.1011) 1.12 (3, 76, P = 0.3465)
Poplar BMd 3.53 (4, 209, P = 0.0082) 3.88 (3, 209, P = 0.0099) 3.80 (3, 209, P = 0.0110)
BMe 0.67 (3, 90, P = 0.5749) 0.60 (2, 90, P = 0.5496) 0.60 (2, 90, P = 0.5510)
LFe 1.98 (4, 228, P = 0.0982) 1.21 (3, 228, P = 0.3061) 2.61 (3, 228, P = 0.0524)
LFf 4.21 (4, 228, P = 0.0026) 5.60 (3, 228, P = 0.0010) 2.98 (3, 228, P = 0.0322)
Pine LFe 31.36 (4, 572, P < 0.0001) 37.66 (3, 572, P < 0.0001) 11.70 (3, 572, P < 0.0001)
LFf 21.24 (4, 2058, P < 0.0001) 15.67 (3, 2058, P < 0.0001) 7.40 (3, 2058, P < 0.0001)
Spruce BMd 28.98 (4, 662, P < 0.0001) 5.07 (3, 662, P = 0.0018) 8.06 (3, 662, P < 0.0001)
BMe 3.53 (3, 123, P = 0.0169) 1.87 (2, 123, P = 0.1587) 1.78 (2, 123, P = 0.1724)
LFe 13.22 (4, 465, P < 0.0001) 16.08 (3, 465, P < 0.0001) 12.22 (3, 465, P < 0.0001)
LFf 5.82 (4, 498, P = 0.0001) 2.78 (3, 498, P = 0.0406) 7.30 (3, 498, P < 0.0001)
distance-dependent index (ALEM8) behaved poorly. The two
light resource indices (PARO, PART) were intermediate to
poor compared to the conventional indices. The transmissive
crown light index (PART) performed better than the opaque
crown light index for aspen and poplar but these indices per-
formed similarly for birch, pine and spruce.
The difference between the best single distance-dependent
and distance-independent indices was variable depending on
the subject species. Birch showed the largest improvement
in distance-dependent over distance-independent indices (im-
provement in R
2
= 0.13), with poplar second (0.08), and then
white spruce (0.07), and pine (0.04), while for aspen the differ-
ence was small (0.01) (Fig. 1). Full statistics, coefficients and
residual plats for one of the better distance-independent (basal
area of competitors) and the best distance-dependent (CRWD)
index are provided in Tables IV and V and Figures 3 and 4.
The combination of basal area and transmissive-crown PAR
indices (CBA+PART, Eq. (7) and the combination of crowing
and opaque-crown PAR indices (CRWD+PARO, Eq. (8)) was
generally a small improvement over the crowding index alone
(CRWD) (Fig. 1).
Separate models for each ecosite explained significantly
more residual variation than a common model which ignored
ecosites (P < 0.0001 for all five subject species; Tab. VI). This
was also shown by some variation in the effect of competitor
species’ basal area on subject species’ growth from ecosite to
ecosite (Fig. 2). Separate growth equations for each ecosite
were therefore used for testing the effects of distinguishing
among competitor species.
Differences among species in reducing the growth of sub-
ject trees were also demonstrated by reductions in the residual
sum-of-squares compared to models which did not distinguish
species in determining competitor basal area. This was true
for all but four of 17 subject species and ecosite combinations
(Tab. VI). Models with all competitor species distinguished
were better than a model with only hardwood-softwood com-
petitor groups or a model with shade tolerant-intolerant groups
in ten out 17 subject species-ecosite combinations (Tab. VI).
The competitive ability of a species is indicated by how
much it reduces the growth of other (subject) trees. In the
absence of significant collinearity with the indices for other
species, this is indicated by the size of the regression coeffi-
cient for the species’ competition index. Figure 2 compares
the coefficients of the basal area index. Birch had an intermit-
tent but strong negative effect on tree growth, whereas white
spruce, followed by aspen, were consistently moderate com-
petitors. Lodgepole pine was a light to moderate competitor
in some ecosites. Balsam poplar was occasionally a moderate
competitor; however, in the LFf ecosite, it was also associated
with a positive effect on aspen growth.
486 K.J.Stadtetal.
4. DISCUSSION
The crowding index, the most flexible distance-dependent
index tested in these highly structured mixed-species forests,
offered some improvement over distance-independent indices
for predicting the diameter growth of boreal trees. It performed
similar to the competitor basal area index for predicting as-
pen growth, but had consistently higher R
2
and lower residual
standard errors for the other species. The flexible shape of the
competitor diameter and distance response in the crowding in-
dex facilitated this better performance, but required optimiza-
tion techniques to estimate the coefficients. The next-best in-
dices were the distance-dependent size-ratio index developed
by Martin and Ek (MAEK8, [36]) and the sum of the sine of
elevation angles to competitors (SEAS45). The simpler struc-
ture of these indices permitted coefficient estimation by least-
squares regression. The fits of these indices were marginally
better than distance-independent indices, e.g. the sum of com-
petitor basal areas (CBA), or the overtopping crown cover in-
dex (CRCOV).
Other comparisons of distance-independent vs. depen-
dent models have shown mixed results, with some stud-
ies finding better performance of distance-dependent over
distance-independent models [2, 6, 19] while others found
marginal to no improvement [16, 20, 33, 36, 49, 51]. Biging
and Dobbertin [7] found that distance-independent indices us-
ing various measures of the amount of overtopping crowns
were equivalent or superior to distance-dependent indices.
Likewise, we found that their overtopping crown cover index
(CRCOV, Fig. 1) was similar in fit to most other distance-
dependent indices, except the crowding index. More recent
work has focused on distance-dependent indices that have
yielded respectable performance for single-species growth in
plantations [27, 44], or mixed-species natural forests [12, 50],
but these studies did not test distance-independent indices. Our
results indicate that there may be some improvement from us-
ing distance information in a highly flexible index, but that the
improvement in fit over distance-independent indices needs to
be evaluated carefully relative to the cost of obtaining tree-
level coordinates.
The light resource indices (PART, PARO) ranked interme-
diate to low in their ability to predict diameter growth. This
may indicate that resources other than light are also limiting.
The effectiveness of the competitor basal area index, and, for
spruce, its better fit compared to competitor basal area in taller
trees suggests that some type of below-ground resource such
as nutrients or water may be more important for at least some
species in these mature stands. Certainly, the simultaneous fit
of a light resource index (to represent above-ground compe-
tition) with another index (basal area, crowding) to represent
below-ground competition improved the predictive ability of
the growth model. Larocque [27] tested a similar approach
for plantation red pine, where the volume overlap of crowns
of adjacent trees was used to estimate above-ground compe-
tition, and basal area to estimate root competition. Larocque
measured crown dimensions directly, which may account for
the respectable fit of his growth models (R
2
0.70). Direct
crown measurements have not been made in our mixedwood
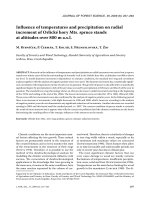
Figure 2. Comparison of the competitive effect of each subject tree
species on annual diameter growth (cm/y) by ecosites. This effect is
estimated by coefficients (β
species
, Eq. (4)) for the competition index
using the basal area (CBA,m
2
/ha) of each competing species for each
ecosite. Note that the direction of the y-axis is reversed. An asterix
(
) indicates that the subject species has low numbers in this ecosite.
Where bars have a zero value, this species’ basal area effect was not
significant (P > 0.05) in this ecosite.
forests as a routine part of the forest inventory. Our reliance
on simple allometric relationships between stem diameter and
crown dimensions with limited precision [47] may be part of
the reason for the poorer fit of our resource-based indices. This
additional information required by light resource and other
crown-dimension based indices [6, 7, 27] is also costly to ob-
tain in a forest inventory. The similarity amongst the fit of
Competition indices in boreal mixed forest 487
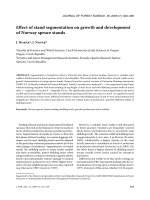
Figure 3. Residual plots for annual dbh growth (observed – predicted vs. predicted) for the competitor basal area model (Eqs. (1) and (4)) by
ecosite and subject tree species. Missing plots (*) are due to insufficient numbers of some species in some ecosites.
these competition indices may be partially due to the need to
derive many of the quantities needed to calculate the indices
(e.g. crown dimensions) from the simpler data collected in the
PSP sampling (e.g. dbh).
Modeling the growth of mixed species forests presents an
additional challenge compared to monocultures, since species
differ in their effect on resource levels as well as their response
to them. Previous work has focused on modeling light (PAR)
availability using species’ crown size and leaf area submod-
els, then linking PAR received to tree growth [3, 10, 11, 47].
Our attempt to do this yielded only intermediate results, as
noted above. We found better results when PAR indices were
combined with other competition indices such as competitor
basal area or crowding, intended in this instance to reflect
below-ground interactions. However, as our current PSP data
are limited to treelists of species, dbh, and stem coordinates,
the PAR indices as applied here were really non-linear trans-
formations of tree dbh. For this reason again, simpler species-
structured and dbh-based models such as competitor basal area
or crowding as indices of competition were nearly as effective
as combined PAR-conventional index models.
Species effects in these simpler models must be dealt with
by computing separate indices for each species and estimat-
ing their effect by multiple regression or optimization. The
488 K.J.Stadtetal.
Figure 4. Residual plots for annual dbh growth (observed – predicted vs. predicted) for the crowding model (Eq. (5)) by ecosite and subject
tree species. Missing plots (*) are due to insufficient numbers of some species in some ecosites.
five tree species were clearly different in the effects of their
basal area on subject trees, as shown by the tests for grouping
the species, and in the different sizes of the regression coef-
ficients corresponding to each competitor species’ basal area
(below). Combining the species into hardwood-softwood or
shade tolerant-intolerant groups resulted in better models than
ignoring the species differences, but not as good as models that
differentiated the effects of all species.
Ecosite differences were clearly noted, both in the overall
test for stratifying the regression models by ecosite (Tab. VI)
and in the changes in the competitor species’ coefficients
across ecosites (Tab. IV). As the species have different niche
characteristics, it is rational that competitive relations will
change in different climatic and site conditions.
With the exception of lodgepole pine, the rank of the
species’ competitive effects shown by the size of each com-
petitor species’ basal area coefficient (birch ≈ spruce > as-
pen > pine > poplar; Fig. 2) corresponds with these species’
crown-level light transmittance [46]. This is not necessarily
evidence for the predominance of light competition since the
demand for water, nutrients, and light are all positive functions
of tree leaf area, but it does show that this empirical ranking is
Competition indices in boreal mixed forest 489
mechanistically defensible. Lodgepole pine may be less strong
a competitor than its crown light intercepting ability suggests
due to the greater amount of intercepting branch and twig area
carried by conifers compared to broadleaf trees of similar leaf
area [45]. With less green leaf area for the same amount of
light interception, their water and nutrient demand will be less
than their crown transmittance might suggest.
Interestingly, poorer fits for all competition indices were
obtained for the shade intolerant species (aspen, poplar, lodge-
pole pine) than the shade tolerant (birch, white spruce)
(Fig. 1). This may relate to the fact that surviving intolerant
species tended to occupy dominant positions in the canopy
and experienced a smaller range of competitive intensity. As
a large portion of the tolerant spruce and birch subject trees
were sub-canopy trees, the range of competition these trees
experienced was greater.
A considerable number of species demonstrated amensal-
ism or neutralism rather than competition, and balsam poplar
basal area was associated with increased aspen growth in the
LFf ecosites (Tab. IV and Fig. 2). Facilitation interactions have
been demonstrated by Simard et al. [42] through mycorhizal
connections between white birch and Douglas-fir, and may ex-
ist for these species as well [28]. However, since this work is
based on survey data rather than a controlled experiment, the
results reflect complex ecosystem interactions as well as sam-
pling limitations, such as lower numbers of birch and poplar
in some ecosites. Since poplar is associated with wetter sites,
it is possible that the increase in aspen growth in the pres-
ence of poplar reflects a response to site moisture rather than
true facilitation. However, other work has shown that com-
mensalism, neutralism and amensalism are common in boreal
mixed forests. Aspen provides frost protection for understory
trees [35] and suppresses grasses, herbs or shrubs that create
more serious growth problems for conifers [31]. The leaf litter
of the deciduous species may stimulate nutrient cycling, which
may benefit conifer growth [25]. MacPherson et al. [34] found
some reduction in aspen productivity in mixed stands of aspen
and spruce, but aspen losses were exceeded by the productiv-
ity of the spruce, giving mixed stands higher total production
than monocultures. The rather poor fits of even the best ini-
tial size – competition model tested here (0.16 R
2
0.55)
relative to the model without an explicit competition term
(0.11 R
2
0.26) (Fig. 1) suggests that inter-tree compe-
tition may not be a major process affectinggrowthofmature
western boreal mixed forests.
5. CONCLUSIONS
In this examination of competition indices for predicting
diameter growth in mixed-species forests, we found that the
flexible, distance-dependent crowding index was superior to
other indices, but that a simple index, such as competitor basal
area was also quite effective. Basal area provided similar fits
to many other distance-dependent and independent indices us-
ing size ratios or more derived values such as overtopping
crown cover. Stratification by competitor species and ecosite
improved model performance significantly. More process-
oriented indices of light ranked intermediate to poor, possibly
due to the lack of precise crown dimension data or compe-
tition for other resources. We anticipate a role for distance-
dependent and light resource indices in modeling the re-
sponse of mixed-species boreal stands to more extreme spatial
heterogeneity created by strip shelterwood harvests [30]; how-
ever, for natural-origin unmanaged forests, the costs of col-
lecting the spatial and crown-level information required for
distance-dependent and light indices may outweigh their ben-
efit.
Acknowledgements: We thank the Network of Centres of Excel-
lence in Sustainable Forest Management for funding this project, and
the Alberta Ministry of Sustainable Resource Development, Land and
Forest Division for providing access to their Permanent Sample Plot
data. Dr. Christian Messier and Dr. Stephen Titus provided helpful
input on this project.
REFERENCES
[1] Alberta Land and Forest Services, Land and Forest Services
Permanent Sample Plot Field Procedures Manual, For. Manage.
Div., Edmonton, Alberta, 2002.
[2] Alemdag I.S., Evaluation of some competition indices for the pre-
diction of diameter increment in planted white spruce, Can. For.
Serv. Inf. Rep. FMR-X-108, 1978.
[3] Bartelink H.H., Effects of stand composition and thinning in mixed-
species forests: a modeling approach applied to Douglas-fir and
beech, Tree Physiol. 20 (2000) 399–406.
[4] Beckingham J.D., Archibald J.H., Field guide to ecosites of north-
ern Alberta, University of British Columbia Press, Vancouver, BC,
1996.
[5] Beckingham J.D., Corns I.G.W., Archibald J.H., Field guide to
ecosites of west-central Alberta. University of British Columbia
Press, Vancouver, BC, 1996.
[6] Biging G.S., Dobbertin M., A comparison of distance-dependent
competition measures for height and basal area growth of individual
conifer trees, For. Sci. 38 (1992) 695–720.
[7] Biging, G.S., Dobbertin M., Evaluation of competition indices in
individual tree growth models, For. Sci. 41 (1995) 360–377.
[8] Brunner A., A light model for spatially explicit forest stand models,
For. Ecol. Manage. 107 (1998) 19–46.
[9] Burton P.J., Some limitations inherent to static indices of plant com-
petition, Can. J. For. Res. 23 (1993) 2141–2151.
[10] Canham C.D., Finzi A.C., Pacala S.W., Burbank D.H., Causes
and consequences of resource heterogeneity in forests: interspecific
variation in light transmission by canopy trees, Can. J. For. Res. 24
(1994) 337–349.
[11] Canham C.D., Coates K.D., Bartemucci P., Quaglia S.,
Measurement and modeling of spatially explicit variation in
light transmission through interior cedar-hemlock forests of British
Columbia, Can. J. For. Res. 29 (1999) 1775–1783.
[12] Canham C.D., LePage P.T., Coates K.D., A neighborhood analy-
sis of canopy tree competition: effects of shading versus crowding,
Can. J. For. Res. 34 (2004) 778–787.
[13] Coates K.D., Canham C.D., Beaudet M., Sachs D.L., Messier C.,
Use of a spatially explicit individual-tree model (SORTIE/BC)
to explore the implications of patchiness in structurally complex
forests, For. Ecol. Manage. 186 (2003) 297–310.
[14] Comeau P.G., Braumandl T.F., Xie C.Y., Effects of overtopping veg-
etation on light availability and growth of Engelmann spruce (Picea
engelmannii) seedlings, Can. J. For. Res. 23 (1993) 2044–2048.
490 K.J.Stadtetal.
[15] Connell J.H., Apparent versus “real” competition in plants, in:
Grace J.B., Tilman D. (Eds.), Perspectives on Plant Competition,
Academic Press, San Diego, CA, 1990, pp. 9–26.
[16] Corona P., Ferrara A., Individual competition indices for conifer
plantations, Agric. Ecosyst. Environ. 27 (1989) 429–437.
[17] Cumming S.G., Schmiegelow F.K.A., Burton P.J., Gap dynamics in
boreal aspen stands: is the forest older than we think? Ecol. Appl.
10 (2000) 744–759.
[18] Dang Q.L., Lieffers V.J., Assessment of patterns of response of tree
ring growth of black spruce following peatland drainage, Can. J.
For. Res. 19 (1989) 924–929.
[19] Daniels R.F., Simple competition indices and their correlation with
annual loblolly pine tree growth, For. Sci. 22 (1976) 454–460.
[20] Daniels R.F., Burkhart H.E., Clason T.R., A comparison of compe-
tition measures for predicting growth of loblolly pine trees, Can. J.
For. Res. 16 (1986) 1230–1237.
[21] Hegyi F., A simulation model for managing jack pine stands, in:
Fries J. (Ed.), Growth models for tree and stand simulation, Royal
Coll. For., Stockholm, 1974, pp. 74–90.
[22] Holmes M.J., Reed D.D., Competition indices for mixed species
northern hardwoods, For. Sci. 37 (1991) 1338–1349.
[23] Huang S., Titus S.J., Lakusta T.W., Held, R.J., Ecologically-based
individual tree height-diameter models for major Alberta tree
species, Alberta Environ. Prot., Land For. Serv., For. Manage. Div.,
1994.
[24] Jones J.R., Review and comparison of site evaluation methods,
USDA For. Serv. Res. Pap. RM-51, 1969.
[25] Kelty M., Cameron I.R., Plot designs for the analysis of species
interactions in mixed stands, Commonw. For. Rev. 74 (1995) 322–
332.
[26] Kucharik C.J., Norman J.M., Gower S.T., Characterization of radi-
ation regimes in nonrandom forest canopies: theory, measurements,
and a simplified modeling approach, Tree Physiol. 19 (1999) 695–
706.
[27] Larocque G.R., Examining different concepts for the development
of a distance-dependent competition model for red pine diameter
growth using long-term stand data differing in initial stand density,
For. Sci. 48 (2002) 24–34.
[28] Lazaruk L.W., Kernaghan G., Macdonald S.E., Khasa D., Effects
of partial cutting on the ectomycorrhizae of Picea glauca forests in
northwestern Alberta, Can. J. For. Res. 35 (2005) 1442–1454.
[29] Lieffers V.J., Beck. J.A., A seminatural approach to mixedwood
management in the prairie provinces, For. Chron. 70 (1994) 260–
264.
[30] Lieffers V.J., Macmillan R.B., MacPherson D., Branter K., Stewart
J.D., Semi-natural and intensive silvicultural systems for the boreal
mixedwood forest, For. Chron. 72 (1996) 286–292.
[31] Lieffers V.J., Stadt K.J., Growth of understory Picea glauca,
Calamagrostis canadensis,andEpilobium angustifolium in relation
to overstory light transmission, Can. J. For. Res. 24 (1994) 1193–
1198.
[32] Lin J.Y., Stand growth simulation models for Douglas-fir and west-
ern hemlock in the northwestern United States, in: Fries J. (Ed.),
Growth Models for Tree and Stand Simulation, Royal Coll. For.,
Stockholm, 1974, pp. 102–118.
[33] Lorimer C.G., Tests of age-independent competition indices for in-
dividual trees in natural hardwood stands, For. Ecol. Manage. 6
(1983) 343–360.
[34] MacPherson D.M., Lieffers V.J., Blenis P.V., Productivity of aspen
stands with and without a spruce understory in Alberta’s boreal
mixedwood forests, For. Chron. 77 (2001) 351–356.
[35] Man R.Z., Lieffers V.J., Effects of shelterwood and site preparation
on microclimate and establishment of white spruce seedlings in a
boreal mixedwood forest, For Chron. 75 (1999) 837–844.
[36] Martin G.L., Ek A.R., A comparison of competition measures and
growth models for predicting plantation red pine diameter and
height growth, For. Sci. 30 (1984) 731–743.
[37] Navratil S., MacIsaac D.A., Juvenile growth of white spruce and
deciduous competition on mixedwood sites in Alberta, Can. For.
Serv., PAF Rep. 141, 1996.
[38] Peters V.S., MacDonald S.E., Dale M.R.T., The interaction between
masting and fire is key to white spruce regeneration, Ecology 86
(2005) 1744–1750.
[39] Rawlings J.O., Pantula S.G., Dickey D.A., Applied regression anal-
ysis: a research tool, 2nd ed., Springer-Verlag, New York, 1998.
[40] Robinson A. P., Ek A.R., The consequences of hierarchy for mod-
eling in forest ecosystems, Can. J. For. Res. 30 (2000) 1837–1846.
[41] Rowe J.S., Forest Regions of Canada, Can. Forestry Serv. Pub. No.
1300, Information Canada, Ottawa, 1972.
[42] Simard S.W., Perry D.A., Jones M.D., Myrold D.D., Durall D.M.,
and Molina R., Net transfer of carbon between trees species with
shared ectomycorrhizal fungi, Nature 388 (1997) 579–582.
[43] Smolander S., Stenberg P., A method for estimating light intercep-
tion by a conifer shoot, Tree Physiol. 21 (2001) 797–803.
[44] Soares P., Tomé M., Distance-dependent competition measures for
eucalyptus plantations in Portugal, Ann. For. Sci. 56 (1999) 307–
319.
[45] Stadt, K.J., Modeling light for regeneration planning in mixed-
species boreal forests, Ph.D. thesis, University of Alberta,
Edmonton, Alberta, 2002.
[46] Stadt K.J., Lieffers V.J., MIXLIGHT: A flexible light transmission
model for mixed-species forest stands, Agric. For. Meteorol. 102
(2000) 235–252.
[47] Stadt K.J., Lieffers V.J., Hall R.J., Messier C., Spatially explicit
modeling of PAR transmission and growth of Picea glauca and
Abies balsamea in the boreal forests of Alberta and Quebec, Can. J.
For. Res. 35 (2005) 1–12.
[48] Ter-Mikaelian M.T., Wagner R.G., Bell F.W., Shropshire C.,
Comparison of photosynthetically active radiation and cover esti-
mation for measuring the effects of interspecific competition on jack
pine seedlings, Can. J. For. Res. 29 (1999) 883–889.
[49] Tomé M., Burkhart H.E., Distance-dependent competition measures
for predicting growth of individual trees, For. Sci. 35 (1989) 816–
831.
[50] Vettenranta J., Distance-dependent models for predicting the de-
velopment of mixed coniferous forests in Finland, Silva Fenn. 33
(1999): 51–72.
[51] Wimberly M., Bare B.B., Distance-dependent and distance-
independent models of Douglas-fir and western hemlock basal area
growth following silvicultural treatment, For. Ecol. Manage. 89
(1996) 1–11.