Báo cáo lâm nghiệp: "Predicting stand damage and tree survival in burned forests in Catalonia (North-East Spain)" pot
Bạn đang xem bản rút gọn của tài liệu. Xem và tải ngay bản đầy đủ của tài liệu tại đây (614.61 KB, 10 trang )
Ann. For. Sci. 64 (2007) 733–742 Available online at:
c
INRA, EDP Sciences, 2007 www.afs-journal.org
DOI: 10.1051/forest:2007053
Original article
Predicting stand damage and tree survival in burned forests in
Catalonia (North-East Spain)
José Ramón G
´
a
*
, Antoni T
b
,MarcP
´
a
,TimoP
b
a
Centre Tecnològic Forestal de Catalunya. Pujada del seminari s/n, 25280 Solsona, Spain
b
ForEcoTechnologies, Av. Diagonal 416, Estudio 2, Barcelona 08037, Spain
(Received 4 October 2006; accepted 13 March 2007)
Abstract – The study developed models for predicting the post-fire tree survival in Catalonia. The models are appropriate for forest planning purposes.
Two types of models were developed: a stand-level model to predict the degree of damage caused by a forest fire, and tree-level models to predict the
probability of a tree to survive a forest fire. The models were based on forest inventory and fire data. The inventory data on forest stands were obtained
from the second (1989–1990) and third (2000–2001) Spanish national forest inventories, and the fire data consisted of the perimeters of forest fires
larger than 20 ha that occurred in Catalonia between the 2nd and 3rd measurement of the inventory plots. The models were based on easily measurable
forest characteristics, and they permit the forest manager to predict the effect of stand structure and species composition on the expected damage.
According to the stand level fire damage model, the relative damage decreases when the stand basal area or mean tree diameter increases. Conversely,
the relative stand damage increases when there is a large variation in tree size, when the stand is located on a steep slope, and when it is dominated by
pine. According to the tree level survival models, trees in stands with a high basal area, a large mean tree size and a small variability in tree diameters
have a high survival probability. Large trees in dominant positions have the highest probability of surviving a fire. Another result of the study is the
exceptionally good post-fire survival ability of Pinus pinea and Quercus suber.
damage model / fire management / logistic function / tree mortality / survival model
Résumé – Prédiction des dommages au peuplement et de la survie des arbres dans les forêts brûlées en Catalogne. L’étude développe des
modèles pour prédire la survie des arbres après feu en Catalogne. Les modèles sont appropriés à des objectifs de planification en forêt. Deux types
de modèles ont été développés : un modèle au niveau des peuplements pour prédire le niveau des dommages causés par les feux de forêts, et des
modèles arbre-centrés pour prédire la probabilité de survie à un feu de forêt. Les modèles sont basés sur les données de l’inventaire des forêts et des
feux. Les données de l’inventaire des peuplements forestiers ont été obtenues à partir du deuxième (1989–1990) et du troisième (2000–2001) inventaire
forestier espagnol, et les données sur les feux proviennent de périmètres de feux de forêts supérieurs à 20 ha qui se sont produits en Catalogne entre les
deuxièmes et troisièmes mesures dans les placettes d’inventaire. Les modèles sont basés sur des caractéristiques facilement mesurables, et permettent
au praticien forestier de prédire l’effet de la structure du peuplement et de la composition en espèces sur les dégâts. D’après le modèle de dommage au
niveau peuplement, les dégâts diminuent lorsque la surface terrière ou le diamètre moyen des arbres augmente. Inversement, les dégâts augmentent en
cas de forte variabilité de dimension des arbres, quand le peuplement est localisé sur une pente forte ou quand il est principalement composé de pins.
Selon les modèles de survie arbre-centrés, les arbres de peuplements à forte surface terrière, forte dimension moyenne des arbres et faible variabilité
des diamètres, présente la plus forte probabilité de survie au feu. Les grands arbres dominants présentent la plus forte probabilité de survivre au feu. Un
autre résultat de cette étude est l’exceptionnelle capacité de survie après feu de Pinus pinea et Quercus suber.
modèle de dommage / gestion du feu / fonction logistique / mortalité des arbres / modèle de survie
1. INTRODUCTION
Mediterranean forests are affected by recurrent fire events,
which cause significant economic damage [40]. Fire is the
most common cause of tree mortality in the Mediterranean
basin [3]. Therefore, the inclusion of fire risk analysis in the
forest planning process is clearly justified. Such analyses help
to reduce the uncertainty by anticipating the outcomes of man-
agement alternatives in a systematic way [12], and identifying
management options that reduce the expected losses due to
fire.
The analysis of fire risk in forest management planning re-
quires a model for assessing the potential damage caused by
* Corresponding author:
fires. Models that predict the losses as a result of fire must
be based on predictors whose future value is known with rea-
sonable accuracy. If a model is to be used for forest planning
purposes, it also has to consider variables that are under the
control of the manager; this enables the manager to minimise
the expected losses as a management objective in numerical
planning calculations.
The variables driving the behaviour of wildland fires are
normally grouped into climatic, topographic and fuel related
variables. Among these, only fuel can be controlled [41]. Vari-
ables related to the aboveground vegetation such as stand
density, species composition, vertical structure of the canopy,
tree size and hierarchical position of the trees are all known,
controllable and related to fuels. They are therefore useful
Article published by EDP Sciences and available at or />734 J.R. González et al.
predictors in damage models that are used in forest planning
systems.
Previous studies have revealed relationships between struc-
tural variables of stands and the likelihood of fire damage (e.g.
[2, 9, 30,31, 39]). For example, Pollet and Omi [31] and Agee
and Skinner [2] concluded that open stands of large trees with
a small amount of ground fuel are less susceptible of suffering
severe fire damage. The relationships between tree size and
post-fire tree mortality has also been widely studied (e.g. [5,
18, 22, 24, 26, 32, 34]), and the general consensus is that larger
trees are less likely to die in a fire.
According to Fowler and Sieg [11], most of the studies deal-
ing with fire damage can be divided in two categories, the ones
using tree tissue damage to predict tree mortality after fire, and
others using fire behaviour parameters such as fire intensity
as predicting variables. Unfortunately, tree tissue damage and
fire intensity are seldom known in planning. The use of fire be-
haviour simulators to predict the damage presents serious lim-
itations over large spatial and temporal domains [10, 33]. This
is because they require information on weather conditions and
fuel accumulation which are difficult to predict over long pe-
riods of time and across large heterogeneous landscapes [17].
This implies that many of the existing post-fire mortality mod-
els have little use in forest planning, the purpose of which is
to predict the long-term consequences of management alter-
natives. Another important limitation of the available models
is the relatively small number of forest types that they cover;
most of the models can be applied only to even-aged conif-
erous stands although in reality stands may be even-aged or
uneven-aged, and the species composition may vary.
The aim of the present study is to develop stand-level dam-
age models and post-fire tree survival models appropriate for
forest planning purposes and scenario analyses in Catalonia.
The models should use variables that are easily measurable in
forest inventories or otherwise available in planning. The mod-
els should be able to predict the potential damage caused by
fire in any forest stand in Catalonia, depending on the site and
the structure of the stand. In addition to predicting the degree
of damage at the stand level, the models should also identify
the survivors when the damage is not total. This is required in
simulators that use individual trees as the smallest calculation
unit.
To meet these aims, two types of models were developed:
a stand-level model for the degree of damage caused by a for-
est fire, and tree-level models for the probability of a tree to
survive a forest fire
2. MATERIALS AND METHODS
2.1. Inventory plots
The modelling data included inventory data and fire occurrence
data. The data on forest stands were obtained from the second and
third Spanish National Forest Inventory (IFN) in Catalonia [8, 20].
The IFN data consisted of a systematic sample of permanent plots,
distributed on a square grid of 1 km, with a re-measurement interval
of approximately 11 years. The following data were recorded for each
Table I. Number of observations (N), observed survival probability
(Survival), and mean proportion of dead trees (Damage) in the stands
for the eight most common tree species and the whole study material
(Total). “Baseline” is the mean survival probability in non-burned in-
ventory plots.
Tree level data Stand level data
N Survival Baseline N Damage Standard Range
deviation
Pinus sylvestris 574 0.74 0.959 23 0.32 0.34 0–1
Pinus pinea 280 0.92 0.979 16 0.18 0.35 0–1
Pinus halepensis 2201 0.50 0.966 286 0.45 0.46 0–1
Pinus nigra 4741 0.67 0.979 276 0.42 0.41 0–1
Pinus pinaster 106 0.55 0.988 5 0.40 0.55 0–1
Quercus faginea 240 0.48 0.978 7 0.11 0.29 0–0.77
Quercus ilex 552 0.62 0.979 41 0.19 0.38 0–1
Quercus suber 628 0.94 0.974 35 0.11 0.21 0–1
Other sp. 276 0.67 0.970 33 0.07 0.25 0–1
Total 9598 0.65 0.964 722 0.38 0.43 0–1
sample tree: species, dbh, height, survival, and distance and azimuth
from the plot centre. This resulted in 6229 survivors and 3369 dead
trees, out of a total of 9598 trees inventoried in burned plots (Tab. I).
Information about the abundance, mean height, and species composi-
tion of small trees (dbh < 7.5 cm) and bushes was also collected.
The 2nd and 3rd IFN in Catalonia took place during the periods
1989 to 1990 (2nd) and 2000 to 2001 (3rd), and covered a surface
area of 32 114 km
2
. The IFN inventory plots represented 52 different
forest types in Catalonia. The elevation of the plots ranged from sea
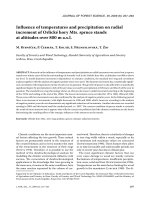
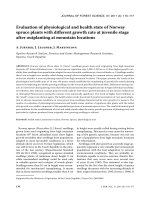
level up to over 2300 m. Of the 10 855 inventory plots that were
measured over the whole of Catalonia (Fig. 1), all plots which were
located within the perimeters of forest fires that took place between
the two inventories were used in this study (722 plots).
2.2. Fire data
The fire data consisted of the perimeters of forest fires larger than
20 ha (Fig. 1) that occurred in Catalonia after the 2nd IFN measure-
ment and prior to the 3rd IFN measurement (i.e., the fires between
1989 and 2001). In the case of fires that occurred in the same year
as one of the IFN measurements, the exact dates of the fire event
and of the IFN measurement were used to find out whether the fire
had occurred between the two measurements. The fire data included
4944 burned areas, corresponding to 150 fires, with a total area of
146 023 ha.
The fire perimeters were determined on the 1:50 000 scale map
by the Department de Medi Ambient i Habitatge and the Institut Car-
tográfic de Catalunya as follows. The information of the fire reports
(date of the fire, initiation coordinates, estimated burned area, etc.)
was compared to images of burned areas (LANDSAT, SPOT, CASI
or ortophotos). For each fire, a file was created with geo-referenced
data from the affected area, both before and after the fire. The data
were processed to estimate the effect of fire on the vegetation cover,
using the Normalized Difference Vegetation Index (NDVI) [37] and
principal components analysis. Digital classification was used for de-
lineating the fire perimeter. A posterior control phase allowed a more
accurate differentiation of the burned and unburned areas.
Tree survival in forest fires 735
a
b
c
Figure 1. Location of Catalonia (a),
forest fires occurred in the study
area during 1989–2001 (b), and a
part of the national forest inventory
(IFN) plots used in the study (trian-
gles in map c).
2.3. Data preparation
After collecting the IFN and fire perimeter data, the next step was
to separate the plots of the IFN for Catalonia which were burned be-
tween the two IFN measurements. The data showed that 722 out of
10 855 IFN plots had been burned. To obtain this information, spa-
tial layers from both sets of data (IFN plots and fire perimeters) were
overlaid using GIS tools [4]. From this map, the IFN plots within fire
perimeters were classified as plots that were burned (Fig. 1). A com-
parison of the number of fires (4944) and number of burned inventory
plots (722) reveals that there were many burned areas in which there
was no inventory plot. The variable that was used to describe the dam-
age at the stand level was the proportion of trees that died as a result
of fire (Tab. I).
2.4. Stand-level damage modelling
A stand-level fire damage model was developed by testing a num-
ber of stand-level variables related to the structure, composition and
location of the stands as predictors. All predictors had to be signifi-
cant at the 0.05 level without any systematic errors in the residuals.
The predicted variable (y) was the logit transformation of the propor-
tion of dead trees:
y = ln
p
1 − p
(1)
where p =
0.01 if P
dead
0.01
P
dead
if 0.01 < P
dead
< 0.99
0.99 if P
dead
0.99
,
P
dead
is the observed proportion of dead trees. The logit transfor-
mation forces the prediction to be within zero and one. The model
was estimated using the ordinary least squares (OLS) method in the
SPSS statistical program [36]. The model described the linear re-
lationship between the logit transformation of the degree of dam-
age (proportion of dead trees) and the selected stand-level predictors
(Tab. II).
2.5. Modelling post-fire tree survival
The logistic function was used to model tree survival since it is
mathematically flexible, easy to use, and has a meaningful interpreta-
tion [19]. Several models predicting the probability of a single tree to
survive or to die have been developed using logistic regression meth-
ods [5, 7, 16, 18,22, 24, 25,29, 32, 38].
Two different models were developed using the Binary Logistic
procedure in SPSS [36]. The first one used ordinary site, tree and
stand variables as predictors, whereas the second one used the degree
of damage and tree size (diameter at breast height) as the only predic-
tors. The predictors were selected taking into account three criteria.
Firstly, log-likelihood ratio tests were used to determine whether the
addition of a variable improved the model significantly. Secondly, the
importance of the variable in terms of forest inventory and manage-
ment, as well as its simplicity, was considered. Finally, the effect of
adding the variable on the odds ratio of the variables already in the
model was calculated. The odds for an event are defined as the prob-
ability that the event occurs divided by the probability that the event
736 J.R. González et al.
Table II. Descriptive statistics for the variables used as predictors in the damage and survival models (N is number of observations).
Va ri a bl e N Minimum Maximum Mean Standard deviation
Stand-level predictors
Basal-area-weighted mean diameter, D
g
(cm) 722 8 42 18.83 4.448
Quadratic mean diameter, D
q
(cm) 722 0 43 14.22 7.255
Stand basal area, G (m
2
ha
−1
) 722 0 59 17.22 8.865
Slope (%) 722 2 42 33.33 11.320
Pine-dominated stand, Pine 722 0 1 0.84 0.370
Standard deviation of diameter, s
d
(cm) 722 0 15 4.91 1.761
Tree-level predictors
Diameter, d(cm) 9598 8 68 18.35 7.050
Basal area of trees larger than the subject tree, BAL (m
2
ha
−1
) 9598 0 59 8.56 7.084
does not occur [21]. The odds ratio quantifies how many times more
(or less) the event is likely to occur at the known levels of the pre-
dictors. Due to interactions between some variables in the models,
the odds ratios were computed by exponentiating the algebraic dif-
ference between the logits at two levels of the variable considered. In
this way, the odds ratios for different units of change could be ana-
lyzed [19].
3. RESULTS
3.1. Stand damage model
The stand-level damage model had the following form:
y = b
0
+ b
1
G + b
2
Slope+ b
3
Pine +
b
4
G
D
q
+ 0.01
+ b
5
s
d
D
q
+ 0.01
+ e (2)
where y = ln(P
dead
/(1 − P
dead
)), P
dead
is the proportion of
dead trees in the stand (in terms of number of trees), G is the
stand basal area (m
2
ha
−1
), Slope is the percentage of altitude
change per distance change (%), Pine is a dummy variable
which equals 1 if the stand is dominated by pines (> 50 % of
basal area is pine) and 0 otherwise, s
d
is the standard deviation
of the breast height diameters of trees (cm), D
q
is the quadratic
mean diameter (cm) of trees, and e is the standard deviation of
the residual (standard error). The predictor G/(D
q
+ 0.01) is
non-linearly related to the number of trees per hectare. The
last predictor s
d
/(D
q
+ 0.01) expresses the relative variability
of tree diameters. The variable is close to 1 in rather uneven
stands and approaches to 0 in homogeneous stands.
All the variables included in the stand damage model were
significant at the 0.05 level (Tab. III). The coefficient of de-
termination (R
2
) was 0.173, the bias was 0, and the standard
error was 3.434 for the logit (116% of the mean of predicted
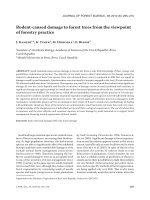
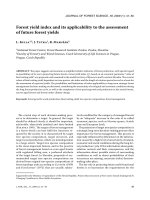
values if calculated in the original units). According to the
model, the proportion of dead trees decreases when stand basal
area increases (Fig. 2). Higher values of G/(D
q
+ 0.01) and
s
d
/(D
q
+ 0.01) increase the damage. The other two factors that
contribute to a high fire damage are steep slopes and pine dom-
inance (Fig. 2). Condition indices [36] were calculated for all
the predictors and they showed no significant multicollinear-
ity. All the condition indices were less than 20.
Table III. Regression coefficients and level of significance of the
stand level damage model variables (Eq. (2)).
Effect Variable Coefficient S.E. Significance
b
0
Intercept –6.131 0.555 0.000
b
1
G –0.329 0.051 0.000
b
2
Slope 0.060 0.012 0.000
b
3
Pine 2.266 0.354 0.000
b
4
G/(D
q
+0.01) 4.319 0.725 0.000
b
5
s
d
/(D
q
+0.01) 6.718 1.121 0.000
3.2. Tree survival models
Two different models were developed to predict the prob-
ability of a single tree surviving a wildfire event. One used
tree and stand characteristics as predictors (Eq. (3)), while the
other one was based on tree size and the stand-level degree of
firedamage(Eq.(4)).Themodelsareasfollows:
P
1
sur
=
1+e
−
b
0
+b
1
d+b
2
BAL+b
3
D
g
+b
4
G+b
5
s
d
D
g
+0.01
+b
6
PPinea+b
7
QS uber
−1
(3)
P
2
sur
=
1 + e
−(b
0
+b
1
d+b
2
P
dead
)
−1
(4)
where P
sur
is the probability of survival, d is the diameter of
the tree at the breast height (cm), BAL is the basal area of
trees larger than the subject tree (m
2
ha
−1
), D
g
is the basal-area-
weighted mean diameter (cm) of trees, G is the total basal area
of the stand (m
2
ha
−1
), s
d
is the standard deviation of breast
height diameter (cm), PPinea and QSuber are dummy vari-
ables indicating whether the tree is Pinus pinea or Quercus
suber (if the tree is P. pinea, PPinea equals 1 and if it is
Q. suber, QSuber equals 1, and 0 otherwise), and P
dead
is the
proportion of dead trees.
The variables included in the first model (Eq. (3)) represent,
on one hand, the size and position of the tree in the diame-
ter distribution (dand BAL), and the structure of the stand (D
g
,
s
d
/(D
g
+ 0.01) and G), on the other hand. Variables PPinea and
QSuber represent the special behaviour (high survival rate) of
two tree species with respect to fire (see Tab. I). For the sec-
ond survival model (Eq. (4)), in which the stand level degree
of damage (P
dead
) was used as a predictor, the only other sig-
nificant predictor was the tree dbh.
Tree survival in forest fires 737
0
0.2
0.4
0.6
0.8
1
0 1020304050
Slope, %
Proportion of dead trees
Pine
Non-pine
0
0.2
0.4
0.6
0.8
1
0 1020304050
Basal area, m
2
ha
-1
Proportion of dead trees
Pine
Non-pine
0
0.2
0.4
0.6
0.8
1
015304560
Quadratic mean diameter, cm
Proportion of dead trees
Pine
Non-pine
0
0.2
0.4
0.6
0.8
1
051015
Standard deviation of dbh, cm
Proportion of dead trees
Pine
Non-pine
a
c
d
b
Figure 2. Effect of slope (a), stand basal area (b), quadratic mean diameter (c), and standard deviation of diameter (d) on the proportion of dead
trees according to Equation (2). Variables other than the one on the × axis are equal to their mean value in the modelling data (Tab. II).
Several other variables were also tested representing site
factors (latitude, aspect and continentality), stand structure
and species composition (amount of bushes, small trees and
species groups), and variables related to fire behaviour such
as the size of the burned area within which the plot was lo-
cated. However, the best fits were obtained with Equations (3)
and (4).
The Nagelkerke R
2
[36] was 0.165 for Equation (3) and
0.788 for Equation (4). According to condition indices, there
was no significant multicollinearity the variables in the mod-
els. All variables included in the models (Tab. IV) were sig-
nificant according to the Wald test [36] (p < 0.05). According
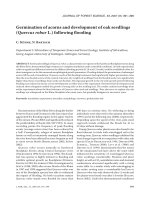
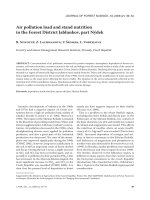
to Equation (3), larger diameters and trees in dominant posi-
tions (low BAL value) have higher probability of surviving a
fire (Fig. 3). Furthermore, trees in forest stands with higher
values of G and D
g
, but with low variability of stand diam-
eters (s
d
/(D
g
+ 0.01)) have also higher survival probabilities
(Fig. 3). The first survival model also shows that P. pinea and
Q. suber trees have better post-fire survival ability. According
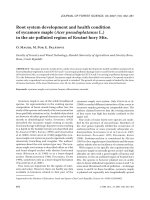
to the second survival model, large trees in stands with low
expected damage are the most likely to survive (Fig. 4).
There are three different ways to use the survival models in
simulations. One is to multiply the frequencies of trees by their
predicted survival probability. The other ways are suitable for
individual tree simulators, in which a decision must be taken
whether or not a particular tree dies. The stochastic way uses
Monte Carlo simulation, which compares the predicted sur-
vival probability to a uniform random number. If stochasticity
is not wanted, a threshold must be specified for the survival
probability beyond which the tree is taken as a survivor. To
analyse the behaviour of the models in this kind of determinis-
tic simulation, the so-called receiving operating characteristic
(ROC) curves [35] we calculated for the models by gradually
changing the threshold probability from zero to one, and with
every threshold calculating the numbers of predicted survivals
and dead trees, separately for observed survivors and observed
dead trees (Fig. 5). The relative area below an ROC curve is
a measure on accuracy, and its range is from 0.5 (chance) and
1.0 (perfect). The relative area below the ROC curve was 0.844
for Equation (4) when used with observed stand level damage
and 0.677 when Equation (4) was used with predicted dam-
age. For Equation (3) the relative area was slightly smaller,
0.673, which means that the combined use of Equations (2)
and (4) gives slightly better results than the use Equation (3).
The best threshold probability was 0.5 for both Equation (3)
and the combination of Equations (2) and (4) (Fig. 6), i.e., a
tree should be taken as a survivor when its predicted survival
probability is 0.5 or more. If the stand-level degree of damage
is known, the best threshold probability is 0.3.
The odds ratios of the predictors were computed by expo-
nentiating the algebraic difference between the logits at two
levels of the predictor (Tab. V). Changes in D
g
and s
d
had a
clear effect on the survival probability in Equation (3), but the
effect was not constant across different values. In the case of s
d
the odds ratio depended on the value ofD
g
; the same change in
s
d
had a much smaller effect on survival when D
g
was 10 cm
than when it was 30 cm. Similarly, the effect of a change
in D
g
depended on the value of s
d
. Other variables whose
change led to big changes in survival probability were PPinea
and Qsuber; the survival probabilities were around four times
higher if the tree was P. pinea or Q. suber. For the three re-
maining variables (d, BAL, G), a change of ten units altered
738 J.R. González et al.
0
0.2
0.4
0.6
0.8
1
0204060
dbh, cm
Probability of survival
0
0.2
0.4
0.6
0.8
1
020406080
BAL, m
2
/ha
Probability of survival
0
0.2
0.4
0.6
0.8
1
0204060
G, m
2
/ha
Probability of survival
0
0.2
0.4
0.6
0.8
1
0 204060
Dg, cm
Probability of survival
0
0.2
0.4
0.6
0.8
1
0 5 10 15 20
s
d
, cm
Probability of survival
Figure 3. Effect of tree diameter (dbh), basal area of larger trees (BAL), total basal area (G), basal-area-weighted mean diameter (Dg) and
standard deviation of dbh (s
d
) on the survival probability of a tree, according to Equation (3) for species other than P. pinea and Q. suber.
0
0.2
0.4
0.6
0.8
1
00.20.40.60.81
Damage, propotion of N
Probability of survival
dbh=10
dbh=25
dbh=40
0
0.2
0.4
0.6
0.8
1
0 1020304050
Diameter, cm
Probability of survival
damage=0.9
damage=0.5
damage=0.1
Figure 4. Effect of the degree of fire damage (proportion of dead trees, P
dead
) and tree diameter (dbh) on the survival probability of a tree,
according to Equation (4).
the survival probability by 1.3–1.85 times. In Equation (4),
variations in both d and P
dead
caused a major change in the
survival probability.
3.3. An example of application
To evaluate the effect of stand structure on the potential
post-fire damage, the models were applied to four hypothet-
ical forest stands. The analysed stands had the same location
(slope) and species composition (all trees were pines but not
P. pinea), but different size distributions of trees. In a mature
even-aged stand, the survival probability of all trees was high
(Fig. 7A) and the predicted damage was low (Fig. 8), which
can be explained by the absence of small trees, a high basal
area, and a small variability in tree size (no fuel ladder effect).
In the young even-aged stand, the probability of the tree’s sur-
vival was relatively small (Fig. 7B) and the predicted dam-
age high, mainly because of the small size of the trees. The
Tree survival in forest fires 739
0
0.2
0.4
0.6
0.8
1
0 0.2 0.4 0.6 0.8 1
Wrong survivals (false alarms)
Correct survivals (hits
)
Equation (3)
Equation (4), observed damage
Equation (4), predicted damage
Chance
Figure 5. Receiver operating characteristic curves for Equation (3)
and for Equation (4) when used with predicted or observed stand level
damage. A high area between the × axis and the curve implies high
accuracy.
0
10
20
30
40
50
60
70
80
90
100
0 0.2 0.4 0.6 0.8 1
Decision criterion
Correct predictions, %
Equation (3)
Equation (4), observed damage
Equation (4), predicted damage
Figure 6. Percentage of correct predictions as a function of predicted
survival probability that classifies trees as survivors (decision crite-
rion).
two-layered stand (Fig. 7C) had a reasonably high survival
probabilities for the top layer trees (>18 cm) but much smaller
for the low layer trees. The predicted degree of damage was
significantly higher than in the case of the mature even-aged
stand (Fig. 8). The uneven-aged stand had a rather low sur-
vival probability for small trees, but the survival probability
increased with tree diameter. This tendency was more pro-
nounced when the stand-level degree of damage was used to
predict tree survival (Fig. 7D).
4. DISCUSSION
The presented damage and survival models were based on
variables available with standard forest inventories or easily
Tab le IV. Regression coefficients values, standard deviations (S.E.)
and statistical significance for the tree survival models described in
Equations (3) and (4).
Effect Variable Coefficient S.E. Wald statistic Significance
Equation (3)
b
0
Intercept –2.035 0.145 196.7 0.000
b
1
d 0.036 0.007 24.5 0.000
b
2
BAL –0.026 0.008 11.4 0.001
b
3
D
g
0.084 0.009 89.6 0.000
b
4
G 0.062 0.005 150.1 0.000
b
5
s
d
/(D
g
+0.01) –1.722 0.470 13.4 0.000
b
6
PPinea 1.299 0.212 37.7 0.000
b
7
QSuber 1.431 0.136 110.2 0.000
Equation (4)
b
0
Intercept 2.224 0.123 325.1 0.000
b
1
d 0.110 0.006 293.1 0.000
b
2
P
dead
–7.117 0.135 2788.5 0.000
Tab le V. Odds ratios for the predictors of Equations (3) and (4). The
values of the unchanged variables are set equal to their mean values
in the study material unless indicated otherwise.
Variable Unit Change in the variable Increase in survival
probability
Equation (3)
d cm From 20 to 30 Increases 1.43 times
BAL m
2
ha
−1
15 to 5 1.30
G m
2
ha
−1
20 to 30 1.86
D
g
, s
d
= 5 cm 20to30 2.67
D
g
, s
d
= 15 cm 20 to 30 3.56
s
d
, D
g
= 10 cm 15 to 5 5.60
s
d
, D
g
= 30 cm 15 to 5 1.77
PPinea –0to1 3.67
QSuber –0to1 4.18
Equation (4)
d cm 20 to 30 Increases 3.00 times
P
dead
– 0.6 to 0.4 4.15
derived from them. Damage and survival depended mainly on
variables that can be changed through forest management. The
study used a large dataset of forest stand plots and fires, with
a broad spatial and temporal coverage. Therefore, the models
allow the manager to predict the post-fire damage for a wide
range of forest types under the current fire regime of Catalonia.
One way to use these models in forest planning calcula-
tions and scenario analyses is to generate fire occurrences with
the earlier model of González et al. [15], after which the de-
gree of damage can be predicted with the stand level model
of this study (Eq. (2)). In simulators that use individual trees,
the survivors can be selected using Equation (4). Another pos-
sibility in individual tree simulators is to use Equation (3) di-
rectly to select the survivors, after which the stand-level dam-
age may be calculated as the proportion of dead trees. The
first approach offers the possibility to generate more variation
in stand-level results if a stochastic component corresponding
to the residual variation of the stand level model is added to
the prediction. If the whole range on variation in the degree of
740 J.R. González et al.
A
0
0.2
0.4
0.6
0.8
1
8
12
16
20
24
28
32
36
40
Diameter, cm
Survival probability or
proportion of trees
N
1
2
B
0
0.2
0.4
0.6
0.8
1
8
12
16
20
24
28
32
36
40
Diameter, cm
Survival probability or
proportion of trees
N
1
2
C
0
0.2
0.4
0.6
0.8
1
8
12
16
20
24
28
32
36
40
Diameter, cm
Survival probability or
proportion of trees
N
1
2
D
0
0.2
0.4
0.6
0.8
1
8
12
16
20
24
28
32
36
40
Diameter, cm
Survival probability or
proportion of trees
N
1
2
Figure 7. Survival probability and relative number of trees for different diameter classes in an even-aged mature (A), young even-aged (B),
two-storied (C), and uneven-aged (D) pine stand that has been swept by fire. The survival probability has been calculated in two ways: (1) with
a model in which the degree of damage is not a predictor (Eq. (3)), and (2) using a model (Eq. (4)) in which the predicted degree of damage
(Eq. (2)) is used as a predictor. The slope of the terrain was 10 degrees.
damage should be mimicked in simulations, a stochastic use of
the stand level model is then the correct way to use the models.
If stochastic simulation is not a reasonable option (when
the best possible prediction is wanted to individual stands sep-
arately) the models can be used to calculate a “fire loss index”
for the stands. The loss index is equal to the predicted prob-
ability of fire occurrence ([14]; their Eq. (1)) times the pre-
dicted degree of damage (Eq. (2) of this study). This index
may be calculated for alternative stand management sched-
ules. Then, in forest planning, minimisation of the loss index
could be used as a criterion when selecting the best treatment
schedules for the stands.
Compared with previous models for post-fire tree mortality,
our models do not use tissue damage or fire severity as predic-
tors, since those predictors are seldom available in the inven-
tory data and they can not be predicted accurately in the future.
However, some of the variables included in the models have
a clear correlation with fire behaviour. For example, steeper
slopes increase the expected damage, which may be explained
by an easier transfer of heat uphill, through a possible “chim-
ney” effect, and lower fuel moisture [1]. Species composition,
defined in one model as pine vs. non-pine stand, was found
to have an important effect on the damage, probably due to
the high flammability of conifers [6]. Other variables used to
0
10
20
30
40
50
ABCD
Stand
Damage, %
Predicted
Simulated 1
Simulated 2
Figure 8. Predicted (Eq. (2)) and simulated damage for the same
stands (A,B,C,D) as in Figure 6. The simulated damage is calculated
using the survival probabilities of individual trees. Numbers 1 and
2 refer to the calculation method: method 1 uses survival function in
which stand level damage is not a predictor (Eq. (3)) while method 2
uses a model (Eq. (4)) where the predicted stand level damage degree
is a predictor.
describe stand structure had coefficients that were in accor-
dance with studies that indicate that mature even-aged stands
present a lower expected fire damage than multi-layered [31]
and young even-aged stands.
Tree survival in forest fires 741
Apart from variables included in the models, many other
variables related to site and stand characteristics were tested
and rejected as predictors, even if their effect on fire be-
haviour has been universally accepted, such as elevation and
the amount of ground vegetation. Elevation, which plays an
important role in the fire occurrence probability [15, 23], did
not correlate with the degree of damage in burned areas. This
is because most of the burned stands were located in low ele-
vations where temperature is high and moisture low. Elevation
has a strong influence on fire occurrence [15], but not on the
degree of damage in a burned forest.
The effect of ground vegetation on tree survival was not sig-
nificant. This may be partly because ground vegetation could
have changed significantly during the 11-years fire observa-
tion period [27], implying that the initial amount of bushes and
small trees may not have described well enough the situation in
the year of the fire event. Nevertheless, it may be assumed that
the stand characteristics included in the models correlate with
the amount and characteristics of ground vegetation, meaning
that these variables were, to some degree, implicitly included
in the model.
Other variables that are also often included in the models
are fire size and time between the occurrence of fire and the
plot measurement. These variables were carefully analysed,
but did not improve the models. Even if the size of the fire can
give some information about the particular weather conditions
at the time of the fire, high variability in fire spreading con-
ditions is a normal characteristic of large fires [26], reducing
the possibilities of knowing the fire conditions prevailing in a
given point within the burned area. Time since fire has also
been reported to be an important variable for determining the
post-fire tree mortality, with relevant differences between the
results obtained from early measurements (< 3 years after fire)
and those from later ones [34]. In our study, the plots that were
burned less than three years prior to the 3rd IFN measurement
did not indicate a survival level different from that of the other
plots.
Tree diameter was found to be a significant predictor of
tree survival, which is in accordance with previous studies
[18, 22, 32, 34]. The result may be explained by thicker bark
and higher canopy normally observed in bigger trees, which
prevents their more sensible tissues to be reached by the fire.
The effect of the hierarchical position of the tree, included in
one of the survival models through the BAL variable, was also
significant. This result agrees with the idea that tree mortality
after fire may be caused not only by the short-term stress that
the disturbance involves, but also by previous long-term stress
[38], dominant trees having experienced less competition than
smaller stress. In two cases, the probability of survival was
found to be species-dependent, cork oak (Q. suber) and stone
pine (P. pinea) being exceptionally fire tolerant. The high sur-
vival rate of cork oaks can be explained by its thick bark and
re-sprouting capability [28]. In the case of stone pine, the long
distance of the crown from the ground, its thick bark, and the
intensive management (bush cleaning and pruning) of stone
pine plantations, might be explanations for the good fire toler-
ance of this tree species.
The models developed for predicting tree survival allow for
the quantification of the expected post-fire damage and identi-
fying the trees most likely to survive. The models are based on
empirical data, and they are management-oriented by nature
as they enable the manager to quantify the effect of different
management options on the expected fire damage. The charac-
teristics of the models allow their use in numerous studies and
applications, related with the integration of fire risk into forest
management planning. For instance, they can be used together
with fire probability models [15] in stand-level optimisation
studies [13] and landscape level planning studies [14]. Another
important use of the models is scenario analyses at a regional
scale, which in Spanish conditions could be certainly biased if
fires are omitted. In addition to removing biases, the models
allow the analyst to compare different management policy al-
ternatives with respect to the expected losses caused by forest
fires.
The data used in this study and the variables included in
the presented models were chosen so that the models could be
used in forest management planning. It is not meaningful to
compare our models with previous models which use tree tis-
sue damage or fire intensity as predictors for estimating post-
fire mortality. This is because fire spreading conditions and
tissue damages are not known in planning.
Acknowledgements: This study was financed by the MEDACTHU
project from the MEDOCC Interreg IIIB programme and the EU
EFORWOOD project. The authors want to thank the Juan de la
Cierva and Torres Quevedo programs from the Spanish Ministry of
science and education for supporting the work of two of the authors.
The authors wish to thank also the members of the Servei de Pre-
venció d’Incendis Forestals de Catalonia for providing the fire data
used in this study, and Mr. David Gritten for the linguistic revision
of the manuscript. The study was conducted within the MEDFOREX
program coordinated by the Forest Technology Centre of Catalonia.
REFERENCES
[1] Agee J.K., Fire ecology of Pacific Northwest forests, Island Press,
Washington, DC, USA, 1993, 493 p.
[2] Agee J.K., Skinner C.N., Basic principles of forest fuel reduction
treatments, For. Ecol. Manage. 211 (2005) 83–96.
[3] Alexandrian D., Esnault F., Calabri G., Forest fires in the
Mediterranean area, Unasylva 197 (2000) 35–41.
[4] ArcGIS 9.0., ESRI, 2004.
[5] Beverly J.L., Martell D.L., Modeling Pinus strobus mortality fol-
lowing prescribed fire in Quetico Provincial Park, northwestern
Ontario, Can. J. For. Res. 33 (2003) 740–751.
[6] Bond W.J., Van Wilgen B.W., Why and how do ecosystems burn?
Fire and Plants, Chapman & Hall, New York, 1996, pp. 17–33.
[7] Brown J.K., DeByle N.V., Fire damage, mortality, and suckering in
aspen, Can. J. For. Res. 17 (1987) 1100–1109.
[8] DGCN, Tercer Inventario Forestal Nacional (1997–2007) Cataluña:
Barcelona, Ministerio de Medio Ambiente, Madrid, 2005.
[9] Finney M.A., Modeling the spread and behaviour of prescribed
natural fires, Proc. 12th Conf. Fire and Forest Meteorology, 1994,
pp. 138–143.
742 J.R. González et al.
[10] Finney M.A., Mechanistic modeling of landscape fire patterns, in:
Mladenoff D.J., Baker W.L., (Eds.), Spatial modeling of forest land-
scape change: approaches and applications, Cambridge University
Press, Cambridge, UK, 1999, pp. 186–209.
[11] Fowler J.F., Sieg C.H., Postfire mortality of ponderosa pine and
Douglas-fir: A review of methods to predict tree death, Gen.
Tech. Rep. RMRS-GTR-132. Fort Collins, CO, US Department
of Agriculture, Forest Service, Rocky Mountain Research Station,
2004, 25 p.
[12] Gadow K.v., Evaluating risk in forest planning models, Silva Fenn.
34 (2000) 181–191.
[13] González J.R., Pukkala T., Palahí M., Optimising the management
of Pinus sylvestris L. stand under risk of fire in Catalonia (north-east
of Spain), Ann. For. Sci. 62 (2005) 493–501
[14] González J.R., Palahí M., Pukkala T., Integrating fire risk consider-
ations in forest management planning – a landscape level perspec-
tive, Landsc. Ecol. 20 (2005) 975–970.
[15] González J.R., Palahí M., Trasobares A., Pukkala T., A fire risk
model for forest stands in Catalonia (north-east of Spain), Ann. For.
Sci. 63 (2006) 169–176.
[16] Guinto D.F., House A.P.N., Xu Z.H., Saffigna P.G., Impacts of re-
peated fuel reduction burning on tree growth, mortality and recruit-
ment in mixed species eucalypt forests of southeast Queensland,
For. Ecol. Manage. 115 (1999) (1):13–27.
[17] He H.S., Mladenoff D.J., Spatially explicit and stochastic simula-
tion of forest landscape fire disturbance and succession, Ecology 80
(1999) 81–99.
[18] Hély C., Flannigan M., Bergeron Y., Modeling tree mortality fol-
lowing wildfire in the southeastern Canadian mixed-wood boreal
forest, For. Sci. 49 (2003) 566–576.
[19] Hosmer D.W., Lemeshow, S., Applied logistic regression, 2nd ed.,
Wiley Series in Probability and Mathematical Statistics, New York,
2000, 307 p.
[20] ICONA, Segundo Inventario Forestal Nacional (1986–1995),
Cataluña: Barcelona, Madrid, 1993.
[21] Jalkanen A., Mattila U., Logistic regression models for wind and
snow damage in northern Finland based on the National Forest
Inventory data, For. Ecol. Manage. 135 (2000) 315–330.
[22] Linder P., Jonsson P., Niklasson M., Tree mortality after prescribed
burning in an old-growth Scots pine forest in Northern Sweden,
Silva Fenn. 32 (1998) 339–349.
[23] Martin R.E., Fire history and its role in succession. in: Means J.E.
(Ed.), Forest succession and stand development research in the
Northwest: Proceedings of a Symposium, USDA Forest Service
Forest Research Laboratory, Oregon State University, Corvallis,
Oregon, 1982, pp. 92–98.
[24] McHugh C.V., Kolb T.E., Ponderosa pine mortality following fire
in northern Arizona, Int. J. Wildl Fire, 12 (2003) 7–22.
[25] Mutch L.S., Parsons D., Mixed conifer forest mortality and estab-
lishment before and after prescribed fire in Sequoia National Park,
California, For. Sci. 44 (1998) 341–355.
[26] Ordóñez J.L., Retana J., Espelta J.M., Effects of tree size, crown
damage, and tree location on post-fire survival and cone production
of Pinus nigra trees, For. Ecol. Manage. 206 (2005) 109–117.
[27] Outcalt K.W., Wade D.D., Fuels management reduces tree mortality
from wildfires in southeastern United States, J. Appl. For. 28 (2004)
28–34.
[28] Pausas J.G., Resprouting of Quercus suber in NE Spain after fire, J.
Veg. Sci. 8 (1997) 703–706.
[29] Peterson D.L., Arbaugh M.J., Estimating postfire survival of
Douglas-fir in the Cascade Range, Can. J. For. 19 (1989) 530–533.
[30] Peterson D.L., Johnson M.C., Agee J.K., Jain T.B., McKenzie
D., Reinhard E.D., Forest structure and fire hazard in dry forests
of the Western United States, Gen. Tech. Rep. PNW-GTR-628.
Portland, OR, US Department of Agriculture, Forest Service,
Pacific Northwest Research Station, 2005, 30 p.
[31] Pollet J., Omi P.N., Effect of thinning and prescribed burning on
crown fire severity in ponderosa pine forests, Int. J. Wildl. Fire 11
(2002) 1–10.
[32] Rigolot E., Predicting postfire mortality of Pinus halepensis Mill.
and Pinus pinea L., Plant Ecol. 171 (2004) 139–151.
[33] Rothermel R.C., Predicting behavior and size of crown fires in the
northern Rocky Mountains, USDA Forest Service, Research Paper
INT-483, Ogden, Utah, 1991.
[34] Ryan K.C., Reinhardt E.D., Predicting postfire mortality of seven
western conifers, Can. J. For. Res. 18 (1988) 1291–1297.
[35] Saveland J.M., Neuenschwander L.F., A signal detection framework
to evaluate models of tree mortality following fire damage, For. Sci.
36 (1990) 66–76.
[36] SPSS Inc., SPSS Base system syntax reference Guide, Release 9.0,
1999.
[37] Tucker C.J., Vanpraet C., Sharman M.J., Vanfnttersum G., Satellite
remote sensing of total herbaceous biomass production in the
Senegalese Sahel: 1980–1984, Remote Sens. Environ. 17 (1985)
233–249.
[38] Van Mantgem P.J., Stephenson N.L., Mutch L.S., Johnson V.G.,
Esperanza A.M., Parsons D.J., Growth rate predicts mortality of
Abies concolor in both burned and unburned stands, Can. J. For.
Res. 33 (2003) 1029–1038.
[39] Van Wagner C.E., Conditions for the start and spread of crown fire,
Can. J. For. Res. 7 (1977) 23–34.
[40] Velez R., Mediterranean forest fires: A regional perspective,
Unasylva 162 (1990) 10–12.
[41] Weatherspoon C.P., Skinner C.N., An assessment of factors associ-
ated with damage to tree crowns from the 1987 wildfires in northern
California, For. Sci. 41 (1995) 430–451.