Báo cáo lâm nghiệp: "Patterns of longitudinal within-tree variation in pulpwood and solidwood traits differ among Eucalyptus globulus genotypes" pot
Bạn đang xem bản rút gọn của tài liệu. Xem và tải ngay bản đầy đủ của tài liệu tại đây (193.42 KB, 7 trang )
Ann. For. Sci. 64 (2007) 831–837 Available online at:
c
INRA, EDP Sciences, 2007 www.afs-journal.org
DOI: 10.1051/forest:2007064
Original article
Patterns of longitudinal within-tree variation in pulpwood and
solidwood traits differ among Eucalyptus globulus genotypes
Matthew G. Hamilton
a
*
, Bruce L. G
reaves
a
,BradM.Potts
a
,GregoryW.Dutkowski
b
a
School of Plant Science and Cooperative Research Centre for Forestry, University of Tasmania, Private Bag 55, Hobart TAS 7001 Australia
b
PlantPlan Genetics Pty Ltd, Private Bag 55, Hobart TAS 7001 Australia
(Received 18 October 2006; accepted 10 July 2007)
Abstract – Wood discs were sampled from 6 heights up the stem of 248 trees representing 10 subraces and 116 families grown in an E. globulus
base-population progeny trial. The lower stem had the least favourable wood properties for kraft pulpwood and most solidwood applications: bark was
thickest, basic density was lowest and kino, decay and shrinkage traits were greatest at or below 12% of tree height. Significant genetic differences at
the subrace level were revealed in diameter, bark thickness, basic density, decay and gross shrinkage and at the family within subrace level in diameter,
basic density and decay. However, subrace-by-height-category interactions in bark thickness, basic density, decay and gross shrinkage indicated that
differences among subraces were dependent on height in these traits. Examination of longitudinal trends revealed some evidence that the zone of thick
basal bark extended further up the stem in thicker-barked subraces and that the Southern Tasmania subrace might be less effective than other subraces
in restricting the longitudinal spread of decay after infection.
wood properties / Eucalyptus globulus / longitudinal variation / within-tree variation / genetic variation
Résumé – Les variations longitudinales intra-arbre des propriétés papetières et du bois varient entre les génotypes d’Eucalyptus globulus. Des
disques de bois ont été prélevés à 6 hauteurs différentes dans 248 arbres représentant 10 provenances et 116 familles d’un dispositif de provenance-
descendance d’E. glob ulus. La partie inférieure des troncs présente les propriétés du bois les moins bonnes pour la pâte Kraft et la plupart des utilisations
du bois massif : l’écorce est plus épaisse, l’infradensité plus faible tandis que le lino, la dégradation biologique et les retraits sont plus importants jusqu’à
12 % de la hauteur des tiges. Des différences génétiques significatives ont été établies au niveau provenance pour le diamètre, l’épaisseur d’écorce,
l’infradensité et la dégradation biologique et au niveau famille dans une provenance pour l’infradensité et la dégradation biologique. Cependant, pour
ces propriétés, les interactions provenance par catégorie de hauteur, pour l’épaisseur d’écorce, l’infradensité, la dégradation biologique et le retrait total,
indiquent que les différences entre provenances dépendent de la hauteur. L’analyse des variations longitudinales fait apparaître que la longueur de la
bille de pied ayant une écorce plus épaisse est plus importante pour les provenances présentant des écorces épaisses et que les provenances de sud de la
Tasmanie pourraient être moins efficaces que les autres pour limiter la diffusion des pourritures après infection.
propriétés du bois / variation longitudinale / variation intra arbre / variation génétique / Eucalyptus globulus
1. INTRODUCTION
Eucalyptus globulus Labill. (Tasmanian Blue Gum; sensu
Brooker [9]) is native to south-eastern Australia and is one of
the most important pulpwood plantation species in temperate
regions of the world. Substantial areas of plantation are grown
for this purpose in Australia, Chile, Portugal and Spain [27].
However, there is growing interest in using plantation-grown
E. globulus to produce sawn timber and reconstituted solid-
wood products [23].
For breeding and mensurational purposes it is desirable
to estimate whole-tree wood quality values for commercially
important traits using cheap and non-destructive sampling
techniques. Knowledge of within-tree variation is required to
determine the most representative point to sample or mea-
sure and to develop relationships between point estimates and
whole-tree values [30]. Mensurationists also use knowledge of
* Corresponding author:
longitudinal within-tree variation to estimate yields of individ-
ual product classes (e.g. log sizes by diameter and length [21]).
Similarly, timber processors can use such knowledge to ensure
trees are used in the most appropriate and profitable manner by
modifying processing practices or allocating logs to particular
end uses according to the known properties of different stem
sections.
Longitudinal variation in diameter, bark thickness, basic
density and shrinkage traits has previously been studied in
E. globulus [16, 19, 28, 30, 31, 41]. However, with the excep-
tion of Guimaraes et al. [16], these studies did not investigate if
patterns of longitudinal variation differed among intra-specific
genotypes. If present, such differences in longitudinal varia-
tion (i.e. genotype-by-height interaction) may introduce bias
according to genotype in estimates of whole-tree values and/or
the characteristics of specific stem sections derived from sam-
ple measurements.
This study examines longitudinal variation in diameter
under bark, bark thickness, basic density, kino, decay and
Article published by EDP Sciences and available at or />832 M.G. Hamilton et al.
Table I. Summary of felled trees by subrace.
Subrace Number of families Number of trees Mean DBHOB
§
(cm) Mean height (m)
Cape Patton* 9 18 29.2 24.5
Eastern Otways* 10 21 28.0 24.1
Flinders Island** 13 27 30.0 25.3
King Island 13 28 31.5 25.5
Southern Furneaux** 9 18 28.7 23.5
Southern Tasmania 10 21 27.6 25.1
South-Eastern Tasmania 11 24 27.8 23.7
Strzelecki Ranges (incl. Madalya Rd.) 18 37 28.9 24.6
Western Otways 13 32 30.0 25.8
Western Tasmania 10 22 26.2 24.3
Total 116 248 28.9 24.7
* Eastern Otways race, ** Furneaux race,
§
diameter at breast height (1.3 m) over bark.
shrinkage properties of E. globulus. Furthermore, it investi-
gates whether patterns of longitudinal variation are consis-
tent across subraces and families within subraces. Differences
among genotypes are discussed in this context.
2. MATERIALS AND METHODS
This study was undertaken on trees planted in a E. globulus base-
population progeny trial (Gunns Ltd.) growing at West Ridgley in
north-western Tasmania (for details see Apiolaza et al. [1] and Mac-
Donald et al. [18]). The trial was divided into two areas approxi-
mately 150 m apart containing two and three replicates respectively.
This study was undertaken on 248 trees from 116 fam-
ilies and 10 subraces (refer to Dutkowski and Potts [11],
updated according to the findings of Lopez et al. [17] at
felled as part of a
sawmilling trial [15]. Of these, 58 trees from 32 families and 6 sub-
races had previously been cored or assessed for pilodyn penetration
at or near breast height (1.3 m) [1, 11, 18]. The ten subraces, from
eight races, were selected because of their commercial importance
and wide distribution across the natural geographic range of E. glob-
ulus (Tab. I). Between 9 and 18 families per subrace were selected
for study from up to six seed collection localities within each sub-
race so as to encompass a wide range of genetic diversity. To enable
extraction of a sawlog from each tree, trees within families were se-
lected on the basis of diameter and stem straightness. Average felled-
tree heights and diameters at breast height over bark are presented
by subrace in Table I. A single 1.5 m long sawlog was cut from the
straightest part of the lower stem in each tree [15]. At the time of
sampling, 15 years after establishment, the trial had not been thinned
or pruned (i.e. it had been managed as a pulpwood stand) but 54% of
the original trees had died.
Wood discs, approximately 25 mm thick, were extracted from six
heights within each tree. The mean height of discs within each of
the height categories was 0%, 5% (breast height, BH), 12% (base-
of-sawlog, BSL), 18% (top-of-sawlog, TSL), 40% and 60% of tree
height. The percentage height of individual breast height, base-of-
sawlog and top-of-sawlog discs varied between trees due to differ-
ences in tree height and/or the height at which sawlogs were ex-
tracted. After extraction, the discs were immediately placed in plastic
bags to minimise moisture loss.
Disc diameter under bark (DUB) was measured using a diam-
eter tape. Bark thickness was measured using callipers, multiplied
by two and expressed as a percentage of diameter over bark. Pho-
tographs of green discs were used to visually assess the extent of
kino [12] and decay. To assess kino, discs were visually divided into
eight radially-oriented sectors of equal size and the number of sectors
with kino veins and/or pockets tallied. White or light-coloured decay
was generally observed to radiate from the pith. Decay in each disc
was scored as a percentage of the disc radius affected: 0%, 1–20%,
21–40%, 41–60%, 61–80% and 81–100%. Less advanced and less
visibly obvious (i.e. incipient) decay was present but not considered
in the visual assessment.
Whole discs were deemed impractically large for processing and
transport and were sawn through the pith into symmetrical half-discs
(i.e. where stem eccentricity was evident, areas deemed most likely
to contain a high proportion of tension wood fibres were distributed
evenly between half-discs). One half-disc was randomly selected
for assessment and the other discarded. Debarked green volumes of
the selected half-discs were measured using the water displacement
method [35]. The half-discs were then pre-dried [22] in a kiln to a
moisture content of approximately 20%.
During pre-drying, the half-discs shrank and bent at their pith [15]
due to higher tangential than radial gross shrinkage (i.e. shrinkage
anisotropy), the primary explanation for cupping and some forms of
cracking (i.e. checking) in back-sawn boards [34]. Gross shrinkage
angle was measured as the angle formed between one half of the
cut (i.e. radial) surface of each half-disc and a flat surface, against
which the other half of the cut surface was held. The half-discs were
then steamed (i.e. reconditioned) to recover collapse [10,22]. Finally,
discs were air-dried in a sheltered area to equilibrium moisture con-
tent (approximately 13%). After air-drying, net shrinkage angle was
measured using the same procedure used to measure gross shrinkage
angle. Discs that split during drying were excluded from analyses.
Finally, the half-discs were oven dried at 105
◦
C, weighed and their
basic densities calculated [35].
Separate restricted maximum likelihood (REML) mixed model
analyses were conducted for each trait. The model fitted area, height
category, subrace and subrace-by-height-category interaction as fixed
effects, height category by percentage disc height as a covariate
and replicate within area, family within subrace (hereafter referred
to as ‘family’) and family-by-height-category interaction as ran-
dom effects. An unstructured within-tree residual variance/covariance
matrix, allowing for different residual variances at each height cate-
gory, was fitted to account for within-tree covariation among height
categories. The height category by percentage disc height covariate
was fitted for the breast height, base-of-sawlog and top-of-sawlog
height categories only, as percentage disc height was invariable in
the other height categories. Fourteen outlying observations from three
Within-tree variation in Eucalyptus globulus 833
Table II. Significance tests for genetic, stem height and interaction effects from analysis of growth and wood quality traits. F-test ratios are
reported for fixed effects.
Fixed effects Random effects
Trait Subrace Height Subrace-by- Family within Family-within-subrace-
category height-category subrace by-height-category
Logarithm of diameter under bark 3.0 ** 2126 *** 1.0
ns
** ns
Bark thickness 32.8 *** 272 *** 3.2 *** ns ns
Basic density 4.1 *** 99 *** 1.4 * ** ns
Kino 1.0
ns
37 *** 1.0
ns
ns ns
Gross shrinkage angle 1.1
ns
136 *** 1.9 *** ns ns
Net shrinkage angle 1.7
ns
23 *** 1.2
ns
ns ns
ns
Not significant, * P < 0.05, ** P < 0.01, *** P < 0.001.
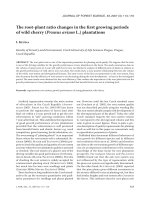
Figure 1. Height category means and 95% confidence intervals for all traits under consideration. DUB is the back-transformed diameter under
bark and thus 95% confidence intervals are asymmetric. Maximum and minimum height category least squares means are presented for each
trait on the x axis.
traits were excluded from final analyses as they unambiguously repre-
sented measurement or data-entry errors. Analyses were undertaken
using ASReml. The significance of the fixed effects were gauged with
F-tests and random effects were tested using likelihood ratio tests
[13, 32].
Diameter under bark data were logarithm transformed prior to
analysis. Decay was initially fitted as a fixed effect in the analysis
of basic density. It was found to significantly affect basic density but
its exclusion from the model did not change the interpretation of the
subrace, family or interaction effects, the principal foci of this study.
Decay was analysed separately for each height category due to
heterogeneous error variances even after arcsine square root trans-
formation. Furthermore, observation at the time of disc extraction
suggested that decay was greater in trees that had previously been
sampled for wood cores or assessed for pilodyn penetration. Anal-
yses revealed a significant subrace by sampling category (i.e. previ-
ously sampled or unsampled) interaction in some height categories,
indicating that differences in decay among subraces were different in
the previously sampled and unsampled groups of trees. Accordingly,
separate analyses were undertaken on data from each height category
within sampling category.
Trait least square means and 95% confidence intervals were esti-
mated at the mean percentage disc height within each height category.
For those traits in which a significant subrace-by-height-category in-
teraction was identified, separate analyses were undertaken for each
height category. Subrace least squares means were estimated at the
mean percentage disc height within each height category to enable
interpretation of subrace-by-height-category interactions.
3. RESULTS
Height category had a highly significant effect on diame-
ter under bark, bark thickness, basic density, kino, and gross
and net shrinkage angle (Tab. II). In general, bark thickness
rapidly decreased with height in the lower stem before sta-
bilising towards and slightly increasing above 40% of tree
height. Overall, basic density also tended to decrease with
height from the base before increasing between 5% and 60%
of tree height and kino, gross shrinkage and net shrinkage
generally decreased with height (Fig. 1). However, specific
patterns of longitudinal variation were found to vary among
834 M.G. Hamilton et al.
Figure 2. Subrace least squares means for bark thickness within height categories. The lengths of the bars are equal to 1.96 times the overall
standard error of difference between subraces within each height category.
subraces in bark thickness, basic density and gross shrink-
age angle, as indicated by the significant subrace-by-height-
category interactions in these traits (Tab. II). Overall signifi-
cant differences between subraces were identified in diameter
under bark, bark thickness and basic density. Significant fam-
ily variation was observed in diameter under bark and basic
density but no significant family-by-height-category interac-
tion effects were identified in any of the traits analysed using
the full model.
Although the magnitude of differences in bark thickness
between subraces varied, the rankings of subraces were sim-
ilar across height categories (Fig. 2) and highly significant
differences between subraces (P < 0.001) were identified at
all heights when analysed separately. Furthermore, there was
some evidence that the zone of thick basal bark extended fur-
ther up the stem in thick-barked (e.g. Eastern Otways and
Strzelecki Ranges) than in thin-barked subraces (e.g. King
Island and Western Tasmania; Fig. 2).
Separate height category analyses of basic density revealed
significant differences (P 0.045) between subraces at all
heights except the base-of-sawlog. The King Island and South-
Eastern Tasmania subraces had below average and the Eastern
Otways and Strzelecki Ranges had above average basic den-
sity in all height categories.
Substantially more variation in gross shrinkage angle
among subraces was observed in the lower three height cate-
gories than those further up the stem. Analysis within individ-
ual height categories revealed significant differences between
subraces at 0% of tree height (P = 0.011) and breast height
(P = 0.009). South-Eastern Tasmania exhibited relatively low
levels of gross shrinkage and was ranked in the top three sub-
races in all height categories. Conversely, Flinders Island ex-
hibited high gross shrinkage and was ranked in the bottom two
subraces in all height categories except 60%.
Although significant differences in shrinkage traits were
observed between height categories and/or genotypes, it is
possible that the magnitude of these differences were under-
estimated in this study. There was some evidence for positive
correlations of disc splitting with diameter and shrinkage angle
and, as split discs were excluded from analyses, mean shrink-
age angle in height categories and genotypes with a higher un-
derlying shrinkage angle and/or larger diameter may have been
underestimated. Twenty-two percent of the half-discs split dur-
ing pre-drying and a further 34% split during reconditioning
and final-drying.
The most notable feature of longitudinal variation in decay
in previously sampled trees was a large peak at breast height
(Fig. 1). However, if breast height was excluded, decay levels
were similar at each height category (e.g. 16.9% and 19.6% at
0% of tree height in previously sampled and unsampled trees
respectively) and there was a general trend toward diminishing
decay with height in both the previously sampled and unsam-
pled groups of trees. Very little decay was observed in the 40%
and 60% height categories.
In the previously sampled group, significant differences in
decay between subraces were observed in the 0% (P = 0.
024)
and base-of-sawlog height categories (P = 0.015). Notably
high decay was observed in the Southern Tasmania subrace
at the base- and top-of-sawlog (Fig. 3). In the previously
unsampled group, the subrace term was significant at the top-
of-sawlog only (P = 0.009). At heights in which significant
differences between subraces were identified, the Southern
Tasmania subrace contained the most decay in both previously
sampled (Fig. 3) and unsampled (Tab. III) trees. In contrast, the
Strzelecki and Flinders Island subraces exhibited little decay
in both sampled and unsampled trees.
In previously unsampled trees, significant family variation
in decay was found in the 0% (P = 0.009) and breast height
(P = 0.031) categories. In sampled trees, no significant family
variation was observed. The presence of significant differences
among subraces and families in the lower stem and extremely
low decay levels in the upper stem was indicative of genotype-
by-height-category interaction.
Within-tree variation in Eucalyptus globulus 835
Figure 3. Subrace least squares means for decay in previously sampled trees within height categories. Only subraces previously sampled for
wood property assessment are shown. The lengths of the bars are equal to 1.96 times the overall standard error of difference between subraces
within each height category.
Table III. Subrace least squares mean decay levels from previously
unsampled trees within the top-of-sawlog height category. Mean de-
cay is expressed as a percentage of disc radius.
Subrace Mean decay (%) (SE)
Flinders Island 7.0 (4.8)
Strzelecki Ranges (including Madalya Rd.) 8.2 (4.2)
King Island 8.5 (4.8)
Western Tasmania 9.1 (4.6)
South-Eastern Tasmania 11.0 (4.6)
Eastern Otways 11.8 (4.5)
Southern Furneaux 14.5 (4.8)
Cape Patton 15.4 (4.7)
Western Otways 21.2 (4.7)
Southern Tasmania 25.9 (5.2)
4. DISCUSSION
4.1. Longitudinal variation
The longitudinal trends observed in bark thickness and ba-
sic density (Fig. 1) were consistent with previous findings for
E. globulus [19, 28, 30]. The distinct peak in decay at breast
height observed in the sampled group of trees was almost cer-
tainly caused by fungi that infected stems through wounds
associated with previous sampling for wood property assess-
ment (Fig. 1). Sampling-induced decay has the potential to
modify both the physical and chemical properties of wood in
standing trees. Therefore, individual trees should be sampled
for these traits only once. The observed longitudinal variation
in kino score may have been due to longitudinal variation in
physiology, longitudinal variation in the risk of injury to the
cambium [12] and/or the fact that the base of trees were ex-
posed to such injury from a young age. The longitudinal trend
in gross shrinkage angle was consistent with trends observed
in other studies of shrinkage traits and tension wood [31, 41].
The lower basic density, greater decay, greater kino, and
higher gross and net shrinkage angle observed in the lower
stem are likely to have negative implications for the proces-
sors of plantation-grown E. globulus wood. High basic density
is desired for kraft pulp [8, 14] and most solidwood products
[5, 29, 42], the presence of decay or kino can result in de-
grade in solidwood products [2–4] and timber exhibiting high
shrinkage angle is likely to be more prone to drying degrade.
Suboptimal expression of these traits in the lower stem dis-
proportionately affects whole-tree economic value because the
lower stem represents a high proportion of total stem volume
and produces logs of the largest diameter. Large diameter logs
yield wide boards and high green recoveries in sawmills [37]
and exhibit high conversion volumes per unit time in veneer
mills [33].
Although suboptimal, the longitudinal trends observed in
this study may not preclude the use of plantation-grown
E. globulus wood in the manufacture of any given product.
For example, plantation-grown E. globulus is sought after
for kraft pulp production [27]. Furthermore, decay and kino
have been shown to be of secondary importance compared to
other sources of degrade, such as knots and drying defects,
in sawmilling trials [40, 42, 43]. There is also evidence that
plantation-grown E. globulus can be dried to meet appearance
specifications if suitable sawing (e.g. quarter-sawing) and dry-
ing (e.g. controlled kiln drying) strategies are adopted [38,39],
albeit at potentially greater production cost and with lower re-
covery of green timber [7, 23]. Additionally, it is possible that
observed longitudinal trends in some traits are not represen-
tative of what would occur under solidwood silviculture. For
example, the extent of decay in some height categories might
have been different if the trial had been thinned and pruned
[25, 36, 37].
4.2. Genotype-by-height-category interaction
The significant subrace-by-height-category interaction de-
tected in bark thickness (Tab. II) appeared to be caused by
changes in the magnitude of differences between subraces with
height without extensive changes in their ranking. Dutkowski
and Potts [11] suggested that thicker bark could be an adap-
tation to higher fire frequency and water stress. The extension
836 M.G. Hamilton et al.
of the zone of thick basal bark further up the stem observed
in thick-barked subraces may be a further adaptation to these
environmental factors.
Estimates of subrace least squares means for gross shrink-
age angle and basic density within height categories were not
precise enough to enable meaningful discussion of variation
in longitudinal trends among subraces. However, high decay
at the base-of-sawlog indicated that the Southern Tasmania
subrace might be less effective in restricting the longitudinal
spread of decay than other subraces (Fig. 3). The presence of
extremely low levels of decay in the upper stem and signif-
icant differences among families in the lower stem indicated
that longitudinal trends in decay were different among fami-
lies in previously unsampled trees. Accordingly, measurement
of decay for breeding purposes should be undertaken at a con-
sistent height in the lower stem.
4.3. Differences between genotypes
The rankings of subraces for bark thickness (Fig. 2) were
consistent with those observed by Dutkowski and Potts [11]
and Lopez et al. [17]. The generally low basic densities of
King Island and South-Eastern Tasmania and high basic den-
sities of the Eastern Otways and Strzelecki Ranges were also
consistent with the findings of other studies [11, 17, 20]. Fur-
thermore, Poke et al. [26] reported that localities they studied
from within the Strzelecki and Flinders Island subraces exhib-
ited relatively low levels of decay, as was the case in this study.
The absence of significant genotype-by-height-category in-
teractions in the logarithm of diameter under bark indicated
that the ratios of untransformed diameters between height cat-
egories, and thus the shape of stems [6], were not significantly
different among genotypes. However, given the limited num-
ber of trees felled in this study, minor differences in stem shape
may not have been detected. Although not directly compa-
rable with the findings of the current study, Guimaraes et al.
[16] identified significant differences in tree taper parameters
among E. globulus provenances.
The significant differences in bark thickness observed
among subraces suggested that estimates of under-bark di-
ameter, and thus under-bark whole-tree volume and log sizes
[21, 24], derived from over bark measurements would be im-
proved with the application of subrace specific relationships.
Furthermore, tree volume equations and taper functions devel-
oped using data from plantations established prior to the mid
1990’s may not be accurate when applied to plantations estab-
lished since, because the mix of subraces grown has changed
considerably over the past 15 years [27].
The lack of significant differences in kino among genotypes
indicated that breeding is unlikely to be a useful means of re-
ducing kino in plantation grown E. globulus.However,theas-
sessment of kino induced in a controlled manner across geno-
types through deliberate injury of the cambium [12] may have
been more likely to reveal significant genetic differences.
5. CONCLUSION
The lower stem had the least favourable wood properties
for kraft pulpwood and most solidwood applications: bark was
thickest, basic density was lowest and kino, decay and shrink-
age angle were greatest at or below 12% of tree height. These
longitudinal trends have adverse implications for forest man-
agers and wood processors given that the lower stem repre-
sents a high proportion of total stem volume and produces logs
of the greatest diameter.
Although there was indirect evidence of such an inter-
action in decay, significant family-within-subrace-by-height-
category interaction was either not present in other traits or
not detectable given the limited number of trees felled for this
study. Evidence of subrace-by-height-category interaction was
identified in bark thickness, basic density, decay and gross
shrinkage angle indicating that patterns of longitudinal varia-
tion in these traits differed among subraces. However, the abil-
ity to interpret these interactions and discuss their implications
varied among traits.
Acknowledgements: Funding for this project was provided by
the Australian Research Council (linkage grants C00107465 and
LP0453704) and CRC for Sustainable Production Forestry. We ac-
knowledge the assistance of Luis Apiolaza, Stephen Aitken, Tony
Blythe, Jonathon Cock, Chris Harwood, Trevor Innes, Kelsey Joyce,
Ravinish Kumar, Robert Lewis, Caroline Mohammed, Andrew Prins,
Chris Schoenmaker, Renate Van Riet, Tim Watson, Stephen Wright
and Gunns Ltd.
REFERENCES
[1] Apiolaza L.A., Raymond C.A., Yeo B.J., Genetic variation of phys-
ical and chemical wood properties of Eucalyptus globulus, Silvae
Genet. 54 (2005) 160–166.
[2] AS 2082, Timber-Hardwood-Visually stress graded for structural
purposes, Standards Australia, Homebush, NSW, 2000.
[3] AS 2796.2, Timber-Hardwood-Sawn and milled products. Part 2:
Grade description, Standards Australia, Homebush, NSW, 2006.
[4] AS/NZS 2269, Plywood-Structural, Joint publication of Standards
Australia, Homebush, NSW and Standards New Zealand,
Wellington, NZ, 2004.
[5] AS/NZS 2878, Timber-Classification into strength groups, Joint
publication of Standards Australia, Homebush, NSW and Standards
New Zealand, Wellington, NZ, 2000.
[6] Avery T.E., Burkhart H.E., Forest measurements, McGraw-Hill,
New York, 1994.
[7] Bootle K.R., Wood in Australia: types, properties, uses, McGraw-
Hill, Sydney, 1983.
[8] Borralho N.M.G., Cotterill P.P., Kanowski P.J., Breeding objectives
for pulp production of Eucalyptus globulus under different indus-
trial cost structures, Can. J. For. Res. 23 (1993) 648–656.
[9] Brooker M.I.H., A new classification of the genus Eucalyptus
L’Her. (Myrtaceae), Aust. Syst. Bot. 13 (2000) 79–148.
[10] Chafe S.C., Collapse: an introduction, CSIRO, Division of Forest
Products, Melbourne, 1992.
[11] Dutkowski G.W., Potts B.M., Geographic patterns of genetic varia-
tion in Eucalyptus globulus ssp. globulus and a revised racial clas-
sification, Aust. J. Bot. 47 (1999) 237–263.
Within-tree variation in Eucalyptus globulus 837
[12] Eyles A., Mohammed C., Kino vein formation in Eucalyptus glob-
ulus and E. nitens, Aust. For. 66 (2003) 206–212.
[13] Gilmour A.R., Gogel B.J., Cullis B.R., Welham S.J., Thompson R.,
ASReml User Guide Release 1.0, VSN International Ltd., Hemel
Hempstead, UK, 2002.
[14] Greaves B.L., Borralho N.M.G., Raymond C.A., Breeding objective
for plantation eucalypts grown for production of kraft pulp, For. Sci.
43 (1997) 465–472.
[15] Greaves B.L., Hamilton M., Pilbeam D., Dutkowski G., Genetic
variation in commercial properties of six and fifteen year-old
Eucalyptus globulus, in: Borralho N., Pereira J.S., Marques C.,
Coutinho J., Madeira M., Tomé M. (Eds.), Eucalyptus in a chang-
ing world, Proceedings of an IUFRO conference, RAIZ, Aveiro,
Portugal, 2004, pp. 97–102.
[16] Guimaraes M.P., Almeida M.H., Tome M., Pereira H., Variation in
tree taper and DBH relationships among provenances of Eucalyptus
globulus, in: Potts B.M., Borralho N.M.G., Reid J.B., Cromer
R.N., Tibbits W.N., Raymond C.A. (Eds.), Eucalypt plantations:
Improving fibre yield and quality, Cooperative Research Centre for
Temperate Hardwood Forestry, Hobart, Tasmania, 1995, pp. 371–
372.
[17] Lopez G.A., Potts B.M., Dutkowski G.W., Traverso J.M.R.,
Quantitative genetics of Eucalyptus globulus:Affinities of land race
and native stand localities, Silvae Genet. 50 (2001) 244–252.
[18] MacDonald A.C., Borralho N.M.G., Potts B.M., Genetic variation
for growth and wood density in Eucalyptus globulus spp. globulus
in Tasmania (Australia), Silvae Genet. 46 (1997) 236–241.
[19] McKinley R.B., Shelbourne C.J.A., Low C.B., Penellum B.,
Kimberley M.O., Wood properties of young Eucalyptus nitens, E.
globulus,andE. maidenii in Northland, New Zealand, N. Z. J. For.
Sci. 32 (2002) 334–356.
[20] Muneri A., Raymond C.A., Genetic parameters and genotype-by-
environment interactions for basic density, pilodyn penetration and
stem diameter in Eucalyptus globulus, For. Genet. 7 (2000) 317–
328.
[21] Newnham R.M., A variable-form taper function, Petawawa
National Forestry Institute, Chalk River, Ontario, 1988.
[22] Nolan G., Innes T., Redman A., McGavin R., Australian hardwood
drying best practice manual: Part 2, Forest and Wood Products
Research and Development Corporation, Melbourne, Victoria,
2003.
[23] Nolan G., Washusen R., Jennings S., Greaves B., Parsons M.,
Eucalypt plantations for solid wood products in Australia – A
review, Forest and Wood Products Research and Development
Corporation, Melbourne, Victoria, 2005.
[24] Pillsbury N.H., Standiford R.B., Costello L.R., Rhoades T., Regan
P., Wood volume equations for central coast blue gum, California
Agriculture (Berkeley) 43 (1989) 13–14.
[25] Pinkard E.A., Mohammed C., Beadle C.L., Hall M.R., Worledge
D., Mollon A., Growth responses, physiology and decay associated
with pruning plantation-grown Eucalyptus globulus Labill. and E.
nitens (Deane and Maiden) Maiden, For. Ecol. Manage. 200 (2004)
263–277.
[26] Poke F.S., Potts B.M., Vaillancourt R.E., Raymond C.A., Genetic
parameters for lignin, extractives and decay in Eucalyptus globulus,
Ann. For. Sci. 63 (2006) 813–821.
[27] Potts B., Vaillancourt R.E., Jordan G., Dutkowski G.W., da Costa
e Silva J., McKinnon G.E., Steane D.A., Volker P., Lopez G.A.,
Apiolaza L., Li Y., Marques C., Borralho N., Exploration of
the Eucalyptus globulus gene pool, in: Borralho N., Pereira J.S.,
Marques C., Coutinho J., Madeira M., Tomé M. (Eds.), Eucalyptus
in a changing world, Proceedings of an IUFRO conference, RAIZ,
Aveiro, Portugal, 2004, pp. 46–61.
[28] Quilho T., Pereira H., Within and between-tree variation of bark
content and wood density of Eucalyptus globulus in commercial
plantations, IAWA J. 22 (2001) 255–265.
[29] Raymond C.A., Tree breeding issues for solid wood production,
The Future of Eucalypts for Wood Products, Proceedings of an
IUFRO Conference, Forest Industries Association of Tasmania,
Launceston, Tasmania, 2000, pp. 310–316.
[30] Raymond C.A., Muneri A., Nondestructive sampling of Eucalyptus
globulus
and E. nitens for wood properties. I. Basic density, Wood
Sci. Technol. 35 (2001) 27–39.
[31] Raymond C.A., Savage L., Harwood C., Longitudinal patterns of
volumetric shrinkage and collapse in Eucalyptus globulus and E.
nitens, in: Borralho N., Pereira J.S., Marques C., Coutinho J.,
Madeira M., Tomé M. (Eds.), Eucalyptus in a changing world,
Proceedings of an IUFRO conference, RAIZ, Aveiro, Portugal,
2004, 701 p.
[32] Self S.G., Liang K.Y., Asymptotic properties of maximum-
likelihood estimators and likelihood ratio tests under nonstandard
conditions, J. Am. Stat. Assoc. 82 (1987) 605–610.
[33] Shield E.D., Plantation grown eucalypts: utilisation for lumber
and rotary veneers – primary conversion, Anais do Seminario
Internacional de Utilizacao da Madeira de Eucalipto para Serraria,
Instituto de Pesquisas e Estudos Florestais (IPEF), Sao Paulo,
Brazil, 1995, pp. 133–139.
[34] Svensson S., Martensson A., Simulation of drying stresses in wood.
Part I: comparison between one- and two-dimensional models, Holz
Roh- Werkst. 57 (1999) 129–136.
[35] TAPPI, Basic density and moisture content of pulpwood, TAPPI,
South Norcross, Georgia, 1989.
[36] Wardlaw T.J., Mohammed C., Barry K., Eyles A., Wiseman D.,
Beadle C., Battaglia M., Pinkard E., Kube P., Interdisciplinary ap-
proach to the study and management of stem defect in eucalypts, N.
Z. J. For. Sci. 33 (2003) 385–398.
[37] Wardlaw T.J., Plumpton B.S., Walsh A.M., Hickey J.E.,
Comparison of sawn timber recovery and defect levels in
Eucalyptus regnans and E. globulus from thinned and unthinned
stands at Balts Road, Tasman Peninsula, Tasforests 15 (2004) 99–
109.
[38] Washusen R., Processing pruned and unpruned Eucalyptus globu-
lus managed for sawlog production to produce high value products,
Australian Government, Forest and Wood Products Research and
Development Corporation, Melbourne, Victoria, 2004.
[39] Washusen R., Blakemore P., Northway R., Vinden P., Waugh G.,
Recovery of dried appearance grade timber from Eucalyptus glob-
ulus Labill. grown in plantations in medium rainfall areas of the
southern Murray-Darling Basin, Aust. For. 63 (2000) 277–283.
[40] Washusen R., Waugh G., Hudson I., Vinden P., Appearance product
potential of plantation hardwoods from medium rainfall areas of the
southern Murray-Darling Basin. Green product recovery, Aust. For.
63 (2000) 66–71.
[41] Washusen R., Ades P., Vinden P., Tension wood occurrence in
Eucalyptus globulus Labill. I. The spatial distribution of tension
wood in one 11-year-old tree, Aust. For. 65 (2002) 120–126.
[42] Yang J.L., Waugh G., Potential of plantation-grown eucalypts for
structural sawn products. I. Eucalyptus globulus Labill. ssp. globu-
lus, Aust. For. 59 (1996) 90–98.
[43] Yang J.L., Fife D., Waugh G., Downes G., Blackwell P., The effect
of growth strain and other defects on the sawn timber quality of 10-
year-old Eucalyptus globulus Labill., Aust. For. 65 (2002) 31–37.