Báo cáo lâm nghiệp: "Field effect of P fertilization on N2 fixation rate of Ulex europaeus" doc
Bạn đang xem bản rút gọn của tài liệu. Xem và tải ngay bản đầy đủ của tài liệu tại đây (142.2 KB, 7 trang )
Ann. For. Sci. 64 (2007) 875–881 Available online at:
c
INRA, EDP Sciences, 2007 www.afs-journal.org
DOI: 10.1051/forest:2007066
Original article
Field effect of P fertilization on N
2
fixation r ate of Ulex europaeus
Xavier Cava r d
a
,LaurentAugusto
a
*
, Etienne S
aur
b
, Pierre Trichet
c
a
UMR 1220 TCEM (INRA), BP 81, 33883 Villenave d’Ornon Cedex, France
b
UMR 1220 TCEM (ENITAB), 1 cour du Général de Gaulle, BP 201, 33175 Gradignan Cedex, France
c
UR 1263 EPHYSE (INRA), 69 route d’Arcachon, 33612 Cestas Cedex, France
(Received 14 December 2006; accepted 26 April 2007)
Abstract – European gorse (Ulex europaeus L.) N
2
fixation rate (%Ndfa) was studied in a maritime pine (Pinus pinaster Aït.) oligotrophic forest.
Fertilization field trials were carried out on 5 sites with various inputs of phosphorus (0–240 kg P
2
O
5
.ha
−1
). Seven to ten years after pine planting, gorse
were sampled to evaluate the effect of P fertilization on gorse %Ndfa, determined using the
15
N natural abundance method. One of the prerequisites of
this method is the existence of a significant difference between the
15
N/
14
N ratios in the atmospheric N reference and in the stand soil N references.
This prerequisite was satisfied for 80 of 120 cases. The average %Ndfa was high (70 ± 3%) but with high local variability. No significant difference
in %Ndfa was detected among P treatments. Nitrogen concentration of gorse was significantly higher in the highest dose treatments compared to the
control.
Ulex europaeus / symbiotic N
2
fixation /
15
N natural abundance / P fertilization / Pinus pinaster
Résumé – Effet in situ de la fertilisation en phosphore sur le taux de fixation de l’azote atmosphérique d’Ulex europaeus. Le taux de fixation
de l’azote atmosphérique (%Ndfa) de l’ajonc d’Europe (Ulex europaeus L.) a été étudié dans une forêt oligotrophe de pins maritimes. Des essais de
fertilisation ont été établis avec plusieurs niveaux d’apport en phosphore (0–240 kg P
2
O
5
.ha
−1
). Sept à dix ans après la plantation de pins, les ajoncs
ont été échantillonnés afin d’évaluer l’effet de la fertilisation en phosphore sur le %Ndfa, calculé par la méthode de l’abondance naturelle en
15
N.
Cette méthode nécessite notamment une différence significative entre les rapports
15
N/
14
N de la référence atmosphérique et de la référence du sol des
peuplements. Cette condition était satisfaite dans 80 cas sur 120. Le %Ndfa moyen était élevé (70 ± 3 %) mais avec une grande variabilité locale.
Aucune différence des %Ndfa n’a été détectée entre les traitements. Les teneurs en azote des ajoncs étaient significativement plus élevées pour les doses
maximales que pour les témoins.
Ulex europaeus / fixation symbiotique de l’azote / abondance naturelle en
15
N / fertilisation en phosphore / Pinus pinaster
1. INTRODUCTION
Intensively managed forests may suffer in the medium or
long-term from nitrogen deficiency [11]. This is particularly
true for oligotrophic forests when nitrogen lost by biomass
outputs is not offset by N fertilization [16]. This issue has been
growing in importance since sylvicultural practices have be-
come more and more intensive, notably with rotation lengths
getting shorter.
High inputs of nitrogen can be brought naturally into the
ecosystem by the presence of N
2
-fixing shrubs [25]. P fertil-
ization, used in maritime pine forests due to its positive effect
on pine growth [7,24], may increase these natural inputs in two
different ways: (i) by increasing the abundance and biomass
of N
2
-fixing shrubs [3]; and (ii) by increasing the N
2
fixation
rate [1]. This second point has been mostly developed in labo-
ratory studies that suggest a P effect on N
2
fixation rate. How-
ever, these studies conflict with each others, as such an effect
is not always detected. Besides, these results appear signifi-
* Corresponding author:
cant mostly when P concentration is either very low or rather
high and thus may not be easily transposable to field condi-
tions (e.g. [1,12,17, 19]). They nevertheless show that N
2
fix-
ation is not unresponsive to phosphorus availability.
A previous study tested the field P effect on the fixation
rate of leguminous shrubs in a large forest of southwestern
France [3]. However, the requested conditions for the used
method (
15
N natural abundance method) to be properly ap-
plied were not met in the fertilized site. It was thus impossible
to address the question of the field P effect on fixation rate,
even though other P effects on fixing shrubs were quantified.
The natural abundance method also revealed to be usable on
another sites of the same area.
The objective of this study is to readdress the field P effect
on N
2
fixation rate in the same area and on the same specie,
but with a strengthened sampling scheme. It tried to use the
15
N natural abundance method on other fertilization trials than
Augusto et al. [3]. It also used the other blocks of the pre-
viously studied trial as conditions allowing or forbidding the
method are very heterogeneous even on short distances.
Article published by EDP Sciences and available at or />876 X. Cavard et al.
Tab le I. Characteristics of each site. Pines C130: Circumference at 130 cm height. Significant differences are as given by a t-test with a 5%
error threshold, and confirm the P effect on pine growth [7, 24]. 3 blocks have been sampled at Blagon and 1 for each of the other sites.
Site Pine density (stems.ha
−1
) Pines age at sampling (year) P fertilization dose (kg P
2
O
5
.ha
−1
) Pines C130 (cm)
Blagon 1530 7 0 24.9 a
80 29.0 b
160 30.7 c
240 30.7 c
Lue 1100 8 0 22.4 a
40 31.2 b
80 28.5 b
120 28.0 b
Caudos 1250 7 0 23.2 a
40 29.2 b
80 34.9 c
120 37.6 c
Clochettes 1666 8 0 34.2 a
80 38.6 b
Grand Ludee 1250 10 0 31.5 a
120 31.2 a
2. MATERIALS AND METHODS
2.1. Experimental sites (Tab. I)
The experiment took place in the “Landes” forest of southwest-
ern France (see [3] and [22] for further details). The N
2
-fixing
species studied was European gorse (Ulex europaeus L.), a legumi-
nous perennial evergreen spiny shrub found in 60% of the stands of
the forest (French Forest Survey). More details on gorse are given by
Richardson & Hill [20] and Clements et al. [8].
Five sites were selected: Lue, Caudos, Clochettes, Grand Ludee,
and Blagon, the last being the one used in the previous experiment
[3]. All the sites were maritime pines (Pinus pinaster Aït.) stands
established during triple superphosphate fertilization experiments set
up between 1994 and 1997. Two to 4 doses of phosphorus (hereafter
named Px with x = dose of P as kg P
2
O
5
.ha
−1
, P0 being the control)
were investigated in each trial (Tab. I). Maximal dose ranged from 80
to 240 kg P
2
O
5
.ha
−1
.
2.2. Theory of the
15
N natural abundance method
This method allows estimating the percentage of nitrogen derived
from the atmosphere (%Ndfa) in a N
2
-fixing plant. It is based on the
comparison of the
15
N abundance of a N
2
-fixing plant to those of a
non fixing plant [15]. The
15
N isotopic enrichment (δ
15
N) is calcu-
lated as below, defined according to the atmosphere which is consid-
ered as the standard:
δ
15
N =
[
15
N]/[
14
N]
(plant)
− [
15
N]/[
14
N]
(atm)
[
15
N]/[
14
N]
(atm)
× 1000.
Three δ
15
N are used to estimate the %Ndfa: that of the leguminous
plant studied (N
2
-fixing species, δ
15
N
leg
), that of a reference plant
(non N
2
-fixing species, δ
15
N
ref
), and that of a leguminous plant with
a %Ndfa equal to 100% (same N
2
-fixing species, δ
15
N
fix
):
%Ndfa =
(δ
15
N
ref
− δ
15
N
leg
)
(δ
15
N
ref
− δ
15
N
fix
)
× 100.
It should be noted that the δ
15
N of the bulk soil greatly differs from
the pool of nitrogen available to plant nutrition [15, 26]. Thus, us-
ing δ
15
N
soil
rather than δ
15
N
ref
would have lead to errors in %Ndfa
estimations.
The
15
N natural abundance method needs to satisfy several con-
ditions in order to be applicable: (i) a significant difference between
δ
15
N
ref
and δ
15
N
fix
must exist (ii) the reference species absorbs the
mineral nitrogen in the same soil volume and during the same peri-
ods as the N
2
-fixing species. These conditions have been previously
tested in the ‘Landes’ forest [3]. It appeared that (i) the significant
difference between δ
15
N
ref
and δ
15
N
fix
exists in some sites but not in
the northern blocks of Blagon, which forbade the authors to answer
the question of the P effect (ii) usable reference species are Erica
scoparia and Calluna vulgaris, the first being the best as its mor-
phology is closer to that of Ulex europaeus and (iii) some variability
occurred in δ
15
N
ref
at a local scale, so that there could be a significant
difference between δ
15
N
ref
and δ
15
N
fix
in other (southern) blocks of
Blagon, and/or in other sites.
2.3. δ
15
N
fix
determination
δ
15
N
fix
determination occurred in the same manner than in Au-
gusto et al. [3], but with one more sampling year (2006), resulting in
a slightly different mean δ
15
N
fix
value (–0.55% with n = 14 versus
–0.50% in [3]).
2.4. Sampling and analyses
2.4.1. N content and fixation rate determination
Lue, Caudos, Clochettes and Grand Ludee trials were sampled
in February and March 2005. Blagon was sampled in July 2005. In
Blagon, 4 treatments (0, 80, 160 and 240 kg P
2
O
5
.ha
−1
) were sampled
in the 3 southern blocks (different from those previously sampled by
[3]). For each of the 4 other sites, only one block was used per site,
with one sampling area in each treatment. The sampling areas were
located near the center of the treated plots to avoid edge effects.
P fertilization effect on N
2
fixation rate 877
0
10
20
30
40
50
60
70
80
90
100
04080120160200240
P treatment (kg P
2
O
5
.ha
-1
)
%Ndfa
LUE
CA UDOS
CLOCHETTE
GRAND LUDEE
BLAGON
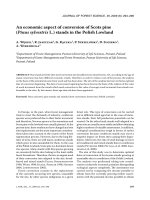
Figure 1. Average N
2
fixation rate (%Ndfa) of Ulex
europaeus according to sites and P fertilization.
In each sampling area, green twigs from 5 pairs Ulex eu-
ropaeus/reference plant (Erica scoparia or Calluna vulgaris)were
collected. Pairs were selected so that the two plants and their sizes
were as close as possible. The distance between the two plants, their
respective heights as well as the species of the reference (Erica sco-
paria or Calluna vulgaris) were systematically recorded in Blagon.
The green twigs were then dried at 65 ˚C for 48 h, coarsely ground
(Willey-ED5 grinder) then finely ground in a ball mill (Retsch PM4
planetary grinder) before N content and δ
15
N determination by spec-
trometry (‘sector field’ ICP-MS). In the previous study of Blagon,
repeats were bulked together before δ
15
N determination leading to an
unique pair of δ
15
Nvalues(δ
15
N
ref
and δ
15
N
leg
) per sampling area.
Here, all individual samples were analyzed independently.
2.4.2. Growth determination
Except in Blagon, all European gorse stems in the sampling plots
were cut and then brought to the laboratory. Stems were sorted along
diameter at 10 cm, and then 10 of them were selected according to a
systematic sub-sampling based on the frequency distribution of stem
diameters. The 5 remaining biggest stems were then added to the sub-
sample. The selected stems were cut at 10 cm shortly after sampling,
and the growth rings immediately numerized for measurement with
the ImageTool software (UTHSCSA).
2.5. Mathematical and statistical data analysis
According to Watt et al. [25], it is acceptable to calculate %Ndfa
when the difference between δ
15
N
fix
and δ
15
N
ref
is 1% or higher,
provided the soil has been homogenized by ploughing before stand
installation, which is the case on all of our sites. We therefore dis-
carded the samples who did not exhibit such a difference. We did
the same for negative values of %Ndfa, while %Ndfa values slightly
higher than 100 were assumed to be equal to 100.
Statistical analyses were performed either with the STATISTICA
software v6.0 (StatSoft Inc., 1984–2001) or with the SAS/STAT soft-
ware (SAS Institute Inc. 1999). Kruskall-Wallis ANOVA were used
to assess differences between treatments, as well as Mann-Whitney U
tests whenever ANOVA showed significant differences. Growth rings
differences between treatments were tested per year with Bonferroni
t tests. All significant differences were determined for a 5% error.
3. RESULTS AND DISCUSSION
3.1. Effect of P fertilization on gorse growth and
nitrogen concentration
Individual growth of gorse was significantly higher only for
the higher doses treatments (P80 and P120) in Caudos. A sim-
ilar effect had been previously shown in Blagon for the P160
and P240 treatments [3]. It thus seems like gorse growth is
positively affected only for very high P doses (P120 being the
maximum currently used by local foresters).
The N concentration of gorse increased gradually with P
doses (mean [N] across all sites: P0 = 11.5 ± 0.2; P40 = 11.9 ±
0.4; P80 = 12.4 ± 0.3; P120 = 12.6 ± 0.4; P160 = 13.9 ±
0.5; P240 = 14.0 ± 0.6). This result was observed in all sites
but it was significant only for the higher doses in Lue (P80
and P120) and Blagon (P160 and P240). Again, an individual
response of gorse seems to be more likely to occur for high or
very high P doses.
3.2. Ulex europaeus fixation rate (Fig. 1; Appendix I)
Augusto et al. [3] showed that most of the conditions re-
quired for use of the natural abundance method according to
Högberg [15] and Boddey et al. [5] were satisfied in our con-
text, except for the difference between δ
15
N
fix
and δ
15
N
ref
in
some cases. The same problem occurred here in a less dra-
matic manner, as the absolute difference between δ
15
N
fix
and
δ
15
N
ref
was low as well as being highly variable. However, fol-
lowing the 1% minimum difference preconized by Watt et al.
[25] we still retained a sufficient number of %Ndfa values (80
out of 120).
From the 60 %Ndfa values calculated in Blagon, 18 were
discarded (P0 = 0; P80 = 9; P160 = 1; P240 = 8). The abso-
lute differences between δ
15
N
fix
and δ
15
N
ref
were on average
1.94 ± 0.19% for Blagon. In the control treatment, where no
value was discarded, there was no significant difference among
blocks. Consequently, values of the three blocks were merged
per treatment. No significant difference was then detected be-
tween the treatments. Including the discarded values in the
data analysis did not change this result. Across all treatments,
the average value of nitrogen fixation rate was 63% with a
standard error of 4%.
878 X. Cavard et al.
Similarly, 22 %Ndfa values were discarded from the 60 cal-
culated values in the four other sites. The absolute difference
between δ
15
N
fix
and δ
15
N
ref
was on average 1.49 ± 0.99%.
We calculated the mean %Ndfa value of a sampling plot only
if at least 3 from the 5 %Ndfa values of this plot were satis-
fying the 1% difference criteria. Thus we could not calculate
the mean for the following plots: P0 and P40 of Lue, P80 and
P120 of Caudos and the P0 of Grand Ludee.
It was assumed that gorse was growing in similar conditions
in the five sites and therefore the fixation rates per treatment
were globally compared (Fig. 1). Across all sites and treat-
ments, the average nitrogen fixation rate was 70% with a stan-
dard error of 3% (standard deviation = 28%). No significant
difference was detected among the treatments of the five sites.
3.3. Relevance of the
15
N natural abundance method in
our context
Some authors such as Högberg [15] preconized a minimum
difference of 5% between δ
15
N
fix
and δ
15
N
ref
.Ourvalues
concerning the fixation rate could therefore be considered as
low confidence level results. Despite this limitation, the ab-
sence of any effect of in situ P fertilization seems quite ro-
bust, as it emerged from 80 individuals and is stable across all
sites and treatments. Because of the variability of the rejected
values, some treatment means were more reliable than others.
In Blagon, almost all the values for the P0 and P160 treat-
ments were retained and their values show reasonable stan-
dard errors as well as remarkably close means. Moreover,there
was no significant difference between %Ndfa values calcu-
lated with a difference of 3% or more between δ
15
N
fix
and
δ
15
N
ref
(%Ndfa = 79 ± 6%; n = 14) compared to those cal-
culated with less than 3% of difference (%Ndfa = 71 ± 5%;
n = 66). Finally, Danso et al. [9] showed that the reliability of
the fixation rate calculation increases with increasing rate, and
our %Ndfa values were rather high. Therefore, we assumed
that the
15
N natural abundance method gave here results with
an acceptable level of confidence.
3.4. Nitrogen fixation rate in response to P doses
No response of the N fixation rate to increasing doses of
P fertilizer was detected, whatever the site or treatment con-
sidered. While this is in contradiction with some laboratory
results [1, 12, 17, 19] which mostly showed some effect of
phosphorus on nitrogen fixation characteristics (i.e. number
and growth of nodules, nodule activity measured by acetylene
reduction assays, and fixation rate measured by
15
N isotopic
dilution), it is not very surprising. As previously stated, these
laboratory results generally showed an effect of phosphorus
when it was added in high concentrations or when it ended a
severe deprivation of this nutrient. These kind of severe con-
ditions were unlikely to happen in situ, as ecosystems are gen-
erally naturally buffered by a number of factors (e.g. soil char-
acteristics, leeching, competition ).EveniftheLandessoils
are quite poor, notably in phosphorus [22], gorse is considered
0%
10%
20%
30%
40%
50%
60%
70%
80%
90%
100%
0
50 100 150 200
P treatment (P
2
O
5
.ha
-1
)
%Ndfa
Giller et al. ([13]; Phasoleus vulgaris)
Badarneh ([4]; Lens culinaris)
Campillo et al. ([6]; Trifolium repens)
Ellabadi et al. ([10]; Medicago truncatula)
Amanuel et al. ([2]; Vicia faba)
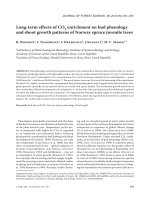
Figure 2. Nitrogen fixation rate as reported by crop studies. Closed
symbol: field experiment; open symbol: pot experiment. [4] and [2]:
means of 2 and 3 sites, respectively.
to be an oligotrophic species well adapted to these conditions
[8,20].
The N content of gorse is sometimes nevertheless higher
for high doses, and this could be interpreted as a physiologi-
cal response of gorse to high P doses which may be thought
not entirely compatible with the absence of effect on fixation
rate. We suggest two hypotheses to explain this apparent con-
tradiction (i) The individual growth increase for high doses
is responsible for a larger soil exploration as root growth is
stimulated as well as aboveground one (root/shoot ratio not
being significantly affected by fertilization: control = 0.50 ±
0.13; fertilized = 0.57 ± 0.07; Cavard and Augusto, unpub-
lished data), increasing both soil N uptake and N fixation flux
without modifying the balance between them (ii) Shadowing
due to bigger tree canopies in the fertilization treatments [23]
overbalance the potential effect on N fixation rate, as Rastetter
et al. [18] predicted a decrease in N fixation rate with decreas-
ing light availability.
Whatever the reasons may be, it nevertheless seems that for
these conditions and for the P doses likely to be used in the
field, gorse N fixation rate do not respond to P fertilization.
Even though our results may be considered as frail because
of the small differences between δ
15
N
fix
and δ
15
N
ref
,previ-
ously published results of in situ P fertilization trials of annual
crops showed very similar trends (Fig. 2; see also e.g. [14] or
[21]), which strengthen the likeliness of such a conclusion. Of
course, P fertilization could nevertheless increase total N
2
fix-
ation by increasing gorse biomass, but our results concerning
Peffect on gorse individual growth are not very conclusive
under 120 kg P
2
O
5
.ha
−1
.
Acknowledgements: We thank Sylvie Niollet, Christian Barbot and
Elise Jolicoeur for field assistance and Olivier Delfosse for his deep
implication in the isotopic analyses. We also thank Sylvain Pellerin
P fertilization effect on N
2
fixation rate 879
and anonymous reviewers for useful comments, as well as Nicole
Fenton for correcting this script. Finally, we acknowledge Pierre
Alazard (AFOCEL) and Dominique Merzeau (CPFA) for providing
all facilities during samplings.
REFERENCES
[1] Almeida J.P.F., Hartwig U.A., Frehner M., Nösberger J., Lüscher
A., Evidence that P deficiency induces N feedback regulation of
symbiotic N
2
fixation in white clover (Trifolium repens L.), J. Exp.
Bot. 51 (2000) 1289–1297.
[2] Amanuel G., Kühne R.F., Tanner D.G.,. Biological nitrogen fixation
in faba bean (Vicia faba L.) in the Ethiopian highlands as affected
by P fertilization and inoculation, Biol. Fertil. Soils 32 (2000) 353–
359.
[3] Augusto L., Crampon N., Saur E., Bakker M.R., Jordan-Meille L.,
Pellerin S., de Lavaissière C., Trichet P., High rates of N
2
-fixation
of Ulex species in the understory of Maritime pine stands (Pinus
pinaster) and potential effect of P-fertilisation, Can. J. For. Res. 35
(2005) 1183–1192.
[4] Badarneh D.M.D., Magnitude of nitrogen fixation by lentil at dif-
ferent rates of phosphorus using
15
N technique, J. Agron. Crop Sci.
175 (1995) 7–14.
[5] Boddey R.M., Peoples M.B., Palmer B., Dart P.J., Use of the
15
N
natural abundance technique to quantify biological nitrogen fixation
by woody perennials, Nutr. Cycl. Agroecosys. 57 (2000) 235–270.
[6] Campillo R., Urquiaga S., Undurraga P., Pino I., Boddey R.M.,
Strategies to optimise biological nitrogen fixation in legume/grass
pastures in the southern region of Chile, Plant Soil 273 (2005) 57–
67.
[7] Cheaïb A., Mollier A., Thunot S., Lambrot C., Pellerin S., Loustau
D., Interactive effects of phosphorus and light availability on early
growth of maritime pine seedlings, Ann. For. Sci. 62 (2005) 575–
583.
[8] Clements D.R., Peterson D., Prasad R., The biology of canadian
weeds - 112 - Ulex europaeus L., Can. J. Plant. Sci. 81 (2001) 325–
337.
[9] Danso S.K.A., Hardarson G., Zapata F., Misconceptions and prac-
tical problems in the use of
15
N soil enrichment techniques for esti-
mating N
2
fixation, Plant Soil 152 (1993) 25–52.
[10] Elabbadi K., Ismaili M., Materon L.A., Competion between
Medicago truncutula and wheat for
15
N labeled soil nitrogen and
influence of phosphorus, Soil Biol. Biochem. 28 (1996) 83–88.
[11] Fisher R.F., Binkley D., Ecology and management of forest soils,
Wiley and sons, New York, 2000.
[12] Gentili F., Huss-Danell K., Local and systemic effects of phospho-
rus and nitrogen on nodulation and nodule function in Alnus incana,
J. Exp. Bot. 54 (2003) 2757–2767.
[13] Giller K.E., Amijee F., Brodrick S.J., Edje O.T., Environmental con-
straints to nodulation and nitrogen fixation of Phaseolus v ulgaris L.
in Tanzania. II. Response to N and P fertilizers and inoculation with
Rhizobium, African Crop Sci. J. 6 (1998) 171–178.
[14] Gunawardena S.F.B.N., Danso S.K.A., Zapata F., Phosphorus re-
quirements and nitrogen accumulation by three mungbean (Vigna
radiata (L.) Welzek) cultivars, Plant Soil 147 (1992) 267–274.
[15] Högberg P.,
15
N natural abundance in soil-plant systems, New
Phytol. 137 (1997) 179–203.
[16] Laclau J.P., Ranger J., Deleporte P., Nouvellon Y., Saint-André
L., Marlet S., Bouillet J.P., Nutrient cycling in a clonal stand of
Eucalyptus and an adjacent savanna ecosystem in Congo. 3. Input-
ouput budgets and consequences for the sustainability of the plan-
tations, For. Ecol. Manage. 210 (2005) 375–391.
[17] O’Toole P., Cahalane D.G., Farrell E.P., Effects of phosphate fer-
tilizer on biomass production and N
2
(C
2
H
2
) fixation by pot-grown
Ulex gallii Planchon in a forest soil, Biol. Fertil. Soils 12 (1991)
177–181.
[18] Rastetter E.B., Vitousek P.M., Field C., Shaver G.R., Herbert D.,
Agren G.I., Resource optimization and symbiotic nitrogen fixation,
Ecosystems 4 (2001) 369–388.
[19] Ribet J., Drevon J.J., The phosphorus requirement of N2-fixing and
urea-fed Acacia mangium, New Phytol. 132 (1996) 383–390.
[20] Richardson R.G., Hill R.L., The biology of Australian weeds. 34.
Ulex europaeus L., Plant Protection Quarterly 13 (1998) 46–58.
[21] Sanginga N., Early growth and N
2
-fixation of leucaena and gliri-
cidia at different levels of phosphorus application, Fertil. Res. 31
(1992) 165–173.
[22] Trichet P., Jolivet C., Arrouays D., Loustau D., Bert D., Ranger J.,
Le maintien de la fertilité des sols forestiers landais dans le cadre de
la sylviculture intensive du pin maritime, Étude et Gestion des Sols
6 (1999) 197–214.
[23] Trichet P., Loustau D., Lambrot C., Linder S., Manipulating nutri-
ent and water availability in a maritime pine plantation: effects on
growth, production, and biomass at canopy closure, Ann. For. Sci.
64 (2007).
[24] Warren C.R., McGrath J.F., Adams M.A., Differential effects of N,
P and K on photosynthesis and partitioning of N in Pinus pinaster
needles, Ann. For. Sci. 62 (2005) 1–8.
[25] Watt M.S., Clinton P.W., Whitehead D., Richardson B., Mason
E.G., Leckie A.C., Above-ground biomass accumulation and nitro-
gen fixation of broom (Cytisus scoparius L.) growing with juvenile
Pinus radiata on a dryland site, For. Ecol. Manage. 184 (2003) 93–
104.
[26] Zeller B., Brechet C., Maurice J P., Le Tacon F.,
13
Cand
15
Niso-
topic fractionation in trees, soils and fungi in a natural forest stand
and a Norway spruce plantation, Ann. For. Sci. 64 (2007).
880 X. Cavard et al.
Appendix I. Retained δ
15
N values, with a minimum absolute difference of 1% between δ
15
N
ref
and δ
15
N
fix
(–0.55%).
Site P fertilization dose (kg P
2
O
5
.ha
−1
) δ
15
N
leg
(%) δ
15
N
ref
(%) δ
15
N
ref
–δ
15
N
fix
absolute difference (%)%Ndfa
Blagon
0
–1.4 –1.8 1.29 33
–2.5 –2.7 2.14 10
–2.5 –4.8 4.25 54
–0.2 –3.7 3.15 100
0.0 –3.7 3.11 100
0.6 –3.3 2.95 100
–1.0 –3.3 2.22 83
–1.9 –4.2 2.84 63
–1.3 –1.5 1.36 20
–0.8 –4.9 1.71 93
–1.6 –2.3 2.16 39
–1.7 –3.1 4.27 56
–1.3 –4.7 1.97 82
–2.4 –4.6 2.98 55
–2.5 –4.6 2.78 53
80
–1.0 –3.5 2.72 85
–1.1 –2.8 3.62 76
–0.9 –1.3 4.33 49
–0.8 –2.0 2.04 80
–1.6 –2.7 1.44 51
–1.3 –2.7 1.09 64
160
–0.4 –1.9 2.51 65
–1.1 –2.3 3.32 70
–2.2 –2.7 1.72 25
–1.2 –4.8 2.54 86
–1.6 –2.5 4.20 46
–0.5 –2.6 4.07 100
–1.2 –2.0 4.06 57
–1.4 –1.6 1.43 26
–1.1 –3.1 2.16 76
–1.3 –3.6 2.18 75
–1.3 –2.3 3.04 58
–1.3 –3.2 1.75 71
–0.7 –2.6 2.61 91
–1.7 –19 2.09 17
240
–0.7 –3.5 1.37 93
–0.7 –3.9 1.42 94
–1.6 –2.0 2.28 29
–0.9 –2.8 1.51 82
–1.7 –2.1 1.43 25
–0.8 –2.0 1.09 82
–1.4 –1.6 1.29 23
Lue
0
0.4 –1.8 1.25 100
0.6 1.0 1.52 25
40
1.3 –3.4 2.82 100
0.1 –1.7 1.13 100
0.0 –2.9 2.30 100
80
0.8 –1.8 1.26 100
–1.0 –2.8 2.24 82
–1.3 –2.1 1.50 52
–0.7 –2.2 1.61 90
–0.1 –1.6 1.05 100
P fertilization effect on N
2
fixation rate 881
Appendix I. Continued.
Site P fertilization dose (kg P
2
O
5
.ha
−1
) δ
15
N
leg
(%) δ
15
N
ref
(%) δ
15
N
ref
–δ
15
N
fix
absolute difference (%)%Ndfa
120
–1.7 –2.0 1.48 20
0.2 –3.0 2.41 100
–1.7 –3.1 2.54 56
–0.9 –1.9 1.34 71
–0.8 –3.5 2.94 92
Caudos
0
0.1 –2.2 1.70 100
–1.0 –1.8 1.27 61
–1.1 –2.1 1.56 63
40
–0.2 –2.2 1.64 100
–0.5 0.5 1.04 92
–0.6 0.7 1.23 100
–1.4 –1.7 1.10 27
Clochettes
0
–0.6 –4.0 3.48 98
–0.6 –3.6 3.08 99
–1.1 –1.9 1.35 57
–1.3 –2.8 2.28 67
0.4 –2.7 2.12 100
80
–1.8 –1.8 1.28 4
–0.8 –2.3 1.73 87
–0.5 –2.1 1.56 100
–0.9 –3.2 2.69 86
–0.3 –2.6 2.10 100
Grand Ludee
0 –1.0 –3.5 2.96 86
120
–1.8 –2.6 2.08 38
–2.0 –2.7 2.11 32
–2.6 –4.7 4.20 50
0.2 –2.2 1.61 100
0.9 –3.0 2.47 100