Báo cáo lâm nghiệp: "Stand structure, competition and growth of Scots pine (Pinus sylvestris L.) in a Mediterranean mountainous environment" pptx
Bạn đang xem bản rút gọn của tài liệu. Xem và tải ngay bản đầy đủ của tài liệu tại đây (146.36 KB, 6 trang )
Ann. For. Sci. 64 (2007) 825–830 Available online at:
c
INRA, EDP Sciences, 2007 www.afs-journal.org
DOI: 10.1051/forest:2007069
Original article
Stand structure, competition and growth of Scots pine
(Pinus sylvestris L.) in a Mediterranean mountainous environment
Antonio Garc
´
ia-Abril,SusanaMartin-Fern
´
andez,M.AngelesGrande,JoseA.Manzanera
*
Technical University of Madrid (UPM), Research Group for Sustainable Management, E.T.S.I. Montes, Ciudad Universitaria s.n., 28040 Madrid, Spain
(Received 19 January 2007; accepted 4 May 2007)
Abstract – The relationship between competition and tree growth was studied in four stands of Pinus sylvestris L. occurring in a continental Mediter-
ranean mountain area (in the Guadarrama range, Spain), i.e., an uneven-aged stand, a stand with oak (Quercus pyrenaica Willd.) understorey, a planta-
tion, and a mature even-aged stand. Competition was measured by a simple size-ratio distance-independent index and was negatively associated with
tree diameter. This negative association was stronger in the uneven-aged, plantation and mature even-aged stands than in the stand with oak understorey.
Competition was also negatively associated with current diameter increment. This relationship was moderately strong in the mature even-aged stand
and weak in the uneven-aged stand and the plantation. In the uneven-aged and the mature even-aged stands, a weakly significant relationship was found
between diameter growth and tree size, whereas these parameters were not associated in the stand with oak understorey. The competition index provided
a better prediction of growth rate than the alternative use of diameter. Both diameter and basal area growth were greater in the uneven-aged than in the
even-aged stands.
competition / growth / Pinus sylvestris / Scots pine / stand structure
Résumé – Structure des peuplements, compétition et croissance du pin sylvestre (Pinus sylvestris L.) dans un environnement montagneux
méditerranéen. La relation entre compétition et croissance a été étudiée dans quatre peuplements de Pinus sylvestris L. que l’on rencontre dans la
zone continentale des montagnes méditerranéennes (dans la région de Guadarrama en Espagne). Ont été pris en compte un peuplement inéquienne, un
peuplement avec du chêne (Quercus pyrenaica Willd.) en sous–étage, une plantation, et un peuplement équienne âgé. La compétition a été mesurée par
un index indépendant, simple rapport taille/distance, et était corrélée négativement avec le diamètre des arbres. Cette corrélation négative était plus forte
dans le peuplement inéquienne, la plantation et le peuplement équienne âgé que dans le peuplement avec sous-étage de chêne. L’index de compétition
était aussi corrélé négativement avec l’accroissement courant en diamètre. La relation était modérément forte dans le peuplement équienne âgé et faible
dans le peuplement inéquienne et la plantation. Dans le peuplement inéquienne et le peuplement équienne âgé une relation faiblement significative a été
trouvée entre croissance en diamètre et taille de l’arbre, alors que ces paramètres n’étaient pas corrélés dans le peuplement avec sous-étage de chêne.
L’index de compétition fournit une meilleure prédiction du taux de croissance que le simple diamètre. La croissance en diamètre et en surface terrière
était plus importante dans le peuplement inéquienne que dans le peuplement équienne âgé.
compétition / croissance / pinus sylvestris / pin sylv estre / structure de peuplement
1. INTRODUCTION
Scots pine (Pinus sylvestris L.) is one of the preferred
species for reforestation in Spain, where it occupies third place
among the native conifers (920000 ha) and yields 7% of the
total timber production. Average wood production is around 4
to5m
3
ha
−1
year
−1
, with wide site variations [4]. Such vari-
ability seems to be caused by structure, site quality, diseases
and competition [7].
Scots pine is considered a shade-intolerant species, requir-
ing much light for good development [23] and is unsuited
to uneven-aged structure in Spain, although shading by re-
tained trees can be helpful for regeneration [28], survival and
growth [24]. In areas of continental climate, however, it be-
haves as a semi-shade-tolerant species and seedlings can tol-
erate some shading. Scots pine stands may be two-storied in
sites with sufficient water supply. In some areas of Scotland,
where there is no competition from other species and natu-
* Corresponding author:
ral disasters such as forest fire are rare, regeneration in small
gaps takes place [17]. As a result, trees of different age classes
may be found simultaneously in the same stand [12]. This may
lead to a clumped spatial structure, such as that found in some
other pine species, for example Pinus ponderosa Douglas ex
Lawson & C. Lawson [8], Pinus nigra Arn. [21] or P. cem-
bra L. [24]. Currently, many forest managers actively pursue
this structural variability because of the current social pref-
erence for diversity, whether in species, tree sizes or general
stand structure [19].
There is, however, evidence that competition leads to re-
duced diameter increment in Scots pine stands [11]. Simple
size ratio competition indices, such as that of Hegyi [9], ex-
plained over 50% of the variation in radial growth in Scots
pine stands in Sweden [2].
The hypothesis of our work is that the current diameter
growth of Scots pine is affected by competition in all types of
stand structure. Therefore, the aim of this study is to charac-
terise and compare competition-growth relationships in Scots
pine stands of different structures.
Article published by EDP Sciences and available at or />826 A. García-Abril et al.
Table I. Stand area, climatic, topographic and soil type data of the four Scots pine stands studied.
Stand Stand area (ha) P (mm) PDP (mm) DD (months) Slope (%) Soil type Altitude (m)
Uneven-aged 98 1160.5 269.3 2.3 25 Haplustep 1450
With oak understorey 50 1328.5 319.3 1.9 16 Haplustep 1470
Plantation 10 1049.2 240.2 2.9 15 Haplustep 1420
Even-aged 12 1049.2 240.2 2.9 18 Haplustep 1495
P: annual precipitation; PDP: precipitation during the dry period (May–September); DD: drought duration.
2. MATERIAL AND METHODS
This study was conducted in three public forests in the Guadar-
rama mountains, located about 60 km from Madrid. There, four types
of Scots pine stand structure were studied: a mature, naturally regen-
erated even-aged stand, an uneven-aged stand, a stand with oak un-
derstorey (Quercus pyrenaica Willd.) and a plantation. All four stands
were situated at altitudes of between 1400 and 1500 m (Tab. I). Soils
are formed on siliceous substrate of granites and gneiss [5], present-
ing umbric or ochric epipedon and a deep cambic horizon. They are
classified as Haplustepts [27]. Mean annual temperature is 9.4
◦
C.
Precipitation averages 1180 mm per year (Tab. I).
All the stands were first identified by photo-interpretation, visited
by experts, and a representative area of each type of structure was
delimited. In each of these representative areas of each stand structure
two rectangular plots of 40 m by 60 m were chosen at random. In
the plantation, only one plot was chosen given the smaller area and
the greater homogeneity of the stand. Diameter at breast height (dbh,
1.3 m) and total height were measured in all trees higher than 1.3 m
inside the plots. The homogeneity between both plots was verified
and the data were merged as one sample per stand. A total of 1 209
trees were measured, 399 pine trees in the uneven-aged stand, 510
(251 oaks and 259 pine trees) in the stand with oak understorey, 170
pine trees in the plantation, and 130 pine trees in the even-aged stand.
For the variables age at breast height (1.3 m) and Current Diame-
ter Increment in the last 5, 10 and 15 years (resp., CDI5, CDI10 and
CDI15), a pilot sampling was previously carried out to keep sam-
pling costs to a minimum. The measurement of these variables was
restricted to Scots pine. Sample size for these variables was inferred
assuming a sampling error of less than 9% as an objective, leading to
a sampling size of 76 pine trees for the uneven-aged stand, 60 for the
stand with oak understorey, 67 for the plantation and 41 for the even-
aged stand. These pine trees were chosen by random sampling inside
the plots. In each of these sampled trees, a wood core was extracted at
a height of 1.3 m and annual radial increments were recorded. Also,
the radius without bark was calculated for five-year periods. Current
diameter increment (CDI) was estimated as twice the current radial
increment; that is to say, twice the mean width of the last five (CDI5),
10 (CDI10) or 15 (CDI15) rings. Current basal area increment with-
out bark was calculated as the difference between the present basal
area and that of the previous five years, divided by five. The site index
for Scots pine in the Guadarrama mountains (H
100
) was determined
with Garcia and Gomez (1984) site index curves, based on dominant
height (H
dom
), average height of the 100 tallest trees per hectare, at
100 years age. Site index was estimated for the uneven-aged stands by
deducing the mean age of the dominant trees from their wood cores
and assuming that Scots pine frequently grows in clumps or copses
of about 200 m
2
up to the age of 60 years or even more. These regen-
eration gaps behave like even-aged patches. The site index was then
inferred from the Garcia and Gomez site index curves (1984).
The effect of competition was described by Lorimer’s index [14],
as modified by Vayreda et al. [29]:
LM =
j
g
j
/g
i
Where LM is the modified Lorimer area index; g
j
is the basal area
of competitor j; j = 1, , n; n is the number of competitors within
a certain distance; g
i
is the basal area of the subject tree. Distances
between trees were calculated from relative Cartesian coordinates of
each tree on the above-mentioned plots. A program was developed to
calculate the basal area of the trees inside each neighbourhood radius
and LM indices were calculated for increasing distances, m by m,
from 1 to 10 m, and for 12.5 and 15 m.
For the variables dbh, CDI5, CDI10, CDI15 and LM indices at
distances from 1 to 15 m, the relationship between pairs of variables
was analysed, and the following regression models were fitted be-
tween each pair of variables: linear, double reciprocal, square root-Y,
square root-X, exponential, S-curve, logarithmic, inverse-Y, inverse-
X, multiplicative, logistic and log probit regression model. The model
with the best fit was selected and the R-squared statistic was calcu-
lated for each model and stand.
3. RESULTS
Dominant height and stand density parameters are shown
in Table II. Tables III to VI display the statistically significant
R-squared (p-value < 0.01 for the hypothesis that R-squared
= 0) between variables studied in the different stands. Age,
height and diameter variables were strongly associated in both
the uneven-aged stand and the stand with oak understorey,
while these variables were only moderately associated in the
plantation (data not shown). A range of ages was found in the
plantation, as some retained trees were interspersed and natu-
ral regeneration from these older trees may have taken place.
In the mature even-aged stand, dbh and height were strongly
associated but the association between height and age was
weaker, as all trees in this stand were from the dominant layer
and variability was lower (data not shown).
Competition (LM index) was negatively associated with
dbh in all stands, the effect being more pronounced at dif-
ferent distances among stands. In the uneven-aged stand, the
R-squared was higher for 6 m distances or higher (more than
0.93 for dbh, Tab. III). In the stand with oak understorey, these
relationships were stronger at neighbourhood radii of 10 m up-
wards, and ranging from a low R-squared of 0.06 for 1 m to an
R-squared of 0.96 for 15 m (Tab. IV). In the plantation, dbh
was strongly associated with competition at a distance of 6 m
or more (R-squared > 0.8, Tab. V). In the mature even-aged
stand (Tab. VI), dbh was strongly associated with competition,
Competition and growth in Scots pine stands 827
Table II. Dominant height (H
dom
: mean height of the 100 highest trees per ha), site index (H
100
= H
dom
at 100 years age, [6]), mean age of the
dominant trees, Stem number per ha (N), mean distance between trees (MDBT = 100 N
−1/2
) in m, Relative Spacing (RS = 100 (H
dom
× N
1/2
)
−1
)
and basal area (g) in m
2
ha
−1
of four Scots pine stand structures located in the Guadarrama mountains.
Stand H
dom
(m) H
100
(m) Mean dominant age (yr) N (Stem No. ha
−1
) MDBT (m) RS g(m
2
ha
−1
)
Uneven-aged 21 23 91 965 3.2 0.15 34.9
With oak understorey 19 17 124 1400
∗
2.7 0.15 32.9
#
Plantation 22 29 64 703 3.8 0.17 59.0
Mature even-aged 24 25 98 315 5.6 0.23 55.4
* N includes 581 pines and 819 oaks ha
−1
; # basal area (g) of oaks was 0.93 m
2
ha
−1
.
Table III. Statistically significant relationships between diameter at breast height (dbh), current diameter increment of the last 5 (CDI5), 10
(CDI10) and 15 (CDI15) years and modified Lorimer’s area indices for distances of 1 (LM1), 2 (LM2), 3 (LM3), 4 (LM4), 5 (LM5), 6 (LM6),
7 (LM7), 8 (LM8), 9 (LM9), 10 (LM10), 12.5 (LM12.5), and 15 (LM15) m in the uneven-aged stand.
CDI5 CDI10 CDI15 LM1 LM2 LM3 LM4 LM5 LM6 LM7 LM8 LM9 LM10 LM12.5 LM15
dbh R-squared 0.13 0.17 0.18 0.17 0.42 0.58 0.53 0.68 0.94 0.96 0.97 0.98 0.99 0.99 0.99
p-value 0.0001 0.0002 0.0002 < 0.0001 < 0.0001 < 0.0001 < 0.0001 < 0.0001 < 0.0001 < 0.0001 < 0.0001 < 0.0001 < 0.0001 < 0.0001 < 0.0001
CDI5 R-squared 0.13 0.12 0.13 0.16 0.31 0.29 0.34 0.31 0.28
p-value 0.004 0.007 0.008 0.005 0.0001 0.0004 0.0002 0.002 0.008
CDI10 R-squared 0.14 0.12 0.15 0.14 0.22 0.20 0.21
p-value 0.0026 0.006 0.005 0.008 0.002 0.004 0.005
CDI15 R-squared 0.15 0.15 0.19 0.21 0.24 0.24 0.25 0.23
p-value 0.002 0.003 0.001 0.001 0.001 0.002 0.002 0.007
Tab le IV . Statistically significant relationships between diameter at breast height (dbh), current diameter increment of the last five years (CDI5),
and modified Lorimer’s area indices for distances of 1 (LM1), 2 (LM2), 3 (LM3), 4 (LM4), 5 (LM5), 6 (LM6), 7 (LM7), 8 (LM8), 9 (LM9),
10 (LM10), 12.5 (LM12.5), and 15 (LM15) m in the stand with oak understorey.
LM1 LM2 LM3 LM4 LM5 LM6 LM7 LM8 LM9 LM10 LM12.5 LM15
dbh R-squared 0.06 0.11 0.16 0.36 0.40 0.46 0.54 0.56 0.60 0.88 0.94 0.96
p-value 0.0005 < 0.0001 < 0.0001 < 0.0001 < 0.0001 < 0.0001 < 0.0001 < 0.0001 < 0.0001 < 0.0001 < 0.0001 < 0.0001
CDI5 R-squared 0.62
p-value 0.0013
Tab le V . Statistically significant relationships between diameter at breast height (dbh), current diameter increment of the last 5 (CDI5), 10
(CDI10) and 15 (CDI15) years and modified Lorimer’s area indices for distances of 1 (LM1), 2 (LM2), 3 (LM3), 4 (LM4), 5 (LM5), 6 (LM6),
7 (LM7), 8 (LM8), 9 (LM9), 10 (LM10), 12.5 (LM12.5), and 15 (LM15) m in the plantation stand.
CDI10 CDI15 LM1 LM2 LM3 LM4 LM5 LM6 LM7 LM8 LM9 LM10 LM12.5 LM15
dbh R-squared 0.10 0.19 0.12 0.43 0.50 0.47 0.75 0.83 0.89 0.93 0.94 0.93 0.97 0.99
p-value 0.008 0.0002 < 0.0001 < 0.0001 < 0.0001 < 0.0001 < 0.0001 < 0.0001 < 0.0001 < 0.0001 < 0.0001 < 0.0001 < 0.0001 < 0.0001
CDI10 R-squared 0.14
p-value 0.006
CDI15 R-squared 0.15 0.24 0.18 0.20 0.26 0.20
p-value 0.003 0.0003 0.003 0.002 0.0006 0.0067
Tab le VI. Statistically significant relationships between diameter at breast height (dbh), current diameter increment of the last 5 (CDI5), 10
(CDI10) and 15 (CDI15) years and modified Lorimer’s area indices for distances of 2 (LM2), 3 (LM3), 4 (LM4), 5 (LM5), 6 (LM6), 7 (LM7),
8 (LM8), 9 (LM9), 10 (LM10), 12.5 (LM12.5), and 15 (LM15) m in the mature even-aged stand.
CDI5 CDI10 CDI15 LM2 LM3 LM4 LM5 LM6 LM7 LM8 LM9 LM10 LM12.5 LM15
dbh R-squared 0.22 0.25 0.34 0.34 0.28 0.38 0.67 0.82 0.89 0.88 0.91 0.90 0.95 0.99
p-value 0.0029 0.0011 0.0001 < 0.0001 < 0.0001 < 0.0001 < 0.0001 < 0.0001 < 0.0001 < 0.0001 < 0.0001 < 0.0001 < 0.0001 < 0.0001
CDI5 R-squared 0.27 0.32 0.36 0.34 0.36 0.55 0.55
p-value 0.0044 0.0029 0.002 0.005 0.0086 0.0011 0.0015
CDI10 R-squared 0.36 0.35 0.31 0.45 0.55 0.51 0.54 0.61 0.59
p-value 0.0004 0.0006 0.0022 0.0002 0.0001 0.0003 0.0006 0.0004 0.0008
CDI15 R-squared 0.44 0.44 0.43 0.53 0.61 0.58 0.61 0.63 0.61
p-value 0.0001 0.0001 0.0002 < 0.0001 < 0.0001 0.0001 0.0001 0.0003 0.0006
828 A. García-Abril et al.
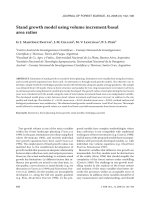
Lorimer Competition Index for 7m
Current Diam. Incr._ last 15 years
0 20406080
0
2
4
6
8
Uneven-aged
Even-aged
Plantation
Uneven-aged data
* Mature even-aged data
Plantation data
Stand Regression model R-squared p
Uneven-aged CDI15 = 1/(0.290963 + 0.00113927 × LM7) 0.24 0.0015
Mature even-aged CDI15 = 1/(0.399624 + 0.0112507 × LM7) 0.57 0.0001
Plantation CDI15 = 1/(0.596557 + 0.014697 × LM7) 0.20 0.0067
Figure 1. Adjusted regression models between the current diameter increment of the last 15 years (mm year
−1
) and the modified Lorimer’s
competition index at a distance of 7 m of the uneven-aged, mature even-aged and plantation stands. The real values in the scatter plot are
represented by squares () in the uneven-aged stand, stars (*) in the mature even-aged stand, and diamonds (♦) in the plantation.
with stronger coefficients for distances of 6 m or more (R-
squaredupto0.99).
In the stand with oak understorey, no significant rela-
tionship was found between growth and size of pine trees
(Tab. IV). In contrast, both in the uneven-aged and the ma-
ture even-aged stands, growth was significantly associated, al-
though weakly, with size (Tabs. III and VI). In the planta-
tion, only CDI10 and CDI15 were weakly associated with dbh
(Tab. V).
Current diameter increment of the last 5, 10 and 15 years
was negatively associated with the LM index for distances up
to 10 m in the uneven-aged stand; a small amount of variation
was explained by the model (R-squaredupto0.34forCDI5at
8 m distance, Tab. III). No significant relationship was found
between diameter growth and competition indices for longer
distances. Similar results were obtained in the mature even-
aged stand, with moderately stronger associations (R-squared
up to 0.63 for CDI15 and LM9, Tab. VI). Competition indices
up to a distance of 7 m were also significantly associated in
the plantation with CDI15 (R-squared 0.26 for a 6 m distance,
Tab. V), while CDI10 was only weakly associated with LM3
(Tab. V). In contrast, growth showed no significant relation-
ship with competition in the stand with oak understorey, ex-
cept for CDI5 and LM12.5 (Tab. IV).
Regression models adjusted between current diameter in-
crement (CDI) and competition index (LM) were compared
for the uneven-aged, the even-aged and the plantation stands,
i.e., CDI15 vs. LM7 (Fig. 1). The stand with oak understorey
had no significant model to be compared with other stands and
was not included. In all cases, CDI of the uneven-aged stand
is greater than that of the plantation and the even-aged stand.
The same is true for the growth (i.e., CDI10) vs. dbh model
(Fig. 2). Furthermore, the estimated stand-level basal area in-
crement of the uneven-aged stand is greater than that of all the
other stands (Tab. VII), although the basal area in the uneven-
aged stand is lower than in the plantation and the mature even-
aged stand (Tab. II).
4. DISCUSSION
Climate and site conditions of all four stands were similar
(Tab. I), although site index (H
100
)differences were observed
between stands (Tab. II). This may influence growth, along
with other forestry-related factors such as stand structure and
competition. In other species, a relationship has been found
between the radial increment of the stem and the site index
[3,18,22]. Specifically, H
100
of the stand with oak understorey
was lower than H
100
of the other stands, but dominant trees
were also older than those in the other stands; this suggests a
potential problem with the site index curves, the age measure-
ment, or an interaction with the oak understorey.
As expected, a significantly negative relationship between
competition and size was observed in all the stands. However,
growth was in general weakly associated to size, with dif-
ferent patterns between the stands. The growth of larger and
taller trees was faster in the uneven-aged stand, the plantation
and the mature even-aged stand. This behaviour may be inter-
preted as a search for light and dominance by the larger trees
following an asymmetric competition pattern [26]. In contrast,
in the stand with oak understorey, growth was not associated
with size. This may be attributed either to senescence of the
larger pine trees or to symmetric competition, i.e., the effect of
competition is the same on older, larger trees as on younger,
smaller trees [26]. In this type of competition, the oak under-
storey may have played a role.
Competition and growth in Scots pine stands 829
dbh
Current Diam. Incr._ last 10 years
020406080
0
2
4
6
8
Plantation
Even-aged
Uneven-aged
Uneven-aged data
* Mature even-aged data
Plantation data
Stand Regression model R-squared p
Uneven-aged CDI10 = exp(1.26553 – 3.83567/dbh) 0.17 0.0002
Mature even-aged CDI10 = 1/(0.305529 + 7.29771/dbh) 0.25 0.0011
Plantation CDI10 = 1/(0.443136 + 12.7741/dbh) 0.10 0.008
Figure 2. Adjusted regression models between the current diameter increment of the last 10 years (mm year
−1
) and the diameter at breast height
(dbh, cm) of the uneven-aged, mature even-aged and plantation stands. The real values in the scatter plot are represented by squares ()inthe
uneven-aged stand, stars (*) in the mature even-aged stand, and diamonds (♦) in the plantation.
Table VII. Current basal area increment without bark (m
2
ha
−1
year
−1
) in four stand structures. Current basal area increment was calculated as
the difference between the present basal area and that of the previous five years, divided by five.
Stand structure Current basal area increment (m
2
ha
−1
year
−1
)
Diameter class (cm)
< 10 cm 10.1–20 20.1–30 30.1–40 40.1–50 50.1–60 > 60 cm TOTAL
Uneven-aged 0.09 0.11 0.08 0.12 0.19 0.08 0.01 0.68
With oak understorey 0.02 0.03 0.06 0.07 0.10 0.05 0.33
Plantation 0.01 0.17 0.26 0.13 0.57
Mature even-aged 0.00 0.02 0.05 0.08 0.13 0.07 0.35
Lorimer [14] reported that for predicting growth in natu-
ral even-aged hardwood stands distance-dependent measures
of competition are not superior to distance-independent mea-
sures. Most of the comparisons between distance-dependent
and distance-independent individual tree growth models do
not report the expected differences in prediction ability [25].
Martin and Ek [16] also found the same result in uniform red
pine plantations, concluding that distance-independent com-
petition indices are more accurate for diameter growth pro-
jections in managed plantations, where location is of lesser
importance. Vayreda et al. [29] compared several competition
indices in two Scots pine stands in relation to the radial growth
in the last five years and found that the modified Lorimer index
performed better than all other indices tested. It is notewor-
thy that the Hegyi index, which takes into account distance to
competitors, was no better than the modified Lorimer index,
which does not include distance in its formula. Simple size
ratio indices performed as well or better in their correlation
with annual diameter growth than more complex indices, such
as space, area overlap, and root/crown indices [10]. In con-
trast, Biging and Dobbertin [1, 2] obtained better results with
estimated crown parameters. Our results show that the modi-
fied Lorimer index provides a substantially better prediction of
growth rate than the alternative size parameters, such as dbh, in
all the stand structures studied, especially in the mature even-
aged stand.
The negative relationship between CDI and the LM index
in all stands except for that with oak understorey may be inter-
preted as a hint of the negative effect of competition on growth
when stand density is very high. At present, the low values of
this relationship suggest that stand density is not so high as
to cause serious growth limitation. The neighbourhood radius
for maximum significant influence of competition on diame-
ter growth was 8 m in the uneven-aged stand and 10 m in the
mature even-aged stand. No relationship was found between
CDI5 and LM indices in the plantation, as a result of thinning
during the last 10 years in this stand. In contrast, competition
influenced Scots pine stem growth in other situations [15].
In our study, we observed a greater diameter growth in the
uneven-aged stand than that in the mature even-aged stand and
830 A. García-Abril et al.
the plantation for the same competition index. This result must
be viewed with caution, given the small sample size. Neverthe-
less, other authors have reported that multiaged stands main-
tain comparable levels of timber productivity over time with
even-aged stands [19], and Lähde et al. [13] observed higher
productivity for uneven-sized stands of Scots pine in Finland.
O’Hara and Nagel [20] also found that uneven-aged ponderosa
pine stands were more efficient structures for maximizing the
reception of sunlight than even-aged stands where the level
of competition for available light and moisture was higher. In
fact, even-aged stands had lower soil moisture availability per
transpiration rate and a greater amount of water stress, which
limits gas exchange and photosynthesis more than in multi-
aged structures [20].
5. CONCLUSIONS
The relationship between current diameter growth and com-
petition was characterised in four stand structures of Scots
pine, and an analysis was made of the variables influencing
this relationship in a mountain area with a continental Mediter-
ranean climate, i.e., in the Guadarrama range (Spain). The
modified Lorimer competition index was successfully used
to predict growth rate in both uneven-aged and even-aged
stands. Taking into account the limited number of stands stud-
ied, no general conclusions can be drawn from the effect of
stand structure on growth. Nevertheless, our results suggested
a greater diameter and basal area growth of Scots pine in the
uneven-aged stand than in the even-aged stand and the plan-
tation. Additional research using this kind of approach might
be warranted, and the effects on stand-level volume increment
might also be considered. At densities that do not limit di-
ameter growth, the uneven-aged stand maintains a continuous
cover, a microclimate and is compatible with sustainable pro-
duction. The conservation of a continuous cover and an irregu-
lar structure by means of moderate wood extractions for short
periods is advisable for protection of the ecosystem and for
aesthetic or social purposes.
Acknowledgements: This research work was supported by the D.G.
de Investigación, Consejería de Educación y Cultura de la Comu-
nidad de Madrid (project GR/AMB/0267/2004). We also thank Luis
Orofino, Pablo Orofino, Jaime Hernandez, Alvaro Sanchez, Maria Es-
tirado, Alvaro Ruiz, Elena Sanchez, Tania Lopez, Tania Caballero
and Vanesa Jalvo for their assistance in field work and data pro-
cessing, and to Pru Brooke-Turner for the linguistic revision of the
manuscript.
REFERENCES
[1] Biging G.S., Dobbertin M., A comparison of distance-dependent
competition measures of height and basal area growth of individual
conifer trees, For. Sci. 38 (1992) 695–720.
[2] Biging G.S., Dobbertin M., Evaluation of competition indices in
individual tree growth models, For. Sci. 41 (1995) 360–377.
[3] Castedo-Dorado F., Dieguez-Aranda U., Alvarez-Gonzalez J.G., A
growth model for Pinus radiata D. Don stands in northwestern
Spain, Ann. For. Sci. 64 (2007) 609–619.
[4] Diéguez-Aranda U., Álvarez-González J.G., Barrio-Anta M., Rojo-
Alboreca A., Site quality equations for Pinus sylvestris L. planta-
tions in Galicia (northwestern Spain), Ann. For. Sci. 62 (2005) 143–
152.
[5] Gandullo J.M., Nicolas A., Ecología de los pinares españoles.
Ministerio de agricultura, I.F.I.E., Madrid, 1969.
[6] Garcia-Abejon J.L., Gomez-Loranca J.A., Tablas de producción de
densidad variable para Pinus sylvestris L. en el Sistema Central,
INIA, Madrid, 1984.
[7] Gonzalez S.C., Bravo F., Inventario y descripción de la regeneración
natural. Aplicación a grupos ordenados de pino silvestre (Pinus
sylvestris L.) del Alto Ebro (Burgos), Montes 50 (1997) 21–28.
[8] Harrod R.J., McRae B.H., Hartl W.E., Historical stand reconstruc-
tion in ponderosa pine forests to guide silvicultural prescriptions,
For. Ecol. Manage. 114 (1999) 433–446.
[9] Hegyi F., A simulation model for managing jack-pine stands, in:
Fries J. (Ed.), Growth model for tree and stand simulation, Royal
Coll. For., Stockholm, Sweden, 1974, pp. 74–90.
[10] Holmes M.J., Reed D.D., Competition indices for mixed species
Northern hardwoods, For. Sci. 37 (1991) 1338–1349.
[11] Jäghagen K., Albrektson A., Induced competition among Scots pine
seedlings and its effect on future timber quality, New For. 12 (1996)
163–174.
[12] Kuper J.H., Sustainable development of pine forests, Misc. Papers
Wageningen University, 1994.
[13] Lähde E., Laiho O., Norokorpi Y., Saksa T. Structure and yield
of all-sized Scots pine dominated stands, Ann. Sci. For. 51 (1994)
111–120.
[14] Lorimer C.G., Test of age-independent competition indices for in-
dividual trees in natural hardwood stands, For. Ecol. Manage. 6
(1983) 343–360.
[15] Mäkinen H., Effect of intertree competition on biomass produc-
tion of Pinus sylvestris (L.) half-sib families, For. Ecol. Manage.
86 (1996) 105–112.
[16] Martin G.L., Ek A.R., A comparison of competition measures and
growth models for predicting plantation red pine diameter and
height growth, For. Sci. 300 (1984) 731–743.
[17] Nixon C.J., Composition, structure and regeneration of tree species
within Scotland’s native pinewoods, in: Olsthoorn A.F.M. (Ed.),
Management of mixed-species forests: silviculture and economics,
IBN Scientific Contributions 15, IBN-DLO, Wageningen, 1999, pp.
191–198.
[18] Nutto L., Spathelf P., Rogers R., Managing diameter growth and
natural pruning of Parana pine, Araucaria angustifolia (Bert.) O
Ktze., to produce high value timber, Ann. For. Sci. 62 (2005) 163–
173.
[19] O’Hara K.L., The Silviculture of transformation – a commentary,
For. Ecol. Manage. 151 (2001) 81–86.
[20] O’Hara K.L., Nagel L.M., A functional comparison of productivity
in even-aged and multiaged stands: a synthesis for Pinus ponderosa,
For. Sci. 52 (2006) 290–303.
[21] Oldeman R.A.A., Forests: Elements of silvology, Springer,
Heidelberg, 1990.
[22] Sanchez-Gonzalez M., Tomé M., Montero G., Modelling height and
diameter growth of dominant cork oak trees in Spain, Ann. For. Sci.
62 (2005) 633–643.
[23] Schütz J.P., Sylviculture 1. Principles d’éducation des forêts,
Presses Polytechniques et Universitaires Romandes, Lausanne,
1990.
[24] Schütz J.P., Sylviculture 2. La gestion des forêts irrégulières et
mélangées, Presses Polytechniques et Universitaires Romandes,
Lausanne, 1997.
[25] Soares P., Tomé M., Distance-dependent competition measures for
eucalyptus plantations in Portugal, Ann. For. Sci. 56 (1999) 307–
319.
[26] Stoll P., Weiner J., Schmid B., Growth variation in a naturally estab-
lished population of Pinus sylvestris, Ecology 75 (1994) 660–670.
[27] USDA, Keys to soil taxonomy, 8th ed. 1998.
[28] Valkonen S., Effect of retained Scots pine trees on regeneration,
growth, form, and yield of forest stands, Investigación Agraria:
Sistemas y Recursos Forestales: Fuera de serie 1 (2000) 121–145.
[29] Vayreda J., Burriel J.A., Raventos J., Gracia C., Variabilidad en el
crecimiento de Pinus sylvestris en función de su edad y tamaño y
de la competencia local, Studia Oecologica 10/11 (1994) 373–384.