Báo cáo khoa học: "Pharmacokinetics, tissue residue and plasma protein binding of ofloxacin in goats" pps
Bạn đang xem bản rút gọn của tài liệu. Xem và tải ngay bản đầy đủ của tài liệu tại đây (144.18 KB, 5 trang )
-2851$/ 2)
9H W H U L Q D U \
6FLHQFH
J. Vet. Sci.
(2004),
/
5
(2), 97–101
Pharmacokinetics, tissue residue and plasma protein binding of
ofloxacin in goats
Himangshu Baruah*, Dulal Chandra Roy, Rohini Kumar Roy, Hirendra Nath Khonikor
Department of Pharmacology and Toxicology, College of Veterinary Science, Assam Agricultural University,
Guwahati 781022, Assam, India
Ofloxacin was administered to six male goats intravenously
(5 mg/kg) to determine its kinetic behavior, tissue residue, in
vitro plasma protein binding and to compute a rational
dosage regimen. The concentration of ofloxacin in plasma
and tissue samples collected at prescheduled time were
estimated by using HPLC. The pharmacokinetic parameters
were determined by non-compartmental model and plasma
protein binding was estimated by equilibrium dialysis
technique. The therapeutic concentration (
≥
0.5
µ
g/ml) was
maintained up to 36 h and the initial concentration at
2.5 min (14.76 ± 0.47
µ
g/ml) declined to 0.05 ± 0.03
µ
g/ml at
96 h with a secondary peak (0.64 ± 0.15
µ
g/ml) at 24 h. The
mean AUC, AUMC, t
1/2,
MRT, Cl and V
d
were calculated to be
58.94 ± 19.43
µ
g · h/ml, 1539.57 ± 724.69
µ
g·h
2
/ml, 15.58 ±
1.87 h, 22.46 ± 2.71 h, 135.60 ± 31.12 ml/h/kg and 2.85 ± 0.74
L/kg respectively. Significantly high concentration of drug
was detected in different tissues after 24 h of intravenous
dosing of 5 mg/kg, at 24 h interval for 5 days. The
in vitro
plasma protein binding of ofloxacin was found to be
15.28 ± 0.94%. Based on these kinetic parameters, a loading
dose of 5 mg/kg followed by the maintenance dose of 3 mg/kg
at 24 h dosing interval by intravenous route is recommended.
Key words:
Pharmacokinetics, Ofloxacin, dosage, goats
Introduction
One of the ominous trend in the field of antimicrobial
therapy over the past decades has been the increasing pace
of development of antimicrobial resistance in bacterial
pathogens and emergence of new resistant strains.
Fluoroquinolones have emerged as a novel class of
antimicrobial agents against some troublesome resistant
pathogens. Ofloxacin, a new generation fluroquinolone,
have broad spectrum of activity against variety of gram
positive and gram negative bacteria and some anaerobes
[13]. Pharmacokinetic studies of ofloxacin have been
reported in dog [19], rabbit [12], mice [4], rat [6], chicken
[9], and human [7]. Detailed pharmocokinetic data of this
antimicrobial agent is lacking in goat. Therefore, the
objective of the present study was to investigate the
pharmacokinetic pattern, tissue residue and plasma protein
binding of the drug following single intravenous
administration in goat. The pharmacokinetic data obtained
was applied for computing optimal dosage regimen, which
will promote rational use of the drug in this species, while
reducing the risk of drug related toxicity.
Materials and Methods
Animals
The study was conducted on six clinically healthy male
goats (
Capra hircus
) of Assam of age between 8-18 months
old and weighing 10-16 kg. The animals were kept for 2
weeks before commencement of the experiment for
acclimatization. During the experimental period the animals
were maintained on concentrate feed and free grazing.
Water was provided
ad libitum
.
Drugs
The pure standard of ofloxacin and injectable commercial
preparation, Zanocin infusion (200 mg/100 ml of distilled
water) was manufactured by Ranbaxy Laboratories Ltd.,
India. The drug was administered by intravenous
administration into the jugular vein with 5 mg/kg body weight.
Financial support from Assam Agricultural University as research grant
is thankfully acknowledged.
*Corresponding author
Present address: Himangshu Baruah, Cattle Remedies India Limited. F-
12, Adrashani Plaza, 91- Adchini, Sri Aurobindo Marg, New Delhi-
110017, India.
E-mail:
Permanent Address: Dr. Himangshu Baruah. C/o Dr. Jagadish Baruah.
Shrimantapur,(Near Hotel Utopia) Guwahati-7810032, Assam, India.
E-mail:
98 Himangshu Baruah
et al.
For tissue residue study, ofloxacin (5 mg/kg body weight)
was administered intravenously at 24 h interval for 5
consecutive days.
Sample collection
Blood sample (3 ml) were collected into heparinized test
tubes by jugular venipuncture. The samples prior to and
after administration of the drugs were collected at 0, 2.5, 5,
10, 20, 30, 45, 60 (1 h), 90 (1.5 h), 120 (2 h), 180 (3 h), 240
(4 h), 360 (6 h), 480 (8 h), 600 (10 h), 720 (12 h), 1440 (24
h), 2160 (36 h), 2880 (48 h), 4320 (72 h) and 5760 (96 h)
min. Plasma was harvested by centrifugation at 3000 rpm
for 15 min and stored at
−
20
o
C until assayed for ofloxacin.
For studying tissue residue, four animals were sacrificed by
decapitation after the last dose a 5 days dosing schedule and
a representative sample (1 g) of different tissues viz. liver,
kidney, heart, lung, brain, fat and skeletal muscle were
collected. Tissues were accurately weighed, cut into small
pieces, homogenized with normal saline solution and stored
at 20
o
C until analyzed.
In vitro
plasma binding was determined by equilibrium
dialysis technique [8]. Plasma concentration of ofloxacin,
i.e. 1.25, 2.5, and 5
µ
g/ml was dialyzed ( pore size 4
o
A) for
24 hours at 37
o
C with phosphate buffer (0.2 M; pH 7.4).
Analytical method
For quantitative determination of ofloxacin in plasma, the
HPLC method of Teja-Isavadharm
et al.
[17] was followed
with some modification.
The analysis for ofloxacin in plasma was performed on a
HPLC system (Perkin Elmer, USA) consisting of a binary
LC pump, a diode arry detector, a LC-100 laboratory
computing integrator and a
µ
Bondapac C
18
column (Waters,
USA, 30 mm
×
3.9 mm ID and 10
µ
m particle size).
The mobile phase consist of 0.1 M phosphoric acid
(adjusted to pH 2.5 with a solution of 45% potassium
hydroxide) and acetonitrile mixed in a ratio of 75 : 25 (v/v).
The flow rate of mobile phase was 1.2 ml/min and the eluent
was monitored in Diode arry detector. The chromatogram
were integrated on the LC-100 laboratory computing
integrator.
Plasma samples were subjected to liquid-phase extraction.
To 1 ml of plasma, 1 ml of methanol was added mixed by
vortexing for 20 seconds and then placed on ice for 15 min
to enhance precipitation. It was centrifuged at 15,600 g for
10 min and the supernatant (750
µ
l) was transferred to
another tube. Dichloromethane (6 ml) was added and the
content were mixed by vortexing for 20 seconds followed by
centrifugation at 1000 g for 10 min. The organic and
aqueous phase formed were separated by using phase-
separator filter paper. After discarding the aqueous phase,
the organic phase was transferred to a clean siliconized tube
and evaporated to dryness at 40
o
C. The residue was then
reconstituted in mobile phase (500
µ
l) and was injected into
column.
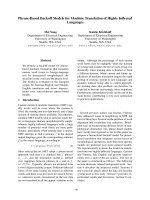
The standard curve was prepared by spiking blank plasma
with standard parent compound at different concentration
ranging from 0.025 to 20
µ
g/ml and extracted by liquid
phase extraction as described above. The plasma
concentration of ofloxacin in the samples were determined
by comparing the detector response for the drug in the
sample with the corresponding standards (Fig. 1).
The homogenized tissue samples were subjected to liquid
phase extraction and estimated by using chromatographic
conditions as described above for plasma samples.
Ofloxacin concentrations in the tissue samples were
determined by comparing with the corresponding tissue
standards.
Extraction recovery was determined by comparing the
peak area of an extracted spiked sample with the peak area
of direct injection of the mobile phase containing same
concentration of pure drug. The extraction recovery and
limit of quantification of ofloxacin in plasma was found to
be 99.2% and 0.01 mg/L
respectively. The extraction
recovery and the limit of quantification for all the tissue was
near 100 % and 10
µ
g/ml respectively.
Pharmacokinetic analysis
The concentration of ofloxacin in plasma were plotted on
a semi-logarithmic scale as a function of time and the
pharmacokinetic parameters were calculated for each
animal by using statistical moments approach [11]. The
dosage regimen was computed by the method of Wartak
[18] and Benet
et. al
. [2]. To maintain the desired therapeutic
concentration in plasma, the loading or priming and
maintenance doses at suitable dosing interval were
calculated by using the following formulae:
Maintenance dose =
Css V
×
T
×
F
1.44
×
t
1
2
⁄
×
-
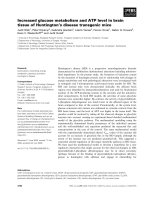
F
ig. 1.
Representative chromatograms of ofloxacin in goat plasma
.
Pharmacokinetics of ofloxacin 99
Loading dose =
Where,
Css = Average steady state plasma concentration.
V = Apparent volume of distribution.
T = Dosing interval.
F = Bioavailability.
t
1/2
= Half-life.
K = Overall elimination rate constant.
Results
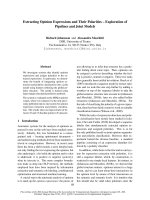
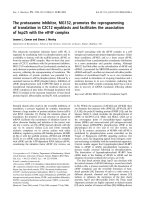
Plasma concentration of ofloxacin at various time
intervals following single intravenous administration (5 mg/
kg) are given in Table 1 and its semilogarithimic graphical
representation is presented in Fig. 2. The mean plasma
concentration at 2.5 min was 14.76
±
0.47
µ
g/ml which
declined to 0.50
±
0.03
µ
g/ml at 96 h with a secondary peak
of 0.64
±
0.15
µ
g/ml at 24 h. The therapeutic concentration
(
≥
0.5
µ
g/ml) was maintained up to 36 h post-administration
of the drug. The values of various pharmacokinetic
parameters are presented in Table 2. The concentration of
ofloxacin in different tissues were found to be in the order of
liver > kidney > lung > skeletal muscle > heart > fat > brain
(Table 3). The percent plasma protein binding of ofloxacin
at different plasma concentrations of 1.25, 2.5 and 5
µ
g/ml
are to the extent of 26.78
±
1.51, 10.14
±
0.27 and 8.92
±
1.06% respectively, with an overall mean of 15.28
±
0.94%
(Table 4).
Discussion
Following single intravenous administration, ofloxacin
Maintence dose
1e
KT–
–
Table 1. Plasma concentration of ofloxacin (µg/ml) in goats
following a single intravenous dose of 5 mg/kg body weight (n = 6 ).
Time after ofloxacin
Administration (min)
Mean ± SE Range
2.5 14.76 ± 0.470 12.21 - 19.88
5 10.30 ± 0.05007.15 - 15.64
10 9.03 ± 0.42 04.97 - 12.73
20 7.48 ± 0.34 04.12 - 10.08
30 6.56 ± 0.28 4.41 - 8.58
45 4.79 ± 0.30 2.24 - 6.75
60 (1 h) 5.32 ± 0.26 2.40 - 6.84
90 (1.5 h) 4.95 ± 0.28 1.81 - 6.50
120 (2 h) 3.94 ± 0.25 1.99 - 5.61
180 (3 h) 2.92 ± 0.42 0.19 - 6.87
240 (4 h) 1.71 ± 0.24 0.16 - 4.41
360 (6 h) 0.94 ± 0.17 0.13 - 2.91
480 (8 h) 0.87 ± 0.15 0.07 - 2.59
600 (10 h) 0.62 ± 0.14 0.03 - 2.32
720 (12 h) 0.53 ± 0.13 0.02 - 2.14
1440 (24 h) 0.64 ± 0.15 0.05 - 2.31
2160 (36 h) 0.62 ± 0.14 0.06 - 2.04
2880 (48 h) 0.44 ± 0.07 0.09 - 1.21
4320 (72 h) 0.35 ± 0.03 0.11 - 0.99
5760 (96 h) 0.05 ± 0.03 00.02 - 0.19*
*n = 4, Not detected in two animals.
Table 2. Pharmacokinetic determinants of ofloxacin in goats following single intravenous dose of 5 mg/kg body weight (n = 6)
PK
Determinants
Unit G
1
G
2
G
3
G
4
G
5
G
6
Mean ± SE
AUC µg · h/ml 71.91 18.73 158.59 44.17 29.24 30.99 058.94 ± 19.43
AUMC µg·h
2
/ml 2163.9 460.72 4904.72 738.7 1556.04 413.25 1539.57 ± 724.69
MRT h 30.09 24.81 30.98 16.73 19.02 13.34 22.46 ± 2.71
t
1/2
h 20.85 17.20 21.81 11.59 13.18 9.24 15.58 ± 1.87
K h
−1
0.03 0.04 0.03 0.06 0.05 0.07 00.05 ± 0.01
Cl ml/h/kg 69.53 266.98 31.53 113.21 171.01 161.35 135.60 ± 31.12
V
d
L/kg 2.11 6.67 0.99 1.92 3.23 2.18 02.85 ± 0.74
V
dss
L/kg 2.09 6.62 0.98 1.89 3.25 2.15 02.83 ± 0.74
G
1
-G
6
= Number of goats.
AUC = Total area under the plasma concentration versus time curve; AUMC = Area under the first moment curve; MRT = Mean residence time; t
1/2
=
Elimination half life; K = Apparent overall first order elimination rate constant; Cl = Total body clearance; V
d
= Apparent volume of distribution; V
dss
=
Steady state volume of distribution.
F
ig. 2. Graphical representation of maen pasmaconcentration
of
o
floxacin following single I.V. dose of 5 mg/Kg body weight.
100 Himangshu Baruah
et al.
was detected in plasma up to 96 h and the mean plasma-
ofloxacin concentration time profile showed a secondary
peak (0.64
±
0.15
µ
g/ml) at 24 h. The appearance of the
secondary peak seems to be due to enterohepatic circulation
of the drug. The enterohepatic circulation of the drug that is
extensively cleared by into the bile may produce secondary
peak in plasma level time profile [1]. Similar time course of
ofloxacin (5 mg/kg) was reported in sheep [16].The analysis
of the semi-logarithmic plasma-ofloxacin time profile curve
revealed that it could best be analyzed by non-
compartmental model. More and more investigators and
clinicians who use pharmacokinetic are turning to non-
compartmental approaches, since pharmacokinetic analysis
based on compartmental models can lead to un-reconcilable
difficulties.
The therapeutic concentration of ofloxacin (MIC
90
≥
0.5
µ
g/ml) was maintained up to 36 h, which is reflected by
larger values of elimination half-life (15.58
±
1.87 h) and its
analogous parameter, MRT (22.46
±
2.71 h). A relatively
shorter half-life has been reported in man (5.4 h) [3], rabbit
(1.5-1.9 h) [12] and in chicken (4.82 h) [9]. The longer
residence of the drug in the body was further supported by
high value of AUC (58.94
±
19.43
µ
g · h/ml) and low
clearance rate Cl (135.60
±
31.12 ml/h/kg). Enterohepatic
recycling is often associated with multiple peaks and a
longer apparent half-life in a plasma concentration-time
profile [15]. The reported AUC of ofloxacin in rabbit [12],
human [3], sheep [16] and in chicken [9] have been 37.09,
14.0, 418.40 and 47.08
µ
g · h/ml respectively. The mean
volume of distribution (V
d
) of ofloxacin in the present study
was found to be 2.85
±
0.74 L/kg indicating wide tissue
distribution. The reported values of V
d
in man [10] and in
sheep [16] have been 2.4 3.5 L/kg and 1.61 L/kg respectively.
In tissue residue study, high concentration of ofloxacin
was detected in liver (3.96
±
0.92
µ
g/g), kidney (2.75
±
0.67
µ
g/g), lung (1.95
±
0.23
µ
g/g) and in skeletal muscles (1.54
±
0.09
µ
g/g) as compared to heart (0.59
±
0.05
µ
g/g), fat
(0.52
±
0.16
µ
g/g) and brain (0.43
±
0.19
µ
g/g). In human
volunteers, high concentration of ofloxacin was reported to
be achieved in liver, gall bladder, muscle (about 1.4 times
higher), while in subcutaneous fat and in skin it was 50% or
less than that of serum. Result of the
in-vitro
plasma protein
binding showed low protein binding (15.28
±
0.94%),
suggesting that conditions which alter protein binding would
not influence the drugs pharmacokinetics. Ofloxacin has
been reported to be about 20 % bound to serum in man [14].
Based on the pharmacokinetic parameters obtained in the
present study, the dosage regimen of ofloxacin at 24 h
interval was computed for intravenous administration in
goat. An initial loading dose of 5 mg/kg followed by
maintenance dose of 3 mg/kg at 24 h dosing interval is
recommended. The suggested dosage regimen is expected to
maintain the desired therapeutic concentration of the drug (
≥
0.5
µ
g/ml) in plasma for the treatment of diseases caused by
susceptible bacteria. The dosage will maintain the steady
state concentration of the drug in the range of 1.5
µ
g/ml (C
ss max
)
and 0.5
µ
g/ml (C
ss min
) with an average C
ss
of 1
µ
g/ml
between the dosing interval.
Acknowledgments
We are grateful to Dr.S.K. Dutta, Deputy Director and Mr.
G.C. Deka, Senior Scientific officer, Forensic Science
Laboratory, Guwahati, Assam, India for their technical
support. We thank Dr. Puneet Agarwal, Technical Manager,
Animal Health division, Ranbaxy Laboratories Ltd., New
Delhi for providing necessary drugs.
Table 3. Ofloxacin concentration (µg/g) in different tissues after 24 h of intravenous dosing of 5 mg/kg body weight, at 24 h interval for
5 days (n = 4)
Tissues
Concentration of ofloxacin in tissues (µg/g)
Mean ± SE
I II III IV
Liver 4.01 4.81 1.01 6.01 3.96 ± 0.92
Kidney 3.26 3.34 0.48 3.91 2.75 ± 0.67
Lung 1.38 2.16 1.65 2.59 1.95 ± 0.23
Skeletal muscle 1.52 1.26 1.65 2.59 1.54 ± 0.09
Heart 0.47 0.58 0.72 0.57 0.59 ± 0.05
Fat 0.46 0.99 0.08 0.56 0.52 ± 0.16
Brain 0.10 1.05 0.46 0.12 0.43 ± 0.19
Table 4.
In Vitro
plasma protein binding of ofloxacin in goat
Ofloxacin
Concentration in
plasma (µg/ml)
Percent protein binding
Mean ± SE
I II III
1.25 31.51 26.35 22.48 26.78±1.51
2.50 10.12 09.33 10.97 10.14±0.27
500. 08.09 08.30 10.37 8.920±1.06
Overall mean = 15.28
±
0.94
Pharmacokinetics of ofloxacin 101
References
1. Baggot JD. Gastrointestinal absorption and the
bioavailability of drugs. In: Anderson NV (ed.). Veterinary
Gastroenterology. pp. 292-310, Lea & Febiger, Philadelphia,
1980.
2. Benet LZ, Kroetz DL, Sheiner LB. Pharmacokinetics: The
dynamics of drug absorption, distribution, and elimination.
In: Hardman JG, Limbird LE, Molinoff PB, Ruddon RW,
Gillman AG (eds.). Goodman & Gilman’s The Pharmacological
Basis of Therapeatics, 9th ed. pp. 3-26, McGraw Hill, New
York, 1996.
3. Farinotti R, Trouvin JH, Bocquet V, Vermeric N, Carbon
C. Pharmacokinetics of ofloxacin after single and multiple
intravenous infusion in healthy subject. Antimicrob Agents
Chemother 1998, 32, 1590-1592.
4. Fu KP, Hilliard J, Isaacson D, Tobia AJ.
In vitro
evaluation
of ofloxacin in
Salmonella typhimurium
infection in mice. J
Antimicrob Chemother 1990, 25, 263-268.
5. Gibaldi M. Biopharmaceutics and Clinical Pharmacokinetics.
3rd ed., pp. 20, Lea & Febiger, Philadelphia, 1984.
6. Katagiri Y, Naora K, Ichikawa N, Hayshibara M,
Iwamoto K. Absence of pharmacokinetic interaction
between ofloxacin and fenbufen in rats. J Pharmacol Toxicol
1998, 41, 717-797.
7. Kawakami J, Yamamoto K, Sawada Y, Iga T. Prediction of
brain delivery of ofloxacin, a new quinolone, in the human
from animal data. J Pharmacokinet Biopharm 1994, 22, 207-
227.
8. Kunin CM, Darubush J, Finland M. Distribution and
excretion of four tetracycline analogues in normal young
men. J Clin Invest 1995, 38, 1950-1963.
9. Liu Y, Fung KF. Pharmacokinetic studies of ofloxacin in
healthy and diseased chicken infected with
Mycoplasma
gallinarum
and
E. coli
. J Vet Pharmacol Ther 1997, 20, 21-
86.
10. Lode H, Kirch A, Olschewski P, Sievers H, Hoffken G.
Pharmacokinetics of paranteral ofloxacin in volunteers
(abstract). 26th Interscience Conference on Antimicrobial
Agents and Chemotherapy, New Orleans, 1986.
11. Malik JK. (ed.). Recent approach in clinical
pharmacokinetics and therapeutic monitoring of drugs in
farm animals. ICAR short course, Division of Pharmacology
& Toxicology, IVRI, Izatnagar, India, Oct 25th~ Nov. 3rd,
pp. 36-40, 1999.
12. Marangos MN, Zhu Z, Nicolus DP, Klepser ME,
Nightingle CH. Disposition of ofloxacin in female
Newzeland white rabbits. J Vet Pharmacol Ther 1997, 20, 17-
20.
13. Monk JP, Campoli-Richards DM. Ofloxacin: A review of
its antibacterial activity, pharmacokinetic properties and
therapeutic use. Drugs 1987, 33, 346-391.
14. Nomura H, Tsumura M, Tachizawa H, Kamiya A,
Okumura K. Quantative investigation on renal handling of
ofloxacin in man. In Mitsuhaski and Daiks (eds.), Ofloxacin:
A new quinolones antibacterial agent. Proceedings of a
workshop held at the 14th International Congress of
Chemotherapy, pp. 57-63, University of Tokyo Press, 1985.
15. Roberts MS, Magnusson BM, Burczynski FJ, Weiss M.
Enterohepatic circulation: physiological, pharmacokinetic
and clinical implications. Clin Pharmacokinet. 2002, 41, 751-
790.
16. Takawale PS, Garg SK, Shah MA Ayub. Pharmacokinetics
of ofloxacin following a single intravenous injection in rams.
Compendium of abstracts of 1st Annual Conference of
Indian Society of Veterinary Pharmacology and Toxicology
and National Symposium on newer perspective of Veterinary
Pharmacology and Toxicology in the improvement of animal
health and production. Dec 6-8, pp. 63, 2000.
17. Teja-Isavadharm P, Keratithalkul D, Watt G, Webster
HK, Edstein MD. Measurement of ciprofloxacin in human
plasma, whole blood and erythrocytes by high performance
liquid chromatography. Therap Drug Monitoring 1991, 13,
263-267.
18. Wartak J. Clinical Pharmacokinetics: A Modern Approach
to Individual drug therapy, pp. 153-161, Praeger Publishers,
New York, 1983.
19. Yoshida K, Yabe K, Nishida S, Yamamoto N, Ohshima C,
Ckiguchi M, Yamada K, Furuhama K. Pharmacokinetic
disposition and arthopathic potential of oral ofloxacin in
dogs. J Vet Parmacol Ther 1998, 21, 128-132.