Báo cáo khoa học: " Echocardiography and electrocardiography as means to evaluate potential performance in horses" docx
Bạn đang xem bản rút gọn của tài liệu. Xem và tải ngay bản đầy đủ của tài liệu tại đây (1.27 MB, 4 trang )
-2851$/ 2)
9H W H U L Q D U \
6FLHQFH
J. Vet. Sci.
(2004),
/
5
(3), 259–262
Short Communication
Echocardiography and electrocardiography as means to evaluate potential
performance in horses
Carlos Lightowler
1
, Giuseppe Piccione
2,
*, Elisabetta Giudice
3
, Gerardo Romei del Olmo
1
,
Maria Laura Cattáneo
3
1
Departamento de Medicina, Faculty of Veterinary Sciences, University of Buenos Aires, 1427-Buenos Aires, Argentina
2
Dipartimento di Morfologia, Biochimica, Fisiologia e Produzioni animali, Faculty of Veterinary Medicine, University of Messina,
98168-Messina, Italia
3
Dipartimento di Scienze Mediche veterinarie, Faculty of Veterinary Medicine, University of Messina, 98168-Messina, Italia
4
Departamento de Medicina Preventivay Salud Pùblica, Faculty of Veterinary Sciences, University of Buenos Aires, 1427-Buenos
Aires, Argentina
Prediction of potential performance is one of the goals
of exercise physiology investigations. When Selecting a
horse for competition, one of the main objectives is to
choose the one that predictably will reveal a competitive
aptitude above the average. The horses used in this study
underwent a two-dimensional echocardiography study
and a conventional 3 leads electrocardiogram. The results
show that heart score is not an appropriate index to
evaluate the heart size in the horse. On the other hand,
there are currently more suitable and accurate procedures
such as echocardiography that allow performing a clear
anatomical evaluation and accurate measurement in
order to calculate LVMM and to predict performance.
Key words:
echocardiography, electrocardiography, left ven-
tricular myocardial mass, heart score, performance, horse
When selecting a horse for competition, one of the main
objectives is to choose the one that predictably will reveal a
competitive aptitude above the average. In the past several
approaches have been performed to succeed in this kind of
selection, since the future yield of the horse is ignored when
the selection is carried out. In 1963 Steel [1]
established a
relationship between some electrocardiographic values and
heart weight in horses. This was confirmed to be statistically
significant. More recently, the same author gained evidence
of statistically significant correlation between the same
electrocardiographic values and the total amount of prices
won in races [2]. The mean value of QRS interval, measured
in msec using the standard three bipolar leads recording,
outlined the strongest correlation with the heart weight.
Relying upon these data, he established the “Heart Score”
concept (HS) suggesting that this index would allow
inferring the heart size. Since a large heart size is a useful
characteristic for excellent competition achievements, the
HS is reckoned to be a valuable indicator of potential
performance. The publication and diffusion of this concept
raised an up to date controversy, among those considering
this index and its related results adequate for predicting the
best performers [3,4,5] and those stating that the average
duration of QRS interval HS is not a valid indicator of
potential performance [6,7,8,9], whereas its feasibility
makes this technique very appealing. In horses, earlier
studies emphasized a tight correlation between body weight
(BW), body surface area (BSA) and left ventricular
myocardial mass (LVMM) measured by means of a guided
M-Mode echocardiography [10]. If HS is related to the heart
weight and LVMM correlates strongly with BW, it is
reasonable to think that, being heart weight similar to
myocardial mass, HS should correlate in a statistically
significant way with LVMM and BW. Other investigations
have also demonstrated a genetically determined breed
relationship between body weight and heart weight [11].
The QRS interval (intraventricular conduction time)
represents the time required for the electric wave to spread
and depolarize the ventricular mass. Hence, as the
ventricular muscular mass increases, a longer time will be
necessary for the ventricular depolarization to take place.
This has been clearly demonstrated [12]. On the basis of the
abovementioned arguments and to assess whether the HS is
a suitable index of potential performance, the objective of
our study was to investigate the occurrence of a statistically
significant correlation between HS and LVMM and between
HS and body weight in horses.
Forty-eight thoroughbreds and half-bred thoroughbred
race horses, aged between 17 and 25 months, males and
females, were used. They were cardiologically healthy, as
*Corresponding author
Tel: +3990357221; Fax: +3990356951
E-mail:
260 Carlos Lightowler
et al.
confirmed by a clinical evaluation, a routine echocardiography
and an electrocardiography examination.
All horses underwent a two-dimensional echocardiographic
study and a conventional 3 leads electrocardiogram (bipolar
standard). The echocardiographic study was carried out by
means of a Kontron equipment (model Sigma Iris 440),
specifically equipped with a 3,5 MHz dual mechanical-
sector transducer, and an Esaote Biomedica equipment
(model Caris) featuring a phase-array multifrequency
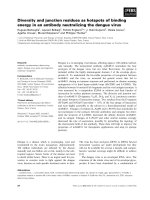
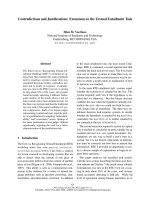
transducer. In order to calculate LVMM, measurements
were carried out by means of M-Mode guided images
captured from the right parasternal window, in short axis, at
the
chordae tendinae
level (Fig. 1).The Left Ventricular
Diastolic Diameter (LVDD), the Diastolic Thickness of the
Interventricular Septum (DTIS) and the Diastolic Thickness
of the Left Ventricular Wall (DTLVW) were also recorded.
For the determination of the Left Ventricular Myocardial
Mass (LVMM) the following formula was applied: 1,5
( D T IS + DT LV W + LVD D )
3
- (LVDD)
3
. For all measurements
obtained values correspond to the mean values of six
recordings made in by different echotomograms. Measurements
diverging more than 12% were discarded. For the
electrocardiographic recording, the principles recommended
by Steel and col
3
were followed. A Cardio Técnica, dual RG-
201 electrocardiograph model, was used. The sensitivity
was set at 1 cm = 1 mV and paper speed at 25 mm/sec.
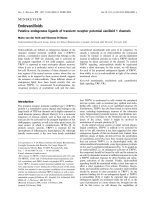
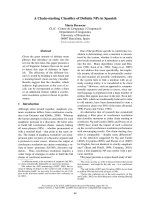
“HS” was obtained by calculating the mean value of the
QRS interval recorded by means of the three standard
bipolar leads (LI, LII and LIII). QRS interval value for each
lead, taken into account for the final calculation, was the
average of 10 recordings, each of them carried out in a
different ventricular complex (Fig. 2).
All horses were weighted on a special scale with a proven
error of ± 2 kilograms with the used value corresponding to
the average of three serial weights. The statistical study
featured the analysis of the linear correlation between body
weight and the heart score and between left ventricular
myocardial mass and the heart score.
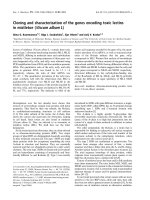
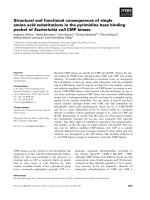
1-For the body weight vs. the heart score variable:
coefficient of Pearson = 0,1315 (P-value 0,5497). The result
indicates no statistically significant correlation. Also, the
variables do not show linear regression and the graphic
representation of the obtained values does not show a
tendency toward a non linear regression either (Fig. 3).
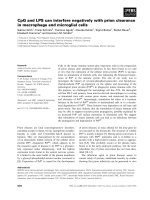
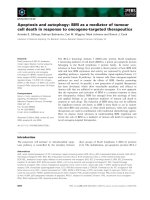
2-For the left ventricular myocardial mass vs. the heart
score variable: coefficient of Pearson = 0,0705 (P-valued
0,7482). The result indicates no statistically significant
correlation. The variables do not show either a linear
regression or a tendency toward non-linear regression (Fig. 4).
F
ig. 1.
Right parasternal window. Image captured in order to inf
er
t
he measurements to calculate LVMM. Left: 2D view in short ax
is,
a
t the chordae tendineae level. Right: guided M-Mode view.
F
ig. 2.
Electrocardiogram traces from leads I, II and III. T
he
a
rrows show the beginning and end points of the QRS complexe
s.
Echocardiography and electrocardiography in horses 261
In order to understand these results, a few concepts should
be summarized:
1) It is acknowledged that there is a relationship between
heart sizes and body weight (BW). This varies according to
the race and it is genetically determined [9].
2) This relationship can be clinically evaluated by an
echocardiographic measurement of the left ventricular
myocardial mass (LVMM). The latter correlates strongly
with body weight [10].
3) The LVMM is a proportional part of heart size and
therefore of the heart weight.
4) The value of the QRS interval depends on the amount
of muscular tissue run through by the electric wave.
Bearing in mind what previously reported, what follows
arise as a logical consequence:
1-LVMM represents a percentage of the heart weight.
Given that QRS interval value depends upon the amount of
muscular tissue undergoing depolarization, hence both
variables should correlate each other in a statistically
significant way.
2-According to Steel studies, QRS interval value
correlates strongly with the heart weight. LVMM, which is a
proportion of the heart weight, correlates strongly with the
body weight. Consequently the QRS interval should
correlate with the body weight. Regarding the obtained
results, it is clear that HS shows a relationship neither with
the body weight nor with LVMM, as determined by
echocardiography. Hence its value does not correlate with
the heart size and it cannot be regarded as a suitable index
for predicting potential performance. The lack of correlation
between BW and HS and between LVMM and HS observed
in this study can be explained by the following arguments.
First, the results and the statement resulting from Steel [1]
paper are erroneous.
The questionable topics of the paper are:
a) the size of the sample (n = 34);
b) sex, race, body weight and other important factors were
not taken into account in his study;
c) the effects of training on the heart were not considered.
They wanted to determine the heart size modifications due
to genetic background but not due to entrainment while it is
known that exercise modifies the size and weight of the
heart.
d) the influence, on heart weight and electrocardiogram,
of potential specific pathologies affecting the chosen
sample, was not adequately investigated. Furthermore an
intrinsic error in carrying out the measurements can be
found. This is important in view of the narrow magnitude of
the QRS interval values. These values are very small with a
tight range of variation. Thus when measurements are
carried out, errors may become significant. In the horse, the
extreme values of the QRS interval range between 0,08 and
0,17 seconds. The average value of the QRS interval is 0,125
seconds while LVMM mean value is 3.200 g. Hence 100 g
of left ventricle cardiac muscle are depolarized within
0,00391 seconds.
Steel established that a paper speed of 25 mm/sec was
adequate for the measurement of the QRS interval [3]. With
the paper speed set at as above, each mm corresponds to
0,04 seconds. Carrying out the measurements with
appropriate magnification and minimizing the variations of
the line thickness, it is unlikely to accomplish accurate
measurements. Also these recordings are inadequate to infer
heart weight. As a logical consequence, if 100 g of cardiac
muscle are depolarized within 0,00391 seconds and this
time is recorded in 0.098 mm of paper, it is easy to observe
as a small measurement error (or a paper dragging
mechanics flaw) can increase or diminish the heart weight in
a significant way. Tolerating a 10% error for the
measurement of the QRS interval, a value of 0,108 mm
would be obtained. This corresponds to 110,20 g of cardiac
muscle instead of the previously mentioned 100 g, thus
artificially reducing the heart weight in a 326,4 g value. The
third explanation is related to the peculiarity of ventricular
depolarization in the horse. The concept of “wave front”,
valid for the rest of the mammals, it does not apply to hoofed
species. In the horse, the beginning and the end of the QRS
interval does not necessarily correspond to the beginning
and the end of the ventricular depolarization. Due to the
particular distribution of the Purkinje net in the ventricular
F
ig. 3.
Graphic representation of the obtained values (Hea
rt
S
core
vs
LVMM).
F
ig. 4.
Graphic representation of the obtained values (Hea
rt
S
core
vs
Body Weight).
262 Carlos Lightowler
et al.
cardiac muscle of the horse, a certain amount of the electric
potential output during the ventricular depolarization is lost
thus not showing manifest electric superficial phenomena.
There is a chance that, at least in the final part of the PQ
interval and/or in the initial part of the ST interval, the
ventricular depolarization could start and continue with
currents that conceal each other, without manifestations in
the surface recording. In this context, the concept that the
duration of the ventricular depolarization develops entirely
within the QRS interval could prove not to be valid for the
horse. In this way an unknown amount of electricity (and
therefore of muscle weight) could be lost and not
represented in the inscription time of the QRS interval. In
this way, a horse with a 0,10 sec Heart Score can have a
bigger heart than another featuring a 0,12 sec value, since
electricity gets covered to a larger extent and a bigger
proportion of muscle is hidden. It has been demonstrated
that the QRS interval value rises with the increasing mass of
heart muscle as a result of hypertrophy (physiologic or
pathologic)
[12,14,15]. However, it should be kept in mind
that it only shows that cardiac mass has increased but it does
not quantify such growth. Opposite deductions can be drawn
when LVMM is calculated through echocardiography. If
measurements are carried out appropriately, the results are
exacts and reliable. For this reason echocardiography is a
valuable instrument for the assessment of potential
performance. It is important to underline that in order to
validate LVMM as a tool for predicting potential
performance, this index should only be evaluated in fully-
grown and untrained horses. On this basis, the obtained
value corresponds to the genetically determined heart size
that is the only value suitable for selecting horses for future
performance. The obtained results show that HS is not an
appropriate index to evaluate the heart size in the horse and
that it should not be considered as a tool for assessing
potential performance. On the other hand, there are currently
more suitable and accurate instruments such as
echocardiography that allow performing of a clear
anatomical evaluation and accurate measurements in order
to calculate LVMM [10].
References
1. Steel JD. Studies on the electrocardiogram of the racehorse.
The electrocardiogram in relation heart weight, pp. 41-42,
Australasian Medical Publishing Company, Sydney, 1963.
2. Steel JD. Studies on the electrocardiogram of the racehorse.
The electrocardiogram in relation to the racing performance.
pp. 42-46, Australasian Medical Publishing Company,
Sydney, 1963.
3. Steel JD, Stewart GA. Electrocardiography of the horse and
potential performance ability. J S Afr Vet Assoc 1974, 45,
263-268.
4. Stewart GA. The use of electrocardiography to estimate
heart weight and predict performance in racehorse. Aust Vet J
1980, 56, 558-559.
5. Nielsen K, Vibe-Petersen G. Relationship between QRS-
duration (heart score) and racing performance in trotters.
Equine Vet J 1980, 12, 81-84.
6. Gross DR, Muir WW, Pipers FS, Hamlin RL.
Reevaluation of the equine heart score. Southwest Vet 1974,
52, 231-233.
7. Leadon DP, Cunningham EP, Mahon GA, Todd AJ. Heart
score and performance ability in the United Kindom. Equine
Vet J 1982, 14, 80-90.
8. Moodie EW, Sheard RP. The use of electrocardiography to
estimate heart weight and predict performance in the
racehorse. Aust Vet J 1980, 56, 557-558.
9. Kline H, Foreman JH. Heart and spleen weights as a
function of breed and somatotype. In: Persson S, Lindholm
A, Jeffcott LB (eds.). Equine Exercise Physiology 3, pp. 17-
21, Davis, California, 1991.
10. Lightowler CH, Pidal G, Mercado MC, Cattaneo ML.
The left ventricular mass measurement through guided M-
Mode echocardiography in the horse. In: Lindner A (ed.).
The Elite Show Jumper, pp. 149-153, Conference on Equine
Sports Medicine and Science, 2000.
11. O’Callaghan MW. Comparison of echocardiographic and
autopsy measurements of cardiac dimensions in the horse.
Equine Vet J 1985, 17, 361-368.
12. Patteson M. Cardiac anatomy and physiology. In: Patteson
M (ed.). Equine Cardiology, pp. 1-26, Blackwell Science,
London, 1996.
13. Piccione G, Fazio F, Giudice E. Cardiac parameters of the
evaluation of performance in the athlete horse. In: Lindner A
(ed.). The Elite Show Jumper, pp. 161-164, Conference on
Equine Sports Medicine and Science, 2000.
14. Attanzio G, Piccione G, Assenza A, Caola G. Heart score
and blood lactate in the evaluation of the athletic
performance in endurance horses, pp. 58-59, SiSVet Annual
Meeting Abstracts, 2001.