Báo cáo khoa học: "Effect of probiotic containing Saccharomyces boulardii on experimental ochratoxicosis in broilers: hematobiochemical studies" pptx
Bạn đang xem bản rút gọn của tài liệu. Xem và tải ngay bản đầy đủ của tài liệu tại đây (228.28 KB, 9 trang )
-2851$/ 2)
9H W H U L Q D U \
6FLHQFH
J. Vet. Sci.
(2004),
/
5
(4), 359–367
Effect of probiotic containing
Saccharomyces boulardii
on experimental
ochratoxicosis in broilers: hematobiochemical studies
S. B. Agawane*, P. S. Lonkar
Department of Pathology, Bombay Veterinary College, Mumbai, India
In the present investigation, the toxicopathological
effects of ochratoxin A of 0.5 ppm on hematobiochemical
parameters of broilers were studied with efficacy of
dietary concentration of probiotic containing yeast culture
Saccharomyces boulardii
of 10 mg/kg of feed. One
hundred twenty day old chicks were randomly divided
into four groups, thirty chicks each. Groups A and C
chicks were offered normal feed and that added with
probiotic
Saccharomyces boulardii
respectively. The birds
in group B were fed ochratoxin A of 0.5 ppm of feed.
Where as, the birds of group D, were fed with ochratoxin
A of 0.5 ppm along with probiotic
Saccharomyces boulardii
of 10 mg/kg of diet. Hematological studies carried
revealed significant decrease in the haemoglobin and
packed cell volume in birds of group B and reduced effect
in birds of group D due to probiotic. Biochemical profiles
revealed significant improvement in probiotic treated
group D when compared with decreased values of Total
protein, albumin, globulin and increased levels of serum
creatinine and SGPT in birds of groups B.
Key words:
Saccharomyces boulardii,
ochratoxin A, hemato-
logical, biochemical
Introduction
In India, poultry industry has developed leaps and bound
from a small-scale backyard venture to the status of full-
fledged, modernized, agro-based industry. India ranks 4th in
egg production and 19th in broiler production with annual
turnover of Rs. 65 billion [5]. One of the most effective ways
for a profitable poultry industry is to reduce the input cost.
Feed is the major input in poultry production constituting
70-75% of total cost of broiler production. Poor quality or
damaged feed may results in poor production and discarding
of such feed will be additional monetary loss.
The mycotoxins are considered as serious obstacle in
realizing the full genetic potential of the poultry. Several
species of fungi infect grain and forage crops growing in the
field, during harvest, transportation and while in the storage
and produces mycotoxins. More than 300 different types of
mycotoxins have been identified and many more are
undiscovered. One species of mould can produce different
mycotoxins. Conversely, different moulds can produce the
same mycotoxin [11]. Among the mycotoxins, ochratoxin
and aflatoxin occupy important position in causing
mycotoxicosis in poultry.
Reports on ochratoxicosis are frequent in India and it is
understood as an emerging problem for human, livestock
and poultry, requiring proper attention [7,9]. Ochratoxicosis
decrease the profitability in poultry industry by decreasing
growth rate, egg production and increasing susceptibility to
diseases. Several methods have been tried in past to detoxify
the feed ingredients from toxic fungal metabolites, [16].
This includes physical, chemical, nutritional and biological
methods. Advances made in the field of biotechnology, in
last decades, have resulted in development of newer
strategies for tackling the problem of mycotoxins [1,12,19]
Practical and cost effective methods to prevent ochratoxicosis
in poultry field are in great demand.
Studies indicate that
Saccharomyces boulardii
is effective
against ochratoxicosis in poultry [3,4]. The same was tried
against ochratoxin A to ascertain its efficiency in reducing
its adverse effect in broilers.
Materials and Methods
The present research work was conducted at Department
of Pathology, Bombay Veterinary College, Parel, Mumbai,
India.
Production of Ochratoxin
Source of organism:
Aspergillus ochraceus
NRRL 3147
culture maintained at the Department of Pathology, Nagpur
Veterinary College, Nagpur, India was used as source.
Procedure of ochratoxin production:
Ochratoxin was
produced on broken wheat by using
Aspergillus ochraceus
*Corresponding author
Tel: +40-24021024; Fax: +40-24169246
E-mail:
360 Agawane S. B., Lonkar P. S.
NRRL 3147 culture as suggested by Trenk
et al
. [22].
Overnight soaked broken wheat (50 g + 25 ml tap water)
was autoclaved at 121
o
C for 20 minutes and inoculated with
fungal spore suspension. The inoculum was incubated for 12
days at room temperature in dark place with vigorous
shaking once a day to break the brown mycelial mass. By
using sterile wireloop, the mycelial growth from flask was
collected and inoculated on SDA (Sabraoud Agar) plate for
isolation and identification of
Aspergillus ochraceus.
Colonies of
Aspergillus ochraceus
were observed on SDA
plate. Staining with lactophenol cotton blue stain did
microscopic examination. The fermented wheat was
autoclaved to kill the spores and dried at 80
0
C in hot air
oven, overnight. The dried material was powdered and
stored in the dark place for further use.
Quantification of Ochratoxin: The representative
samples of feed were analyzed for the quantification of
ochratoxin A, by thin layer chromatography (TLC) [2].
Procedure
Steps of quantification of ochratoxin A are as follows
1. Collect 40 - 50 gram broken wheat (sample) in beaker.
2. Add 10 gram cellite, 2 gram NaCl, 110 ml methanol
and 90 ml distil water in it.
3. Shake it for half an hour.
4. Filtrate it through Whatman filter paper No.1.
5. Collect 50 ml filtrate.
6. Put it in separating funnel.
7. Add 50 ml hexane in it.
8. Shake it for five minutes in separating funnel.
9. After shaking collect the lower feed sample layer in
beaker.
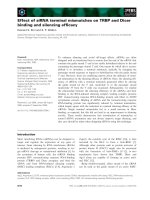
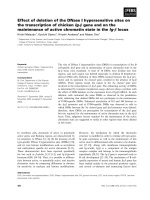
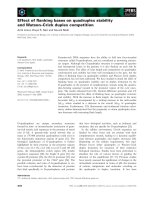
Table 1.
Haemoglobin concentration (%) of different groups at different periods
Week of experiment
Sr. No.
2nd week 4th week 6th week
ABCDABCDABCD
1 10.4 6.5 8.6 7.2 10.2 6.4 8.6 8.3 9.8 6.0 10.5 6.0
2 7.2 7.0 8.4 6.4 9.7 7.5 8.7 8.7 10.5 8.0 9.2 11.0
3 8.6 6.2 9.4 7.8 9.2 9.6 8.4 8.3 10.8 6.5 9.0 6.0
4 8.7 7.0 10.0 7.4 8.5 7.6 8.7 7.5 9.6 5.0 8.5 6.5
5 8.7 7.4 9.0 7.0 10.5 6.6 9.2 8.3 10.0 6.3 10.0 7.3
6 10.5 6.4 8.4 7.0 9.6 7.5 8.7 9.0 10.6 6.3 10.6 7.3
Mean 9.02
a
6.75
a
8.97
b
7.13
a
9.62
c
7.53
a
8.72
b
8.35
ab
10.22
b
6.35
a
9.63
b
7.35
a
S.E. ±0.500.180.260.190.290.460.100.200.190.390.350.76
Means with at lest one common superscript do not differ significantly, *- Significant at 5 %, N.S Non Significant.
Analysis of variance:
Week of
experiment
Source
Sum of
square
Degree of
freedom
Mean sum of
square
F-calculated
C.D. value at
5% level
2nd
Treatment 25.66333 3 8.554444 14.31706*
Error 11.95 20 0.5975
Total 37.61333 23 1.4
4th
Treatment 13.43458 3 4.478194 8.44544*
Error 10.605 20 0.53025
Total 24.03958 23 0.87
6th
Treatment 60.75458 3 20.25153 14.8626* 1.4
Error 27.25167 20 1.362583
Total 88.00625 23
F
ig. 1.
Average haemoglobin concentration (%).
Effect of probiotic containing
Saccharomyces boulardii
on experimental ochratoxicosis in broilers 361
10. Add 30 ml chloroform in it.
11. Put it in separating funnel.
12. Shake it for five minutes in separating funnel.
13. After shaking collect lower chloroform layer.
14. Keep it in beaker.
15. Evaporate it on moist heat up to dryness.
16. Cool it at room temperature.
17. After cooling, add 1ml chloroform in it.
18. Transfer it into test tube.
19. Again evaporate it.
20. Add 1ml benzoacetonitrile in it.
21. Spot 20
µ
l of it, on TLC plate
22. Spot the Standard of ochratoxin A on TLC plate with
dilutions, 100
µ
l, 20
µ
l, and 10
µ
l
21. Run the TLC plate in solution containing 95 ml
chloroform and 5 ml acetone for half an hour.
23. Dry it at room temperature.
24. Observe under UV light.
Measurement
1
µ
l of standard ochratoxin contains 10 ppb ochratoxin A.
When spot of test feed sample match with standards spot
containing 5
µ
l quantity of ochratoxin A, then it means test
sample contains 50 ppb ochratoxin A.When it matches with
standards spot containing 10
µ
l, 20
µ
l and 100
µ
l, it means
test sample contains 100 ppb, 200 ppb and 1000 ppb
ochratoxin A respectively (1 ppm = 1000 ppb).
Experimental chicks: Day old broiler chicks of breed
White Leghorn were procured from a reputed hatchery.
These chicks were weighed individually and reared with
deep litter system under optimum condition of brooding and
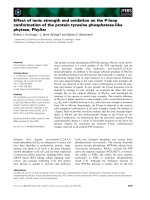
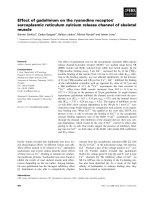
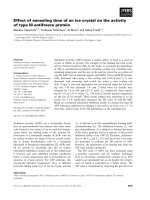
Table 2.
Packed cell volume percentage of different groups at different periods
Week of experiment
Sr. No.
2nd week 4th week 6th week
ABCDABCDABCD
1 27.1 21.4 28.5 27.1 32.0 24.8 30.2 24.5 31.0 16.0 31.5 22.5
2 27.1 24.2 30.0 28.0 28.5 20.6 26.5 26.0 30.4 22.5 24.3 25.0
3 28.5 25.7 27.1 25.7 31.5 26.4 24.2 26.5 32.5 24.0 30.5 20.0
4 28.5 22.5 31.4 25.8 27.5 18.2 28.0 23.5 30.0 22.4 25.0 25.5
5 34.2 21.4 27.1 24.5 28.0 21.6 29.4 27.0 33.5 20.2 32.4 26.0
6 28.5 25.30 31.4 28.5 29.0 23.6 25.0 24.0 31.2 21.0 30.5 28.6
Mean 29.0
bc
23.4
a
29.3
c
26.6
b
29.4
c
22.5
a
27.2
bc
25.3
b
31.4
c
21.0
a
29.0
c
24.6
b
S.E. ±1.080.750.800.620.761.210.970.580.541.131.411.21
Means with at lest one common superscript do not differ significantly, Significant at 5 %, N.S Non Significant.
Analysis of variance:
Week of
experiment
Source
Sum of
square
Degree of
freedom
Mean sum of
square
F-calculated
C.D. value at
5% level
2nd
Treatment 134.0833 3 44.69444 10.69288*
Error 83.59667 20 4.179833
Total 217.68 23 2.46
4th
Treatment 154.1446 3 51.38153 10.12394*
Error 101.505 20 5.07525
Total 255.6496 23 2.71
6th
Treatment 386.58 3 128.86 16.89821* 3.32
Error 152.52 20 7.6258
Total 539.1 23
F
ig. 2.
Average packed cell volume (%).
362 Agawane S. B., Lonkar P. S.
management.
Experimental feed: Broiler starter and finisher feed were
procured from Central Poultry Breeding Farm (CPBF),
Aarey colony, Mumbai.
Toxin feed: Powdered ochratoxin A was incorporated in
feed to maintain the level of 0.5 ppm in the feed.
Medicine: Drug (Probiotic) containing yeast
Saccharomyces
boulardii
was obtained from UNI-Sankyo limited, Gaganpahad,
Hyderabad-501323. It was in powdered form containing
20 billion CFU/GM.
Experimental procedure: A total of 120 chicks day old
chicks were randomly divided into different dietary treatment
groups as detailed below.
Hematology: Six birds from each group were sacrificed
on 14th, 28th, and 42th day of experiment. Prior to sacrifice,
blood was collected by cardiac puncture for hematobiochemical
studies.
1. Haemoglobin concentration was determined by using
Sahli’s method (Acid haematin).
Group
No. of
Birds
Treatment
A 30 Normal feed
B 30 Ochratoxin A of 0.5 ppm of the feed
C 30
Normal feed + Probiotics containing
Saccharomyces boulardii
of 10 mg/kg of feed.
D 30
Ochratoxin of 0.5 ppm + Probiotics containing
Saccharomyces boulardii
of 10 mg/kg.
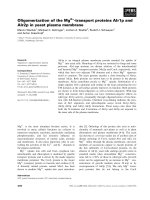
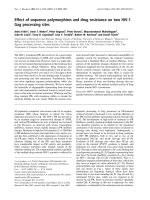
Table 3.
Total serum protein (%) of different groups at different periods
Weeks of experiment
Sr. No.
2nd week 4th week 6th week
ABCDABCDABCD
1 2.501.832.641.802.671.872.811.862.961.932.981.96
2 2.451.872.441.882.771.912.851.912.911.953.101.95
3 2.601.652.741.832.701.852.761.963.001.953.122.05
4 2.651.952.601.852.741.882.781.872.971.892.952.00
5 2.541.812.681.822.651.902.821.903.102.002.991.99
6 2.561.892.641.862.791.872.741.892.901.952.982.10
Mean 2.55
b
1.83
a
2.62
d
1.84
a
2.72
b
1.88
a
2.79
c
1.89
a
2.97
c
1.94
a
3.02
d
2.00
b
S.E. ±0.020.040.040.010.020.000.010.010.020.010.020.02
Means with at lest one common superscript do not differ significantly, *- Significant at 5 %, N.S Non Significant.
Analysis of variance:
Weeks of
experiment
Source
Sum of
square
Degree of
freedom
Mean sum of
square
F-calculated
C.D. value at
5% level
2nd
Treatment 3.391267 3 1.130422
169.6482* 0.098
Error 0.133267 20 0.006663
Total 3.524533 23
4th
Treatment 4.532479 3 1.510826
926.4137* 0.048
Error 0.032617 20 0.001631
Total 4.565096 23
6th
Treatment 4.532479 3 1.510826
926.4137* 0.048
Error 0.032617 20 0.001631
Total 4.565096 23
F
ig. 3.
Average total serum protein (%).
Effect of probiotic containing
Saccharomyces boulardii
on experimental ochratoxicosis in broilers 363
2. Packed Cell Volume was determined by using Wintrobe
method.
Serum biochemistry: During each screening blood samples
were collected in non-heparinized tubes. The serum was
separated after eight hours and stored at
−
20
o
C for
subsequent analysis.
1. Serum proteins, albumin and globulin were estimated
by Biuret and BCG dye binding method, respectively using
commercial reagent kits (Qualigens Fine Chemicals, India).
2. Serum Glutamate Pyruvate Transaminase (SGPT) was
determined by Reitman and Frankels method [17], using
commercial reagent kits (Qualigens Fine Chemicals, India).
3. Serum Creatinine was determined by alkaline picrate
method, using commercial reagent kits (Qualigens Fine
Chemicals, India).
Statistical analysis: Statistical analysis was done by using
two way ANOVA method as suggested by Snedecor and
Cochran [20].
Results
Production of Ochratoxin (OA)
Mycelial growth started to appear on broken wheat by third
day with condensation of moisture inside the flask, after
inoculation of spore suspension in it. The wheat media
gradually turned to brown in colour, which became dark brown
after 12 days of inoculation. SDA plate revealed colonies fungus
Aspergillus ochraceus
. Microscopic examination was shown
punctuate hypae along with spores of
Aspergillus ochraceus.
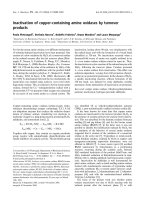
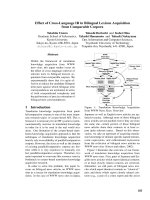
Table 4.
Serum albumin concentration (%) of different groups at different periods
Weeks of experiment
Sr. No.
2nd week 4th week 6th week
ABCDABCDABCD
1 1.411.021.451.021.491.061.551.021.761.061.681.11
2 1.441.011.461.021.561.021.561.121.711.111.721.12
3 1.411.001.451.081.591.051.591.091.691.091.711.12
4 1.421.011.481.021.491.021.591.091.621.091.691.13
5 1.421.011.491.051.541.031.541.031.541.061.671.09
6 1.471.021.461.021.531.031.531.021.691.041.731.12
Mean 1.43
c
1.01
a
1.47
d
1.04
b
1.53
b
1.04
a
1.56
b
1.06
a
1.67
b
1.08
a
1.70
b
1.12
a
S.E. ± 0.009 0.003 0.007 0.010 0.016 0.007 0.010 0.02 0.032 0.011 0.01 0.006
Means with atlest one common superscript do not differ significantly, *- Significant at 5 %, N.S Non Significant.
Analysis of variance:
Weeks of
experiment
Source
Sum of
square
Degree of
freedom
Mean sum of
square
F-calculated
C.D. value
at 5% level
2nd
Treatment 1.080933 3 0.360311 965.119* 0.023
Error 0.007467 20 0.000373
Total 1.0884 23
4th
Treatment 1.494283 3 0.498094 457.6672* 0.039
Error 0.021767 20 0.001088
Total 1.51605 23
6th
Treatment 2.090513 3 0.696837 376.8387* 0.051
Error 0.036983 20 0.001849
Total 2.127496 23
F
ig. 4.
Average serum albumin (%).
364 Agawane S. B., Lonkar P. S.
Ochratoxin Quantification
The broken wheat inoculated with
Aspergillus ochraceous
was quantified by thin layer chromatography (TLC) method.
Spot of test feed sample 20
µ
l matched with standard spot of
ochratoxin A containing 100
µ
l ochratoxin A. So, it yielded
ochratoxin A of 5 ppm of broken wheat.
Discussion
Hemoglobin percentage was significantly (
p
< 0.05) low
in toxin fed birds of groups B and D as compared to A and C
for second and sixth week of experiment. At the end of
fourth week, they were significantly (
p
< 0.05) low in birds
of group B than control groups A and C and nonsignificantly
low than group D.
Reduction in hemoglobin percentage in ochratoxicosis in
birds was observed by Ramadevi
et al.
[16].
Decrease in hemoglobin percentage in ochratoxin fed
birds of groups B and D might be due to anemia as a result
of depressed erythropoisis. Nephrotoxicity by the ochratoxin
[8] probably resulted in hampered formation of erythropoietin
and ultimately erythropoisis. Higher hemoglobin concentration
of group D than B indicated beneficial effect of
Saccharomyces boulardii.
It secrets “Protease”, a toxin
binding enzyme, that binds to toxin receptor on the epithelial
cells of the gastro intestinal tract and enzymatically modifies
them. Thus, toxin of pathogen cannot damage the epithelium
and adsorbed on epithelium of gastrointestinal tract [4].
Hence due to less absorption, there was less effect of OA.
Packed cell volume was low in OA administered birds of
groups B and D over the period. It was significantly
(
p
< 0.05) low in birds of groups B as compared to other
groups. Addition of probiotic resulted in significant (
p
< 0.05)
high PCV in the birds of group D as compared to group B,
though it was lower than the groups A and C.
Reduction in PCV due to ochratoxicosis, observed in the
present study, is in agreement with the earlier findings by
Table 5.
Serum globulin concentration (%) of different groups at different periods
Weeks of experiment
Sr. No.
2nd week 4th week 6th week
ABCDABCDABCD
1 1.090.821.190.781.180.811.260.841.200.871.300.85
2 1.010.850.980.861.210.891.290.791.200.841.380.83
3 1.190.641.290.821.110.801.170.871.310.861.410.93
4 1.230.931.120.831.250.861.190.781.350.801.260.87
5 1.120.781.190.791.110.871.280.871.560.941.320.90
6 1.090.871.180.841.260.841.210.871.210.911.250.98
Mean 1.12
b
0.81
a
1.15
c
0.82
a
1.18
b
0.84
a
1.23
b
0.83
a
1.30
b
0.870
a
1.32
b
0.89
a
S.E. ± 0.032 0.041 0.042 0.012 0.027 0.014 0.02 0.017 0.057 0.02 0.026 0.023
Means with at least one common superscript do not differ significantly, *- Significant at 5 %, N.S Non Significant.
Analysis of variance:
Weeks of
experiment
Source
Sum of
square
Degree of
freedom
Mean sum of
square
F-calculated
C.D. value at
5% level
2nd
Treatment 0.628146 3 0.209382 30.36354* 0.100
Error 0.137917 20 0.006896
Total 0.766062 23
4th
Treatment 0.824446 3 0.274815 111.8272* 0.059
Error 0.04915 20 0.002457
Total 0.873596 23
6th Treatment 1.116013 3 0.372004 50.79133* 0.103
F
ig. 5.
Average serum globulin (%).
Effect of probiotic containing
Saccharomyces boulardii
on experimental ochratoxicosis in broilers 365
Pawar [14]. Lowered PCV in OA fed birds might be due
anemia developed in ochratoxicosis as described earlier and
the values in group D indicated that probiotic,
Saccharomyces
boulardii,
was effective in reducing of the adverse effect of
OA on hemopioetic system as described earlier, probably by
low absorption of toxin.
Total serum proteins were significantly (
p
< 0.05) low in
OA administered groups B and D as compared to groups A
and C over the period. It was significantly (
p
< 0.05) high in
birds of group D than B but considerably low than in groups
A and C. Reduction in total serum proteins due to OA were
reported by Prior
et al
. [15]. Low total serum proteins, might
be due to inhibition of protein synthesis. OA inhibits the
protein synthesis, through competitive inhibition of
phenylalanine-t-RNA synthesis with phenylalanine as
reported by Creepy
et al.
[6] and leakage of albumin due to
nephrotoxicity induced by OA Huff
et al.
[10].
Improvement in protein values in group D as compared to
B and in birds of group C as compared to group A, indicated
increased protein synthesis as an effect of probiotic
Saccharomyces boulardii
along with reduced absorption of
OA as discussed earlier.
Serum albumin concentrations were significantly (
p
< 0.05)
low in birds of group B and D as compared to group A and
C over the period of experiment. In birds of group D, it was
high than group B. Lowered serum albumin levels, due to
ochratoxicosis had been recorded by Manning and Wyatt
[13]. Decrease in serum albumin concentrations in birds of
group B and improvement in group D could be due to the
factors related with protein synthesis, as described earlier.
Serum globulin concentrations were low in birds of group
B and D than control groups A and C over the period of
experiment. Lowered serum globulin concentrations, due to
Table 6.
Serum glutamate pyruvate transaminase (U/ml) of different groups at different periods
Weeks of experiment
Sr. No.
2nd week 4th week 6th week
ABCDABCDABCD
1 284129403140273631422634
2 313931422938263929382637
3 323831363139273932383137
4 263830353342303826412939
5 334228372742313527422641
6 274227372840263528422735
Mean 29.5
a
40.00
b
29.33
a
37.83
b
29.83
a
40.16
c
27.83
a
37
b
28.83
a
40.5
c
27.5
a
37.1
b
±S.E.1.170.770.661.070.900.650.870.770.940.800.841.04
Means with at lest one common superscript do not differ significantly, *- Significant at 5 %, N.S Non Significant.
Analysis of variance:
Weeks of
experiment
Source
Sum of
square
Degree of
freedom
Mean sum of
square
F-calculated
C.D. value at
5% level
2nd
Treatment 555.6667 3 185.2222 34.4066* 2.79
Error 107.6667 20 5.383333
Total 663.3333 23
4th
Treatment 612.4583 3 204.1528 52.01345* 2.38
Error 78.50 20 3.925
Total 690.9583 23
6th
Treatment 721.3333 3 240.4444 47.77042* 2.70
Error 100.6667 20 5.033333
Total 822 23
F
ig. 6.
Average serum glutamate pyruvate transaminase (U/ml)
.
366 Agawane S. B., Lonkar P. S.
ochratoxicosis, were also observed by Huff
et al.
[10].
Decrease in serum globulin in toxin fed group B might be
due to the adverse effect of ochratoxin A on synthesis of
total proteins and globulin.
The results coincided with the tune of total proteins and
albumin. Slight improvement in serum globulin concentrations
in birds of group D, indicated effectiveness of probiotic
Saccharomyces boulardii
in globulin synthesis by the birds
with poor absorption of OA as described earlier.
The SGPT levels of groups B and D remained high as
compared to groups A and C over the period. The SGPT
levels of group D were significantly l (
p
< 0.05) low than the
group B. Increased SGPT levels in birds due to
ochratoxicosis had been reported earlier by Sremannarayana
et al
. [21]. The SGPT levels high in toxin fed group B
indicated damage to the hepatocytes and release of enzymes
after the damage.
Low SGPT levels of toxin administered and probiotic
treated group D birds indicated reduction of adverse effect
of OA due to its less absorption in the body.
The levels of serum creatinine were high in toxin fed birds
of groups B and D as compared to groups A and C over the
period. The levels were significantly (
p
< 0.05) high in
group B than D (except fourth week). Increase in serum
creatinine concentrations, due to OA, had been reported
earlier by Sakhare
[18].
Increase in serum creatinine concentration in toxin fed
birds might be due to nephrotoxic action of OA, which
causes renal impairment by destruction of epithelial cells of
proximal and distal convoluted tubules and tubular damage.
Significant (
p
< 0.05) decrease in levels of serum creatinine
Table 7.
Serum creatinine (mg/dl) of different groups at different periods
Weeks of experiment
Sr. No.
2nd week 4th week 6th week
ABCDABCDABCD
1 0.260.390.310.420.340.450.310.430.350.520.270.41
2 0.350.510.290.380.270.410.270.360.370.390.310.37
3 0.340.460.380.410.360.390.320.420.260.520.37 0.4
4 0.270.480.310.390.290.470.380.370.310.470.330.36
5 0.31 0.46 0.37 0.37 0.3 0.51 0.36 0.34 0.35 0.45 0.34 0.41
6 0.32 0.47 0.41 0.35 0.34 0.4 0.42 0.4 0.34 0.51 0.44 0.32
Mean 0.30
a
0.46
c
0.34
ab
0.38
b
0.31
a
0.43
bc
0.34
ab
0.38
bc
0.33
a
0.47
b
0.34
a
0.37
a
S.E. ± 0.014 0.01 0.01 0.01 0.01 0.01 0.02 0.01 0.01 0.02 0.02 0.01
Means with at lest one common superscript do not differ significantly, *- Significant at 5 %, N.S Non Significant.
Analysis of variance:
Weeks of
experiment
Source
Sum of
square
Degree of
freedom
Mean sum of
square
F-calculated
C.D. value at
5% level
2nd
Treatment 0.077946 3 0.025982 17.64478* 0.046
Error 0.02945 20 0.001472
Total 0.107396 23
4th
Treatment 0.050979 3 0.016993 8.971257* 0.0524
Error 0.037883 20 0.001894
Total 0.088862 23
6th
Treatment 0.079046 3 0.026349 11.99027* 0.0564
Error 0.043950 20 0.002198
Total 0.122996 23
F
ig. 7.
Average serum creatin (mg/dl).
Effect of probiotic containing
Saccharomyces boulardii
on experimental ochratoxicosis in broilers 367
in group D as compared to toxin fed group B indicated,
reduction in adverse effect of OA on kidneys, in presence of
probiotic
Saccharomyces boulardii
which
reduces
absorption of OA in the body as described earlier.
On the basis of literature reviewed, results of present
experiment and a foresaid discussion, it could be concluded
that ochratoxin A 0.5 ppm of feed, adversely affected the
broilers. It resulted in significant reduction in hemoglobin
and packed cell volume percentage, decrease in total serum
proteins, albumin and globulin but increase in concentration
of creatinine and SGPT.
Probiotic
Saccharomyces boulardii
along with ochratoxin
A at dose rate 10 mg/kg of feed, employed in present study,
resulted in significant improvement related to hematobiochemical
parameters in broilers.
In ochratoxin A contaminated feed, use of probiotic,
containing yeast
Saccharomyces boulardii
is an alternative
in field conditions to reduce the adverse effect and economic
losses. Similar studies with other toxins may exhibit its
spectrum of activities.
References
1. Amitha P. Pathology of experimental ochratoxicosis in
broilers and assessment of efficacy of toxin binder. M. V. Sc.
thesis submitted to University of Agriculture Science,
Bangalore, 2001.
2. AOAC. Official methods of analysis, 16th ed. Association of
Official Analytical Chemists, Washington D.C., 1995.
3. Baily CA, Gibson RM, Kubena LF, Huff WE, Harvey RB.
Impact of L-phenylalanine supplementation on the performance
of broiler chicks fed with diet containing ochratoxin A.
Effect on haematology and clinical chemistry. Poult Sci 69,
420-425, 1990.
4. Bradley GI, Savage TF, Timm KI. The effect of
supplementing diet with
Saccharomyces cervecei
var.
boulardii
on male poults performance and ileal morphology.
Poult Sci 1994, 73, 1766-1770.
5. Churchill RR, Naryankutty K. Indian poultry industry
current status and future prospectus. Poultry Times India.
2002, 3, 16-20.
6. Creppy EE, Lungnier AAJ, Fasiolo F, Heller K,
Röschenthaler R, Dirheimer G. In vitro inhibition of yeast
phenylalanyl t RNA synthetase by ochratoxin A. Chem Biol
Interact 1979, 24, 257-261.
7. Hamilton PB, Huff WE, Harris JR. Wyatt RD. Natural
occurrence of ochratoxicosis in poultry. Poult Sci 1982, 61,
1832-1841.
8. Huff WE, Wyatt RD, Hamilton PB. Nephrotoxicity of
dietary ochratoxin A in broiler chickens. Appl Microbiol
1975, 30, 601-604.
9. Huff WE, Doerr JA. Synergism between aflatoxin and
ochratoxin A in broiler chickens. Poult Sci 1981, 60, 550-
555.
10. Huff WE, Kubena LF, Harvey RB. Progression of
ochratoxicosis in broiler chickens. Poult Sci 1988, 67, 1139-
1146.
11. Johri TS, Shrivastava HP. Mycotoxin related health hazards
to poultry. XX Annual Conference of Indian Poult Sci Asso.
pp. 149-154, 2000.
12. Lyons TP, Lyons TP (ED.), Jacques KA. Biotechnology in
the feed industry a look forward and backward.
Biotechnology in the Feed Industry, Proceeding of Alltechs
Eleventh Annual Symposium 1-29, 1995.
13. Manning RO, Wyatt RD. Toxicity of
Aspergillus ochraceus
contaminated wheat and different chemical forms of OA in
broiler chicks. Poult Sci 1984, 63, 458-465.
14. Pawar P. Studies on ochratoxicosis in broiler birds. M. V. Sc.
Thesis submitted to Marathawada Krishi Vidyapeeth,
Parbhani, 2001.
15. Prior MG, Neil JB, Sisodia CS. Effect of ochratoxin A on
growth response and residues in broilers. Poult Sci 1980, 59,
1254 -1257.
16. Ramadevi V, Gopal Naidu NR, Ravikumar P. An
assessment of protective effect bentonite ochratoxicosis in
broilers with reference to certain hematobiochemical
profiles. Indian Vet J 2000, 77, 303-306.
17. Reitman S, Frankel S. A colorimetric method for the
detemination of serum glutamic oxalacetic and glutamic
pyruvic transaminases. Am J Clin Path 1957, 28, 56-63.
18. Sakhare PS. Evaluation of herbal product during
aflatoxicosis and ochratoxicosis in broilers. M. V. Sc. Thesis
submitted to Dr. Punjabrao Deshmukh Krishi Vidyapeeth,
Akola, 2002.
19. Sawale G. Studies on ameliorating effect of herbo-toxin
mineral toxin binders in aflatoxicosis and ochratoxicosis in
layers. M. V. Sc. Thesis submitted to Indira gandhi krishi
vishvavidyalaya, raipur, 2002.
20. Snedecor JW, Cochran WG. Statistical Methods. 8th ed.
Affiliated East-West Press, Kolkata, 1994.
21. Sreemannarayana O, Marquardt RR, Frohlich AA,
Abramson D, Phillips GD. Organ weight, liver constituent
and serum components in growing chicks fed ochratoxin A.
Arch Environ Contam Toxicol 1989, 18, 404-410.
22. Trenk HL, Butz ME, Chu FS. Production of ochratoxin in
different cereal products by
Aspergillous ochraceous
. Appl
Microbiol 1997, 21, 1032-1035.