An Experimental Approach to CDMA and Interference Mitigation phần 2 potx
Bạn đang xem bản rút gọn của tài liệu. Xem và tải ngay bản đầy đủ của tài liệu tại đây (927.11 KB, 27 trang )
12 Chapter 1
restrial UMTS networks are based on very small cells (of a few km radius)
which allow the provision of high peak rates (up to a few hundreds kbit/s)
and attain a large frequency re-use. This is possible thanks to the CDMA
technology which is at the core of the UMTS radio interface. However, the
technical solution becomes very inefficient when the UMTS networks have
to be used to transmit the same information to many users (e.g., video clips
containing highlights of sport events, financial information, broadcasting of
most accessed web pages, etc.). Broadcast information may be locally stored
in the user terminal (cacheing) and accessed when required by the user. In
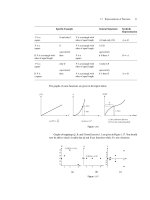
this case a satellite broadcast layer with large cell sizes (Figure 1-8) on top
of T-UMTS will provide a cheaper solution for this kind of services. Satellite
systems have a major advantage in broadcasting information since a single
satellite can cover regions as large as Europe or USA. Good quality of ser-
vice can be achieved by means of powerful error correction techniques and
by an integrated terrestrial gap filler network.
Figure 1-7. Sample multi-beam satellite footprint (courtesy of Alenia Spazio, Italy).
In all cases the efficient use of the very scarce and expensive spectrum
resources causes the S-UMTS system to operate under heavy interference
conditions. The interference is mainly caused by other satellite beams which
1. Introducing Wireless Communications 13
are re-using the same frequency (see Figure 1-9). In the case of terrestrial
gap fillers other co-frequency transmitters also generate further co-channel
interference. So the issue of co-channel interference mitigation to increase
system capacity is pivotal to the economical development and deployment of
(S-)UMTS.
Figure 1-8. Sample broadcast footprint (courtesy of Alenia Spazio, Italy).
Figure 1-9. Interference pattern for a European multi-beam UMTS satellite (courtesy of
Alenia Spazio, Italy).
14 Chapter 1
4. VLSI TECHNOLOGIES FOR WIRELESS COM-
MUNICATION TERMINALS
It is an everyday experience of life to buy the best and most expensive
cellular phone at one’s retail store and after one year or so to find the same
item at half that price. This is just the result of the celebrated Moore’s law:
the number of transistor on a chip with a fixed area roughly doubles every
year and a half. Hence the price of microelectronics components halves in
the same period, or, the power of VLSI (Very Large-Scale Integrated) cir-
cuits doubles over the same 18 months.
As a matter of fact, over the last few decades Moore’s prediction has
been remarkably prescient. The minimum sizes of the features of CMOS
(Complementary Metal Oxide–Semiconductor) transistors have decreased on
average by 13% per year from 3 µm in 1980 to 0.13 µm in 2002, die areas
have increased by 13% per year, and design complexity (measured by the
number of transistors on a chip) has increased at an annual growth rate of
50% for Dynamic Random Access Memories (DRAMs) and 35% for micro-
processors. Performance enhancements have been equally impressive. For
example, clock frequencies for leading edge microprocessors have increased
by more than 30% per year. An example related to transistor count of Intel
microprocessors is reported in Figure 1-10.
Figure 1-10. Moore’s law and Intel microprocessors (courtesy of Intel).
This enormous progress in semiconductor technology is fueling the
growth in commercial wireless communications systems. New technologies
are being spurred on by the desire to produce high performance, low power,
small size, low cost, and high efficiency wireless terminals. The complexity
of wireless communication systems is significantly increasing with the ap-
1. Introducing Wireless Communications 15
plication of more sophisticated multiple-access, digital modulation and proc-
essing techniques in order to accommodate the tremendous growth in the
number of subscribers, thus offering vastly increased functionality with bet-
ter quality of service. In Figure 1-11 we have illustrated the processor per-
formance (according to Moore’s Law) together with a qualitative indication
of the algorithm complexity increase (approaching the theoretic performance
limits imposed by Shannon’s theory), which leaps forward whenever a new
wireless generation is introduced, as well as the available battery capacity,
which unfortunately increases only marginally [Rab00].
Figure 1-11. Moore’s law, system complexity and battery capacity [Rab00].
It appears that system complexity grows faster than Moore’s Law, and so a
‘brute force’ use of the available processing power (GIPS/s) in a fully pro-
grammable implementation is not sufficient; often dedicated hardware accel-
erators are required. Furthermore, taking the battery capacity limit into ac-
count, the use of dedicated hardware becomes mandatory to reduce power
consumption. This is the fundamental trade off between energy efficiency
(i.e., the number of operations that can be performed for a given amount of
energy) and flexibility (i.e., the possibility to re-use a single design for mul-
tiple applications) which is clearly illustrated in Figure 1-12 for various im-
plementation styles [Rab00]. An amazing three orders of magnitude vriation
of energy efficiency (as measured in MOPS/mW) can be observed between
an ASIC (Application Specific Integrated Circuit) style solution and a fully
programmable implementation on an embedded processor. The differences
are mostly owed to the overhead that comes with flexibility. Application
specific processors and configurable solutions improve energy efficiency at
the expense of flexibility. The most obvious way of combining flexibility
16 Chapter 1
and cost efficiency is to take the best from different worlds: computationally
intensive signal processing tasks are better implemented on DSP (Digital
Signal Processor) cores or media processor cores than on a microprocessor
core, whilst the opposite is true for control tasks.
As shown in Figure 1-13, a typical wireless transceiver combines a data
pipe, which gradually transforms the bit serial data stream coming from the
Analog to Digital Converter (ADC) into a set of complex data messages, and
a protocol stack, that controls the operation of the data pipe. Data pipe and
protocol stack differ in the kind of computation that is to be performed, and
in the communication mechanisms between the functional modules. In addi-
tion, the different modules of the data and control stacks operate on time and
data granularities which vary over a wide range. The conclusion is that a
heterogeneous architecture which optimally explores the ‘flexibility-power-
performance-cost’ design space is the only viable solution of handling the
exponentially increasing algorithmic complexity (which is mainly owed to
multiple standards, adaptability and increased functionality) and the battery
power constraint in wireless terminals. Figure 1-14 shows a typical hetero-
geneous System on a Chip (SoC) architecture employing several standard as
well as application specific programmable processors, on chip memories,
bus based architecture, dedicated hardware co-processor, peripherals, and
Inpu/Output (I/O) channels.
Figure 1-12. Trading off flexibility versus energy efficiency (in MOPS/mw or million of op-
eration per mJ of energy) for different implementation styles [Rab00].
1. Introducing Wireless Communications 17
Figure 1-13. Functional components of a wireless transceiver.
Figure 1-14. Typical heterogeneous System-on-Chip platform.
Now that the main architecture of the terminal is decided, the subsequent
key problem is how to map the system/algorithm onto the various building
blocks of a heterogeneous, configurable SoC architecture (hardware and
software) within given constraints of cost and time to market.
An extensive profiling/analysis of the application/algorithm in the early
algorithmic design phases can help to determine the required bounds on per-
formance and flexibility, or to outline the dominant computational pattern
and explore data transfer and storage communications. This step is both te-
dious and error prone if carried out fully manually, and so new design meth-
odologies have to be provided to bridge the gap between algorithmic devel-
opment and cost effective realization. There is a need for fast guidance and
early feedback at the algorithm level, without going all the way down to as-
18 Chapter 1
sembly code or hardware layout (thus getting rid of long design cycles).
Only when the design space has been sufficiently explored at a high level,
and when a limited number of promising candidates have been identified, a
more thorough and accurate evaluation is required for the final hard-
ware/software partitioning. Most importantly, the optimum system is always
the result of a joint, truly, interactive architecture–algorithm design. A better
algorithm (even the best) from a communication performance standpoint
may not correspond to a suitable computational/communication architecture.
Since no single designer can adequately handle algorithms, design method-
ologies and architectures, a close interaction between designers (the sys-
tem/communication engineer and the VLSI/chip architect) and design teams
is required to master such a complex SoC design space.
Therefore, the designer’s efficiency must be improved by a new design
methodology which benefits from the re-use of Intellectual Property (IP) and
which is supported by appropriate tools that allow the joint design and veri-
fication of heterogeneous hardware and software. Particularly, owing to the
exponential increase of both design gate counts and verification vectors, the
verification gap grows faster than the design size by a factor of 2/3 according
to the International Technology Roadmap for Semiconductor (ITRS) road
map.
This is the well known design productivity challenge that has existed for
a long time. Figure 1-15 shows how Integrated Circuits (ICs) complexity (in
logic transistors) is growing faster than the productivity of a design engineer,
creating a ‘design gap’. One way of addressing this gap is to steadily in-
crease the size of the design teams working on a single project. We observe
this trend in the high performance processor world, where teams of more
than a few hundred people are no longer a surprise. This approach cannot be
sustained in the long term, but fortunately, about once in a decade we wit-
ness the introduction of a novel design methodology that creates a step func-
tion in design productivity, helping to bridge the gap temporarily. Looking
back over the past four decades, we can identify a certain number of
productivity leaps. Pure custom design was the norm in the early integrated
circuits of the 1970s. Since then programmable logic arrays, standard cell,
macrocells, module compilers, gate arrays, and reconfigurable hardware
have steadily helped to ease the time and cost of mapping a function onto
silicon. Today semiconductor technology allows the integration of a wide
range of complex functions on a single die, the SoC concept already men-
tioned. This approach introduces some major challenges which have to be
addressed for the technology to become a viable undertaking: i) very high
cost of production facilities and mask making (in 0.13 µm chips, mask costs
of $600,000 are not uncommon); ii) increase performance predictability re-
ducing the risk involved in complex SoC design and manufacturing as a re-
1. Introducing Wireless Communications 19
sult of deep sub-micron (0.13 µm and below) second order effects (such as
crosstalk, electro-migration and wire delays which can be more important
than gate delays). These observations, combined with an intense pressure to
reduce the time to market, requires a design paradigm shift comparable with
the advent of the driving of ASIC design by cell libraries in the early 1980s,
to move to the next design productivity level by further raising the level of
abstraction. To this aim, recently the use of platforms at all of the key articu-
lation points in the SoC design has been advocated [Fer99]. Each platform
represents a layer in the design flow for which the underlying subsequent
design flow steps are abstracted. By carefully defining the platforms’ layers
and developing new representations and associated transitions from one plat-
form to the next, an economically feasible SoC design flow can be realized.
Platform based design provides a rigorous foundation for design re-use, ‘cor-
rect by construction’ assembly of pre-designed and pre-characterized com-
ponents (versus full custom design methods), design flexibility (through an
extended use of reconfigurable and programmable modules) and efficient
compilation from specification to implementations. At the same time it al-
lows us to trade off various components of manufacturing, Non-Recurrent
Engineering (NRE) and design costs while sacrificing as little potential de-
sign performance as possible. A number of companies have already em-
braced the platform concept in the design of integrated embedded systems.
Examples are the Nexperia platform by Philips Semiconductor [Cla00],
[Gra02], the Gold platform by Infineon [Hau01], and the Ericsson Mobile
Platform by Ericsson [Mat02].
Figure 1-15. The design productivity gap, showing the different Compound Annual Growth
Rates (CAGRs) of technology (in logic transistors per chip) and design productivity (in tran-
sistors designed by a single design engineer per month) over the past two decades.
This page intentionally left blank
Chapter 2
BASICS OF CDMA FOR WIRELESS
COMMUNICATIONS
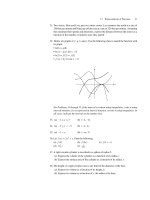
Is the reader familiar with the basic concepts in CDMA communications?
Then he/she can safely skip the three initial Sections of this Chapter. If
he/she is not, he/she will find there the main issues in generation and detec-
tion of a CDMA signal, and the basic architecture of a DSP-based CDMA
receiver. But even the more experienced reader will benefit from the subse-
quent three sections of this Chapter, which deal with the use of CDMA in a
satellite mobile network (with typical numerical values of the main system
parameters), with the relevant techniques for interference mitigation (can-
cellation), and with the specifications of the case considered in the book and
referred to as MUSIC (Multi USer and Interference Cancellation).
1. NARROWBAND AND WIDEBAND DIGITAL
MODULATIONS
The generic expression of a linear band pass modulated signal ()
s
t is
00
cos 2 sin 2
IQ
s
tst ftst ft SS
, (2.1)
where
0
f
is the carrier frequency, whilst ()
I
s
t and
()
Q
s
t
are two baseband
signals which represent the In phase (I) and the Quadrature (Q) components
of the modulated signal, respectively. A more compact representation of the
I/Q modulated signal (2.1), provided that the carrier frequency
0
f
is known,
is its complex envelope (or baseband equivalent) defined as follows
22 Chapter 2
j
IQ
s
tst st
. (2.2)
The relation between the complex-valued baseband equivalent and the
real-valued band pass modulated signal is straightforward
^
`
0
j2
e
f
t
st st
S
. (2.3)
The normalized power of the baseband components
()
I
s
t and ()
Q
s
t are
^
`
2
E
I
sI
P
st ,
^
`
2
E
Q
sQ
P
st , (2.4)
so that from (2.2) the power of the complex envelope
()
s
t
is
^
`
2
E
I
Q
s
ss
P
st P P
. (2.5)
From (2.1) we also find that the Radio Frequency (RF) power of the
modulated signal
()
s
t is given by
^`
2
E
22
IQ
ss
s
s
PP
P
Pst
. (2.6)
Assume now that the information data source is generating a stream of
information bearing binary symbols (bits)
{}
m
u
running at a rate
1/
bb
R
T
,
where
b
T is the bit interval. The information bits are mapped onto a
constellation of
W symbols (represented as a set of points in the complex
plane) and each complex symbol is then labeled by a ‘word’ of
2
log ( )W
bits. This mapping generates a stream of complex-valued symbols {}
k
d
with
,,
j
kIk Qk
dd d
(2.7)
running at the rate
1/
s
s
R
T
, where
s
T
is the symbol, or signaling, interval,
2
/log ( )
sb
R
RW . The symbols are subsequently shaped by a filter with a
s
T energy impulse response ()
T
g
t so as to obtain the following (baseband
equivalent) data modulated signal
2
2
s
kT s
k
d
P
s
tdgtkT
A
f
f
¦
. (2.8)
2. Basics of CDMA for Wireless Communications 23
The equation above is the general expression of a linear digital modula-
tion where
s
P
is the RF power of the modulated signal (2.1), as defined in
(2.6), and
2
d
A
is the mean squared value of the data symbols
^
`
2
222
E
I
Q
kdd
d
AdAA
(2.9)
with
^
`
22
,
E
I
dIk
Ad ,
^
`
22
,
E
Q
dQk
Ad . (2.10)
The block diagram of the linear I/Q modulator described in (2.8), is
shown in Figure 2-1, where we have introduced the amplitude coefficient
2
2
s
d
APA
(2.11)
and its relevant baseband complex equivalent, as in (2.2), is shown in Figure
2-2. The linear I/Q demodulator to recover the digital data from signal (2.3)
is shown in Figure 2-3, where the (ideal) low pass filters
()Hf
detect the
baseband components
()
I
s
t
and ()
Q
s
t , and suppress double frequency com-
ponents (image spectra) arising from the previous mixing process. In all of
the figures in this chapter and in the remaining part of the book, thick lines
denote complex-valued signals.
s(t)
cos( 2Sf t )
0
Map
d
I,k
d
Q,k
-sin( 2Sf t )
0
u
m
d
k
~
A
Pulse
Shaping Filter
g (t)
T
Pulse
Shaping Filter
g (t)
T
Figure 2-1. Block diagram of a linear I/Q modulator.
24 Chapter 2
s(t)
~
A
Pulse
Shaping Filter
d
k
g (t)
T
~
Figure 2-2. Baseband block diagram of a linear I/Q modulator.
s(t)
2cos( 2Sf t )
0
1
B
H(f)
1
B
H(f)
s (t)
I
s (t)
Q
s(t)
~
-2sin( 2Sf t )
0
Figure 2-3. Block diagram of a linear I/Q demodulator (B is the signal bandwidth).
Probably the most popular truly I/Q modulation format is Quadrature
Amplitude Modulation (QAM) with a square W-point constellation (W-
QAM). Assuming that
2
Ww , we have
^
`
^`
,,
, 1,3, , 1 1,3, ,( 1)
Ik Qk
dd W wr r r r r !!, (2.12)
and therefore
2
1
2
3
d
W
A
. (2.13)
Whilst W-QAM is widely used in wireline modems, satellite communica-
tions more often rely on Phase Shift Keying (PSK) constellations. A W-PSK
constellation is defined by
2
j
e
m
W
k
d
S
½
°°
®¾
°°
¯¿
, (2.14)
2. Basics of CDMA for Wireless Communications 25
so that
2
1
d
A
. (2.15)
The two classes of PSK and QAM signals have a common element, since
the two formats of 4-QAM and 4-PSK (or Quadrature Phase Shift keying,
QPSK) are equivalent.
It can be shown [Pro95] that the Power Spectral Density (PSD) of a base-
band digital signal (expressed in
2
[V /Hz]
) is
2
1
sT
dd
s
f
fGf
T
PP , (2.16)
where
()
T
Gf is the frequency response of the pulse shaping filter (whose
impulse response is
()
T
g
t ), and where we have introduced the so called data
spectrum
j2
e
s
kT f
dd dd
k
fRk
f
S
f
¦
P (2.17)
as the Fourier transform of the (discrete time) data autocorrelation sequence
^
`
*
E
mmk
dd
Rk dd
. (2.18)
Assuming that the symbol rate
s
R
is much smaller than the carrier fre-
quency
0
f
, the PSD of a modulated signal such as (2.1) can be obtained
from that of the relevant complex envelope, as follows
00
1
4
ss s
f
ff ff ª º
¬¼
PP P. (2.19)
The power of the baseband signal is then
d
ss
P
ff
f
f
³
P
, (2.20)
whilst for the band pass signal we obtain from (2.19)
26 Chapter 2
d
2
s
ss
P
Pff
f
f
³
P
(2.21)
in agreement with (2.6).
The most naive data pulse is the rectangular shaping, whereby we have
rect
T
s
t
gt
T
§·
¨¸
©¹
(2.22)
and
sinc
Ts s
Gf T fT (2.23)
From the expression of the baseband PSD (2.16) we have that in the case
of rectangular shaping the signal bandwidth measured at the first spectral
null is given by
1
1/
s
tnull s s
B
RT . (2.24)
When bandwidth comes at a premium (as is always the case in wireless
communications) some form of band limiting is in order, and so rectangular
pulses are no longer used. Let us therefore introduce the Nyquist’s Raised
Cosine (RC) pulse defined as follows
2
cos /
sinc
12/
s
Nyq
s
s
tT
t
gt
T
tT
SD
§·
¨¸
D
©¹
(2.25)
whose spectrum is (see Figure 2-4)
11
,
22
1
2
111
1cos ,
222
1
0.
2
s
ss
s
Nyq
ss
s
s
Tf
TT
f
T
Gf f
TT
T
f
T
§·
D D
dd
°
¨¸
©¹
°
°
½
ªº
§·
D
°
S
°°
«»
¨¸
°
D D
°° °
©¹
«»
dd
®® ¾
«»
D
°° °
«»
°° °
«»
¬¼
¯¿
°
°
D
t
°
°
¯
(2.26)
2. Basics of CDMA for Wireless Communications 27
where
D
(with
01dDd
) is the roll off factor. The most popular band lim-
ited transmission pulse shape is the (
s
T
energy) Nyquist’s Square Root
Raised Cosine (SRRC), given in the frequency domain by
TsNyq
Gf TG f . (2.27)
The bandwidth occupancy of a baseband digital signal with SRRC shap-
ing is therefore (see Figure 2-4)
max
1
1
22
s
s
R
B
T
D
D (2.28)
and its
3
dB bandwidth is
3dB
1
22
s
s
R
B
T
. (2.29)
f
G
Nyq(f)
Ts
Nyquist
Frequency, 1/2T
s
Roll-off
Region D/T
s
Bandwidth
(1+D)/2T
s
Ts/2
Figure 2-4. Spectrum of the Nyquist’s SRRC pulse.
In the case of Spread Spectrum (SS) systems the bandwidth occupancy of
the transmitted signal is intentionally augmented well beyond the value re-
quired for conventional narrowband transmissions, and this can be essen-
tially accomplished in two ways.
The first one, at least from an historical perspective, dates back to 1941
and was conceived for providing secure military communications during
WWII. The basic idea underlying this early spread spectrum concept consists
in partitioning the overall spectrum into
K
separate channels or bands (also
referred to as frequency bins), all having the same bandwidth as the signal to
be transmitted. Spectrum spreading is achieved by transmitting the (conven-
28 Chapter 2
tional) narrowband signal into one bin for a given time interval
hop
T , and
then by randomly changing the carrier frequency of the modulator so as to
place the signal spectrum in another bin, and so forth. The final result is that
the signal spectrum ‘hops’ from bin to bin with an apparently casual pattern
to escape hostile jamming and/or eavesdropping by unauthorized listeners.
Owing to such a feature, this technique has been named Frequency Hopping
Spread Spectrum (FH/SS). Actually, the pattern of the frequency bins is not
truly casual, but it is instead pseudo-random (i.e., apparently random) and
repeats every
hop
KT seconds. The (periodic) frequency pattern is made
known also to the authorized receiver which is then capable of tracking the
transmitted carrier.
It turns out that the total bandwidth occupancy of this SS system is K
times that of the original narrowband signal. It is also apparent that the ro-
bustness of a FH/SS system against interference and unauthorized detection
increases with the length K of the frequency hopping pattern, i.e., with the
total occupied bandwidth. However, owing to strict requirements concerning
oscillator frequency stability and switching rate, FH/SS does not find signifi-
cant applications in multiple access commercial systems for mobile and cel-
lular communications, and therefore it will not be considered any further in
the following. The interested reader can find more details about the origins
of SS in [Sch82] and about FH/SS transmssion in [Sim85], [Dix94].
An alternative way of generating a SS signal consists of the direct multi-
plication, in the time domain, of the information bearing symbols, running at
the rate
1
s
s
R
T , with a sequence of binary symbols (chips) running at a
much higher rate
1/
cc
R
T (with
c
T the chip interval), and with a repetition
period
L [Dix94], [Pic82], [Sim85]. This multiplication, which is carried out
before transmit pulse shaping takes place, produces a stream of high rate
symbols running at the rate
c
R
the resulting signal to be transmitted turns
out to have a bandwidth occupancy wider than that of conventional modula-
tion schemes. For this reason the sequence of high rate chips is also referred
to as spreading sequence or spreading code, and this wideband transmission
technique is called Direct Sequence Spread Spectrum (DS/SS). This is the
most used spread spectrum signaling technique used in commercial commu-
nication systems. In the following we will therefore restrict our attention to
DS/SS transmission schemes.
Let us focus now on the analytical description of a DS/SS signal format
and on the relevant features [DeG96]. In the simplest arrangement the
spreading sequence has real-valued chips
k
c
selected at random in the binary
alphabet
{-1,1} (this is what is done, for instance, in the uplink of the
American cellular CDMA systems IS-95 or cdmaOne). Thus the spreading
code is random non-periodic. It may also be expedient to have a periodic
pseudo-random spreading code with a repetition length (repetition period)
2. Basics of CDMA for Wireless Communications 29
equal to L chips. When this short code arrangement is adopted (as for in-
stance in the UMTS downlink), the repetition period of the spreading se-
quence usually coincides with one symbol interval, i.e.,
s
c
TLT
. The re-
sulting DS/SS signal for the short code format is
^`
SS
LL
Tc
kk
k
s
tA d cgtkT
f
f
¦
, (2.30)
where we have introduced the following operators
^`
int
L
k
k
L
§·
¨¸
©¹
,
mod
L
kk L
. (2.31)
Figure 2-5 depicts the DS/SS transmitter described by (2.30), in which
the amplitude coefficient A has the same meaning as in Figures 2-1 and 2-2.
It can be shown, in fact, that the PSD of the DS/SS signal is given by the
convolution between the narrowband PSD of the data and the wideband PSD
of the spreading sequence, and that the power of the DS/SS signal is exactly
the same as the power
s
P
of the narrowband signal.
s (t)
A
L
c
k
Chip Pulse
Shaping Filter
(ss)
d
m
~
g (t)
T
1/T
s
1/T
c
1/T
c
1/T
c
~
Figure 2-5. Baseband block diagram of a DS/SS transmitter.
It is apparent that the sections of the DS/SS transmitter in Figure 2-5 are
the same as those in Figure 2-2, provided that the chip rate
1/
cc
R
T
is ex-
changed with the symbol rate
s
R
. In particular, the chip shaping filter in
Figure 2-5 outputs a new
c
T energy pulse ()
T
g
t every
c
T seconds. The in-
dex
k ticks at the rate
c
R
, the chips’ subscript
||
L
k
repeats every
L
chip in-
tervals, and the data symbols subscript
{}
L
k
ticks at the rate
cs
LR R
as it
should. In the case of a DS/SS transmission with rectangular shaping, the
pulse (2.22) then becomes
rect
T
c
t
gt
T
§·
¨¸
©¹
, (2.32)
30 Chapter 2
and the bandwidth occupancy (2.24) must be modified accordingly,
SS
1
1
st null c
c
BR
T
. (2.33)
Apart from some particular applications, mainly military and the Global
Positioning System (GPS), the spectrum of the DS/SS signal will be strictly
limited. This can be achieved by resorting to Nyquist’s SRRC shaping of the
chip pulses. These pulses are described by (2.25)
(2.27) where the symbol
duration
s
T must be replaced with the chip interval
c
T . Similarly the band-
widths (2.28) and (2.29) modify as follows
SS
max
1
1
22
c
c
R
B
T
D
D
, (2.34)
SS
3dB
1
22
c
c
R
B
T
, (2.35)
respectively. After spreading and chip pulse shaping, the baseband signal
(2.30) is eventually upconverted to RF and transmitted using a pair of I/Q
carriers as in Figure 2-1.
2. PROPERTIES OF SPREAD SPECTRUM
SIGNALS
We generalize now the DS/SS signal format (2.30), by allowing in par-
ticular that the code repetition length L be different from the so called
spreading factor
s
c
cs
TR
M
TR
(2.36)
We obtain thus the following expression [DeG96]
^`
SS
M
L
Tc
kk
k
s
tA d cgtkT
f
f
¦
, (2.37)
2. Basics of CDMA for Wireless Communications 31
where, according to the definitions (2.31), the subscript
{}
M
k of the data
symbols is now updated every
M
ticks of the index
k
. This is the most
general form of a DS/SS signal.
We also remark that for any of the bandwidth definitions presented above
we have
SS
B
M
B
. (2.38)
Therefore the parameter
M
can be seen as the ratio between the band-
width occupancy of the SS signal
SS
B
and the bandwidth
B
of the conven-
tional narrowband signal. This is why we called M the spreading factor, that
represents one of the main parameters characterizing the properties of a SS
signal. Figure 2-6 shows the PSD of a code for DS/SS transmissions with
spreading factor
8M compared with the PSD of a conventional narrow-
band signal with rectangular pulse shaping. If one symbol interval spans ex-
actly an integer number
n of the spreading sequence repetition periods,
s
c
TnLT , (2.39)
then the spreading sequence is termed short code and the spreading factor is
M
nL . Otherwise, if the repetition period of the spreading sequence is
much longer than the symbol duration,
cs
LT T , then the sequence is
called long code and the spreading factor is
M
L . As a particular case of
short code spreading we have the simplest configuration with
1n
men-
tioned in the previous section, where the code repetition period is exactly co-
incident with one symbol interval, i.e.,
M
L .
One other important parameter of SS signals is the processing gain
p
G ,
which is often confused with the spreading factor, and which actually has to
do with the anti-jam capability of the receiver. The processing gain is de-
fined as the ratio between the chip rate and the information bit rate
cb
p
bc
R
T
G
R
T
. (2.40)
Recalling that
2
/log ( )
sb
R
RW , it is easy to derive the relationship be-
tween spreading factor and processing gain
2
log
p
M
GW . (2.41)
32 Chapter 2
A widely used method for the generation of a binary spreading sequence
{}
k
c
is based on an m stage Linear Feedback Shift Register (LFSR) used as
a binary sequence generator. The feedback taps of the circuit are properly set
to yield a sequence with particular features which are desirable for SS
transmissions [Dix94], [Pic82], [Sim85], [Din98]. According to the polyno-
mial theory [Pet72], it is possible to select the feedback taps so as to obtain a
sequence with the longest possible repetition period
21
m
L and good
correlation properties [Sar80], the so called maximal length or m-sequences.
Tables for the configurations of m-sequence generators are easily found in
the literature [Dix94], [Pic82]. In an m-sequence the number of logical ‘0’s
and ‘1’s is
1
21
m
and
1
2
m
, respectively [Dix94]. Since in all practical
cases we have 1
L the occurrence rate of each symbol is virtually the
same within each period, so that such sequences are called
balanced. A
deeper analysis of the location of ‘0’s and ‘1’s within one period also reveals
that the blocks of consecutive identical symbols (the so called
runs) follow a
given distribution that makes the appearance of the sequence similar to that
of a truly random one [Dix94]. Owing to these properties a sequence of this
kind is also named
Pseudo-Random Binary Sequence (PRBS).
1211109876543210
Normalized Frequency , fTs
N
o
r
m
.
P
S
D
s
1.2
1.0
0.8
0.6
0.4
0.2
0.0
-0.2
1211109876543210
Normalized Frequency
Spreading Code PSD
Data PSD
.
P
S
D
s
Figure 2-6. PSD of a spreading code for DS/SS transmissions, M=8.
Concerning correlation properties, we define first the following periodic
cross-correlation
sequence between the two generic binary sequences {}
k
a
and {}
k
b , ,{-1,+1}
kk
ab
1
0
1
L
L
ab k
ki
k
Ri ab
L
¦
. (2.42)
2. Basics of CDMA for Wireless Communications 33
We will also denote the zero lag correlation as
0
ab ab
RR (2.43)
The (periodic) autocorrelation sequence of the sequence
{}
k
c is also
given by
1
0
1
L
L
cc k
ki
k
Ri cc
L
¦
. (2.44)
We can easily show that the autocorrelation sequence of an
m-sequence is
10,
10.
cc
i
Ri
Li
®
z
¯
(2.45)
Such an autocorrelation function is similar to that of a delta-correlated
white noise process. Therefore, owing to this ‘noise-like’ behavior, such se-
quences are also referred to as
Pseudo-Noise (PN).
In the spreading arrangement (2.30) discussed above the spreading code
symbols
k
c
are real-valued, and therefore such an SS scheme is referred to
as
Real Spreading (RS). In particular, if the data
k
d
are complex-valued the
SS format in (2.30) is called
Quadrature Real Spreading (Q-RS).
This scheme is probably the most intuitive, but it is not the only one. Fur-
ther spreading schemes involving different spreading codes for the I/Q com-
ponents are used in the practice. For instance, if we let (see Figure 2-7)
^` ^`
SS
,, , ,
j
MM
LL
Tc
Ik Ik Qk Qk
k
s
tA d c d c gtkT
f
f
¦
(2.46)
we have two information bearing symbol streams
^`
,
{}
M
Ik
d ,
^`
,
{}
M
Qk
d and
two distinct spreading sequences
,
{}
L
Ik
c ,
,
{}
L
Qk
c . As a consequence the
complex spreading scheme (2.46) can be seen as a combination of two RS
schemes operating independently, the one for the I-, and the other for the Q-
finger, respectively. This is called
dual Real Spreading (d-RS) since it uses
two different code sequences to independently spread two different data
streams. By replicating the same data stream on both the I- and Q-finger of
(2.46), we can derive a particular case of spreading,. i.e.,
^` ^` ^`
,,
M
MM
Ik Qk k
ddd (2.47)
34 Chapter 2
with
{}
M
k
d real-valued, thus obtaining
^`
SS
,,
j
M
LL
Tc
kIk Qk
k
s
tA d c c gtkT
f
f
¦
. (2.48)
s (t)
M
c
Chip Pulse
Shaping Filter
(ss)
d
I,m
g (t)
T
1/T
s
1/T
c
1/T
c
1/T
c
~
M
Chip Pulse
Shaping Filter
d
Q,m
g (t)
T
1/T
s
1/T
c
1/T
c
1/T
c
I,k
c
Q,k
A
Figure 2-7. Baseband block diagram of a DS/SS transmitter
employing two spreading sequences.
The latter SS format is named Complex Spreading (CS) since it uses a
complex-valued sequence to spread a stream of real-valued symbols. A per-
formance comparison among the different spreading schemes outlined above
will be presented in a subsequent Section.
Now, let us focus our attention on the
detection of a DS/SS signal. The
simplified architecture of an I/Q receiver for a DS/SS signal is shown in Fig
2-8. The received signal undergoes I/Q baseband conversion by means of a
front end such as the one depicted in Figure 2-3. Assuming for simplicity a
DS/SS like in (2.30), the signal after baseband conversion is (perfect carrier
recovery)
^`
M
L
Tc
kk
k
rt A d c g t kT wt
f
f
¦
, (2.49)
where
()wt
is Additive White Gaussian Noise (AWGN) representing the
complex envelope of the channel noise affecting the modulated signal. The
noise process can be expressed as
j
IQ
wt w t w t
'
, (2.50)
2. Basics of CDMA for Wireless Communications 35
where
()
I
wt and ( )
Q
wt are two baseband signals representing the in phase
and quadrature components, respectively, of the AWGN process. Such com-
ponents are independent, zero mean, white Gaussian random processes with
two-sided PSD
0
IQ
ww
f
fN PP
. (2.51)
M
c
Chip Pulse
Matched Filter
g (t)
R
6
1
M
mT
c
d
I,k
^
I,m
M
c
Chip Pulse
Matched Filter
g (t)
R
6
1
M
mT
c
d
Q,k
^
Q,m
r(t)
2cos( 2Sf t )
0
-2sin( 2Sf t )
0
Figure 2-8. Block diagram of a DS/SS receiver.
After baseband conversion each component of the complex-valued re-
ceived signal (2.49) is passed through a filter matched to the chip pulse
shape (Chip Matched Filter, CMF). Assuming Nyquist’s SRRC chip pulse
shaping, the I and Q receive filters have frequency response given by
/
R
Nyq c
Gf G fT
(2.52)
The filtered signal is then
^`
M
L
Nyq c
kk
k
yt A d c g t kT nt
f
f
¦
, (2.53)
where we have introduced the (chip time) Nyquist’s RC pulse (see (2.52)
and (2.27))
Nyq T R
g
tgtgt (2.54)
36 Chapter 2
and we have defined the filtered zero mean Gaussian noise process
R
nt wt g t
(2.55)
with
denoting convolution. The signal output by the filter is then sampled
at chip rate. In the case of perfect chip clock recovery, the sampling instants
are
mc
tmT and the resulting chip rate digital signal is
^`
M
L
m m Nyq c m
kk
k
yyt A d cg mkTn
f
f
ªº
¬¼
¦
. (2.56)
The noise component in (2.56) is defined as
,,
j
mIm Qm m
nn n nt
, (2.57)
whose I/Q components (
,,
,
I
mQm
nn) are independent identically distributed
zero mean Gaussian random variables with variance
22
I
Q
nn
V V given by (see
(2.51))
22
2
0
0
dd
II
nw R R
c
N
fGffNGff
T
ff
f f
V
³³
P
. (2.58)
Recalling the features of the Nyquist’s RC pulse (2.25), we remark that
[( ) ]
Nyq c
g
mkT
is zero for
mkz
and is 1 when
mk
(Nyquist-1 pulse)
and we are left with
1
L (2.59)
The receiver generates a replica of the spreading sequence used by the
transmitter (the co called
replica code), and executes the product between
the chip rate samples
m
y
and the chips of such local code replica to ‘re-
move’ the code from the received signal. In practice this is equivalent to the
operation of
despreading carried out by conventional analog SS receivers.
After multiplication (despreading) the samples are accumulated over an
M-
symbol long window and finally downsampled at symbol rate
s
R
to yield the
decision strobes
k
z
for data detection
1
1
L
kM M
km
m
mkM
zyc
M
¦
. (2.60)