Báo cáo khoa học: " Evaluation of serum chondroitin sulfate and hyaluronan: biomarkers for osteoarthritis in canine hip dysplasia" pps
Bạn đang xem bản rút gọn của tài liệu. Xem và tải ngay bản đầy đủ của tài liệu tại đây (413.39 KB, 9 trang )
JOURNAL OF
Veterinary
Science
J. Vet. Sci. (2008), 9(3), 317
325
*Corresponding author
Tel: +66-53-948046; Fax: +66-53-274710
E-mail:
Evaluation of serum chondroitin sulfate and hyaluronan: biomarkers
for osteoarthritis in canine hip dysplasia
Korakot Nganvongpanit
1,2,
*
, Akanit Itthiarbha
2
, Siriwan Ong-Chai
2
, Prachya Kongtawelert
2
1
Department of Veterinary Preclinical Science, Faculty of Veterinary Medicine, Chiang Mai University, Chiang Mai 50100,
Thailand
2
Thailand Excellence Center for Tissue Engineering, Department of Biochemistry, Faculty of Medicine, Chiang Mai
University, Chiang Mai 50200, Thailand
Hip dysplasia (HD) is one of the most important bone and
joint diseases in dogs. Making the radiographic diagnosis is
sometime possible when the disease has markedly
progressed. Chondroitin sulfate (CS) and hyaluronan (HA)
are the most important cartilage biomolecules that are
elevated in the serum taken from dogs with osteoarthritis.
The serum CS and HA can be detected by an ELISA
technique, with using monoclonal antibodies against CS
epitope 3B3 and WF6 and the HA chain as the primary
antibodies. The aim of this study was to compare the levels
of serum CS (both epitopes) and HA in non-HD and HD
dogs. All 123 dogs were categorized into 2 groups. The
non-HD group was composed of 98 healthy dogs, while the
HD group was comprised of 25 HD dogs. Blood samples
were collected for analyzing the serum CS and HA levels
with using the ELISA technique. The results showed that
the average serum level of the CS epitope WF6 in the HD
group (2,594
±
3,036.10 ng/ml) was significantly higher
than that in the non-HD group (465
±
208.97 ng/ml) (p
<
0.01) while the epitope 3B3 in the HD group (105
±
100.05
ng/ml) was significantly lower than that in the non-HD
group (136
±
142.03 ng/ml) (p
<
0.05). The amount of serum
HA in the HD group (134.74
±
59.71 ng/ml) was lower than
that in the non HD group (245.45
±
97.84 ng/ml) (p
<
0.05).
The results indicate that the serum CS and HA levels might
be used as biomarkers for osteoarthritis in HD dogs.
Keywords:
biomarker, chondroitin sulfate, dog, hip dysplasia,
osteoarthritis
Introduction
Many studies have been done to understand the
mechanism of cartilage degradation in joint disease and to
assess changes in the cartilage metabolism in vivo. In vitro
studies have enormously increased our understanding of
how cytokines or growth factors influence cartilage
metabolism, but it is obviously important to develop the
means of studying and understanding cartilage metabolism
in vivo to determine how the cartilage metabolism changes
in a disease state. Moreover, an in vivo approach may also
help us determine whether therapeutic interventions have
beneficial or negative effects on cartilage metabolism.
Articular cartilage is a metabolically-active structure that
is specifically designed to accommodate the tensile and
compressive forces generated within the joint. This
cartilage is composed of cells named chondrocytes, and
these cells produce the extracellular matrix (ECM). The
biochemical properties of cartilage and the physical
function of joints are critically dependent on the integrity
of the matrix. The ECM molecules in cartilage include
proteoglycan (PG), hyaluronan (HA), glycoprotein and
type II collagen. Proteoglycans are a family of glycocon-
jugates with a central core protein to which one or more
glycosaminoglycan (GAG) side chains are covalently
linked post-translationally [62]. In addition, most of the
PGs exist as aggregates that are formed by the non-
covalent association of proteoglycan with HA and linked
protein [22]. Among the PGs in cartilage, the most crucial
for the proper functioning of articular cartilage is aggrecan,
which is one of the large aggregating chondroitin sulfates
(CSs) [28]. CS consists of an alternating sequence of
D-glucoronate and N-acetyl-D-galactosamine-4/6-sulfate
residues that are linked through alternating bonds [56].
Although the CSs are often referred to as if they were a
homogenous substance, their polysaccharide chains are
comprised of several unique, but structurally similar
disaccharides; the most abundant are CSs, which are
typically chondroitin-4-sulfate and chondroitin-6-sulfate.
The CS is a heterogenous group of compounds that have
different molecular masses (15,000-25,000 kDa) and
electric change densities [27], and CSs are an essential
318 Korakot Nganvongpanit et al.
component of the connective tissue ECM, including the
hyaline cartilage, and the CSs provide elasticity and other
functions.
The HA is a ubiquitous component of the ECM of most
animal tissues. A high molecular weight (300-2,000 kDa)
member of the polysaccharides group is termed GAG [39].
HA is a linear macromolecule that is composed of a repeating
disaccharide units: β-1,4-glucuronic acid-β-1,3-N-acetyl-
D-glucosamine [16]. HA is mainly produced by fibroblasts
and other specialized connective tissue cells. Although HA
is widely distributed throughout the body (umbilical cord,
nasal cartilage, vitreum, cutis or lymph of the thorax), the
highest concentration is found in synovial fluid and also
connective tissue such as the synovial membrane [31]. Its
production has been linked to a variety of diseases [30].
Hip dysplasia (HD) is the abnormal development of the
coxofemoral joint [38]. The disorder has been reported in
humans and most domestic animals. The first report of HD
in dogs was published in 1935. This disorder has become
one of the most commonly diagnosed orthopedic diseases
in dogs [25]. A study in 2003 showed that the prevalence of
HD was 19.3% in the general population of pet dogs. The
percentage of dysplasia for these breeds in that study was
35.4% for Rottweilers, 32.9% for German Shepherds,
30.3% for Golden Retrievers and 27% for Labrador
Retrievers [53]. Moreover, the majority of the HD dogs
(80%) had osteoarthritis (OA) [59]. So far, the initiating
factors are unknown, and the rate and extent of the
development of HD disease are variable, but the risk
factors are both genetic [33] and environmental [11]. As
mentioned above, most of the dogs with HD in the above
mentioned study also had OA, but the standardized
diagnostic protocol consists of the clinical sign, a physical
examination and evaluation of the radiographic results,
which can not detect OA in its early stages [42,45].
Moreover, many factors influence the radiographic
diagnosis, such as the dog’s position during X-ray, the
beam direction, the film quality, the development process
or the severity of the disease [45] and most cases require
contrast medium for making the final diagnosis [1].
The OA is defined as a non-inflammatory, degenerative
joint disease that’s characterized by the loss of articular
cartilage, subchondral osteosclerosis and marginal
hypertrophy of bone; this is accompanied with pain and
soft tissues stiffness that’s aggravated by prolonged
activity [41]. The collagen framework becomes disrupted,
and the PG content of the articular cartilage diminishes,
particularly near the articular surface. PG fragments that
contain CS and keratin sulfate (KS), as well as the
breakdown products of type II collagen, are liberated in
increased concentrations to reach the synovial fluid and
ultimately the serum [5,21,34].
Biomarkers have been widely used to monitor disease
activity, to predict disease progression and to study the
effects of novel therapeutic interventions in a variety of
joint diseases [9,10,36,37,40,48,61]. Biomarkers have also
been used in a variety of species such as dogs [10,21,
51,52], horses [17,44,47], mice [19] and rabbits [29]. Most
of the biomarkers used in joint disease are the articular
cartilage components such as CS [5,10,13], KS [5], HA
[6,10,19,34] or collagen type II [23]. It is well recognized
that the early stages of cartilage degradation and
osteoarthritis are difficult or impossible to define
diagnostically. In normal cartilage metabolism, the balance
between catabolism and anabolism is necessary for
maintenance of the cartilage’s function [12]. This
metabolism changes when the joint environment is
interrupted by factors such as chemical or physical effects.
The biomolecules are upregulated via synthesis from the
chondrocytes to restore the balance between catabolism
and anabolism in the initial phase. For this process, many
biomarkers such as matrix metalloprotease-3 or tissue
inhibitor of metalloprotease-1 [21] and CS epitope 3B3 [43]
were found to be at higher concentrations. In this disease
state, the articular cartilage is highly degraded, and the joint
develops OA if the balance is not recovered in the last phase
[48,54]. Some biomolecules were elevated in this phase:
KS [51] and CS epitope WF6 [43]. Those biomarkers are
first released into the synovial fluid and then into the blood
stream via the lymph system [63]. In the studies concerned
with joint clearance, a considerable amount of the labeled
radioactive GAG that was injected into the joint cavity was
released into the blood within a few hours [3]. Thus, the
determination of those bio- molecular levels in the serum
may allow assessment of the joint tissue metabolism.
Regarding the GAG levels in OA, it was noted that horses
with OA showed high GAG levels in the synovial fluid as
well as in the serum [2]. The advantage of serum
measurement is the ease of collecting the sample, and
especially in small animals such as dogs or cats.
The diagnosis of OA is generally based on the clinical and
radiographic changes that occur in the later stages of the
disease. In the present study, we sought to investigate
aggrecan (CS epitope 3B3 and WF6) and HA metabolism
in HD dogs. We report here on the use of CS (3B3 epitope
and WF6) and HA as biomarkers for OA in HD dogs. A
novel monoclonal antibody (WF6), which recognizes a
native epitope in CS chains, was evaluated together with
using a monoclonal antibody 3B3, which recognizes
unsaturated terminal chondroitin 6-sulfate after
chondroitinase ABC digestion [13,15,49].
Materials and Methods
Animals
One hundred and twenty three native Thai dogs, 2-5 years
old, were categorized into 2 groups. Ninety eight dogs
were non-HD group consisting of 43 male and 55 female.
Biomarkers for osteoarthritis in canine hip dysplasia 319
They were 43.9 ± 11.2 months old and their body weight
were 16.8 ± 6.1 kg. The other group had 25 dogs which was
HD group consisting of 15 male and 10 female. They were
45.8 ± 10.2 months old and their weight were 17.8 ± 7.2 kg.
The relationship between body weight and the serum
biomarker was examined by dividing, the non-HD group
into 5 subgroups according to their body weight: group 1
(less than 10 kg, n = 15), group 2 (from 10 kg to less than
15 kg, n = 30), group 3 (from 15 kg to less than 20 kg, n =
28), group 4 (from 20 kg to less than 25 kg, n = 15) and
group 5 (greater than or equal to 25 kg, n = 10), respectively.
However, HD group did not divide into subgroups and
investigate the relationship between gender, weight and
serum biomarker. Because of the biomarkers in all animals
were changed according to the progress of disease.
All the animals had their age and weight recorded. In the
non-HD group, 98 non-HD dogs were diagnosed based on
signalments, physical examination and gait analysis [48],
and they were radiographed using the standard position
[15]; the phenotypic evaluation of the hips was done
according to the Orthopedic Foundation for Animals
(USA), in which the animals fall into seven different
categories. Those categories are normal (excellent, good,
fair), borderline, and dysplastic (mild, moderate, severe).
The HD group consisted of 25 HD dogs that were
diagnosed according to their clinical signs. Radiography
was used for the final diagnosis. Briefly, for the
radiographic evaluation, the dogs underwent radiographic
examinations, and a ventrodorsal projection of the
coxofemoral joints was retrieved. Evaluation for the
proper radiographic technique was conducted. The
diagnostic studies we considered were those in which the
entire well-positioned pelvis was included. For these
diagnostic studies, the obturator foramina were symmetri-
cal and the femora were positioned to allow for accurate
assessment of the femoral head and neck area. All the dogs
in the HD group were classified as the severe grade.
Briefly, for the radiographic findings of moderate to severe
grade HD, there is significant subluxation present, where
the femoral head is barely seated into the shallow socket,
and this causes joint incongruence. There are secondary
arthritic bone changes, usually along the femoral neck and
head (termed remodeling), acetabular rim changes (termed
osteophytes or bone spurs) and various degrees of
trabecular bone pattern changes, and this is called
sclerosis. For a severe grade of HD, there is significant
subluxation present, where the femoral head is partly or
completely dislocated from the shallow socket. There are
also large amounts of secondary arthritic bone changes
along the femoral neck and head, acetabular rim changes
and large amounts of abnormal bone pattern changes.
Blood collection
Ten milliliter blood samples were collected from the
cephalic vein of each dog. All the blood samples were
taken in the morning before feeding the dogs. Two
milliliters of the blood samples from each dog were kept in
anticoagulant (100 IU/ml heprin; APS Finechem, Australia)
for the complete blood count (CBC). Eight milliliters of the
blood samples were centrifuged at 10,000 × g for 15 min to
obtain the serum and this was kept frozen at -20
o
C until
blood chemical tests and biomarker assay were performed.
Hematology and biochemistry
The biochemical analyses, CBCs and blood chemistry
tests were conducted at the Small Animal Hospital, Faculty
of Veterinary Medicine, Chiang Mai University, Chiang
Mai, Thailand. The blood samples were analyzed for the
CBC, including the hematocrit, the haemoglobin level, the
red blood cell count and white blood cell count (WBC) and
the platelet count. Two milliliters of serum were analyzed
for blood chemicals, including aspartate aminotransferase,
alanine aminotranferase, blood urea nitrogen and creati-
nine.
Biomarker assay
The biomarker assay that uses ELISA follows a previous
study that was done by our research group [46,49,50]. Prior
to performing competitive immunoassay with monoclonal
antibody 3B3 (Seikagaku, Japan), the samples (175 μl of
serum) were digested with using chondroitinase ABC
(Sigma-Aldrich, USA) [an equal volume of 0.1 U/ml (in
chondroitinase ABC buffer: 0.1 M sodium acetate, 1.0 M
Tris-HCl, pH 7.3)]; they were incubated at 37
o
C overnight,
followed by heating at 100
o
C for 10 min. The digested
samples were spun in a microcentrifuge for 10 min to
remove any precipitated protein and the supernatants were
then collected and analysed.
ELISA-based assay for the chondroitin sulfate 3B3
epitope
The quantitative ELISA for the epitopes recognized by
monoclonal antibody 3B3 was modified from an assay that
was originally developed for synovial fluid [20]. The
samples from the chondroitinase ABC-digested human
serum were diluted in TE buffer (0.1 M Tris HCl (pH 7.4),
0.15 M sodium chloride, 0.1% Tween 20 and 0.1% BSA)
and the samples were then were mixed with an equal
volume of monoclonal antibody 3B3 (from ascites fluid,
diluted 1:10,000 in TE buffer) in 1.5 ml plastic tubes;
they were then incubated at 37
o
C for 1 h. The samples were
added to microplate wells that were previously coated with
porcine laryngeal aggrecan core protein (100 μl/well: 77
ng/ml), and they were blocked with 1% BSA and then
incubated at 37
o
C for a further 1 h. The wells were washed
3 times with TE buffer, and peroxidase conjugated
anti-mouse IgM antibody (Sigma-Aldrich, USA) was
added (100 μl/well of a 1:1,000 dilution in TE buffer) and
320 Korakot Nganvongpanit et al.
then the samples were allowed to incubate at 37
o
C for a
further 1 h. The bound peroxidase was detected by adding
o-PD substrate (100 μl/well in citrate buffer, pH 5.0). The
reaction was stopped with adding 50 μl/well of 4 M
sulfuric acid and the absorbance was determined using a
microplate reader at a dual wavelength of 492/690 nm.
Measurement of the absorbance ratio at the two
wavelengths reduced any well-to-well difference of
non-specific interference, which can cause absorption at
both wavelengths. The standard used was porcine
aggrecan core protein (chondroitinase ABC-digested
porcine laryngeal cartilage aggrecan) at various
concentrations (4-2,000 ng/ml) The concentration of the
3B3(+) epitope in the supernatant samples was calculated
from the standard curve.
ELISA-based assay for the chondroitin sulfate WF6
epitope
A quantitative 2-step ELISA was developed based on the
results from an initial study that characterised the epitopes
recognized by monoclonal antibody WF6 [60]. Diluted
human serum samples (1:5 in 6% BSA-TE buffer) were
added to 1.5 ml plastic tubes that contained an equal
volume of monoclonal antibody WF6 (cell culture
supernatant, 1:200 dilution in the TE buffer). The
standard we used was embryonic shark skeletal cartilage
aggrecan (the A1D1 fraction) at different concentrations
(19-10,000 ng/ml) of 6% BSA in the TE buffer. After
incubation at 37
o
C for 1 h, the samples (or standard) mixed
with WF6 were added to the microtitre plate, which was
previously coated with shark skeletal aggrecan (the A1
fraction) (100 μl/well: 10 ug/ml), and the samples were
blocked with 1% BSA. The plates were incubated at 37
o
C
for 1 h and the wells were then washed with the TE buffer;
peroxidase conjugated anti-mouse IgM antibody (Sigma-
Aldrich, USA) was then added (100 ml/well; 1:2,000
dilution in the TE buffer). After incubation at 37
o
C for a
further 1 h, the amount of bound peroxidase was
determined with using o-PD substrate (Sigma-Aldrich,
USA) and the plates were read at 492/690 nm, as was
described above. The concentration of the epitope WF6 in
the samples was calculated from the standard curve.
ELISA-based assay for hyaluronan
An ELISA was developed for performing hyaluronan
assay in serum, and this was based on previous work with
HA binding proteins [32]. Human serum samples or
standard HA (Healon; Pharmacia Pharmaceutical AB,
Sweden) at various concentrations (19-10,000 ng/ml in 6%
BSA-PBS pH 7.4) were mixed with an equal volume of
bovine articular cartilage-biotinylated HABPs (1:200 in
0.05 M Tris- HCl buffer, pH 8.6). After incubation at room
temperature for 1 h, the samples (100 μl) were added to
microplate wells, which were previously coated with
human umbilical cord HA (Sigma-Aldrich, USA) (100
μl/well of 10 μg/ml); they were then blocked with 1% BSA
(150 μl/well). After further incubation at room temperature
for 1 h, the wells were washed with PBS-Tween buffer, and
peroxidase conjugated anti-biotin antibody (Zymed, USA)
(1:2,000 dilution, 100 μl/well in PBS) was added next.
The plate was incubated at room temperature for a further
1 h and the bound peroxidase was determined with using
o-PD substrate. The plates were read at 492/690 nm, as was
described above. The amount of HA in the samples was
calculated from the standard curve.
Statistical analysis
The CS and HA data from the serum are reported as means
± SD. The non-parametric 2-sample Mann-Whitney
procedure was used to test for differences between the
non-HD and HD groups. Paired t-tests were performed to
test the (one-tailed hypothesis that 1) the biomarker levels
(CS and HA) depended on the dogs’ weights in the non-HD
group and 2) the biomarker levels in the males were
different from that in the females. The relative data was
analyzed using the Statistical Analysis System version 8.0
(SAS Institute, USA) software package. p values less than
0.05 were considered to be significant.
Results
Hematology and biochemistry
Table 1 shows the mean values for non-HD and HD
group. Most of the values were not significantly different
between the non-HD and HD group (p > 0.05). The WBC
in the HD group was increased when compared to that of
the non-HD groups (p < 0.05). This increase came from
the total number of neutrophils, which was significantly
higher in the HD group (p < 0.05), while the other cell
numbers (lymphocytes, monocytes, eosinophils and
basophils) were not different between the groups (p >
0.05).
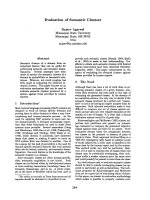
The level of serum CS (epitope WF6 and 3B3) and
HA in the serum
All the dogs in the HD group were diagnosed as having
hip dysplatic, but they were not categorized into different
pathological stages (mild, moderate, severe). The level of
CS epitope 3B3 in the HD group (105 ± 100.05 ng/ml) was
significantly (p < 0.05) lower than that in the non-HD
group (136 ± 142.03 ng/ml). Yet the level of CS epitope
WF6 in the HD group (2,594 ± 3,036.10 ng/ml) was
significantly (p < 0.01) higher than that in the non-HD
group (465 ± 208.97 ng/ml). The level of HA in the HD
group (134.74 ± 59.71 ng/ml) was lower than that in the
non-HD group (245.45 ± 97.84 ng/ml) (p < 0.05), as is
shown in Fig. 1.
Biomarkers for osteoarthritis in canine hip dysplasia 321
Tabl e 1. Comparison of complete blood counts and blood chemistry between the non-hip dysplasia (HD) and HD groups
Normal range
†
HD group Non-HD group p-value
‡
Hematocrit (%) 22.5-57.5 36.82 ± 4.25 32.76 ± 2.25 0.1554
Hemoglobin (g/dl) 7.7-20.6 16.44 ± 2.98 15.15 ± 3.54 0.4436
WBC count (cell/μl) 6,000-33,700 27,947 ± 932.23 20,190 ± 591.61 0.0145*
Neutrophil (%) 0-78 49.44 ± 12.01 41.83 ± 8.38 0.0381
Lymphocyte (%) 19-76 40.06 ± 9.65 43.11 ± 10.95 0.4587
Monocyte (%) 0-33 5.30 ± 1.20 8.06 ± 1.43 0.0588
Eosinophil (%) 1-40 4.30 ± 1.18 6.33 ± 1.94 0.1757
Basophil (%) 0-1 0.80 ± 0.21 0.67 ± 0.12 0.4493
AST (U/l) 13-131 74.10 ± 21.02 70.67 ± 15.21 0.7635
ALT (U/l) 1-150 78.8 ± 18.73 87.94 ± 20.41 0.4736
BUN (mg/dl) 3-41 21.90 ± 7.94 25.81 ± 8.69 0.2941
Creatinine (mg/dl) 0.18-2.76 1.00 ± 0.56 0.92 ± 0.22 0.5676
*
The significant difference (p < 0.05) between the non-HD and HD groups.
†
Cited from Kaewsakorn et al. [26].
‡
The p-values between the
HD and non-HD groups. AST: aspartate aminotransferase, ALT: alanine aminotranferase, BUN: blood urea nitrogen. Data are expressed as
mean ± SD.
Fig. 1. The levels of serum chondroitin sulfate epitope 3B3 (A) and WF6 (B) and hyaluronan (C) in the non-hip dysplasia (HD) group
compared to the HD group. Data show the mean ± SD.
*
The significant difference (p < 0.05) between the non-HD and HD groups.
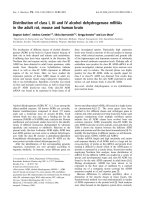
The relationship between gender, body weight and
serum biomarker levels in the non-HD group
The average body weight in each subgroup was
significantly different (p < 0.05, data not shown). Most of
the HD dogs (44%) were 20-25 kg for their body weight,
and none were less than 10 kg. The level of all the
biomarkers in the different weight subgroups was not
significantly different (p > 0.05) among the 5 subgroups
(Fig. 2). Moreover, those biomarker levels were also not
significantly different (p > 0.05) between the male and
female dogs (Fig. 3).
Discussion
The present study showed that HD dogs have the highest
level of serum CS epitopes WF6, which means the
cartilage in the HD joint was degraded and it developed
into OA. We found the level of CS epitope WF6 in the HD
group to be 150% higher, while epitope 3B3 in the HD
group was 30% lower than that of the non-HD group. In
agreement with the review by Nganvongpanit and
Ong-Chai [43] the levels of those biomarkers in chronic
OA changed in the same way. The study that was done by
Peansukmanee et al. [47] found that the level of CS epitope
WF6 was higher in OA horses, but the CS epitope 3B3 was
322 Korakot Nganvongpanit et al.
Fig. 2. The levels of serum chondroitin sulfate epitope 3B3 (A)
and WF6 (B) and hyaluronan (C) in the non-hip dysplasia group.
This group was categorized into 5 different subgroup due to
b
od
y
weight such as group 1 (less than 10 kg, n = 15), group 2 (from 10
kg to less than 15 kg, n = 30), group 3 (from 15 kg to less than 20
kg, n = 28), group 4 (from 20 kg to less than 25 kg, n = 15) and
group 5 (greater than or equal to 25 kg, n = 10). No significant
difference (p > 0.05) was observed among the subgroups.
lower when compared with that of the non-OA horses.
Moreover, the level of CS epitope 3B3 rose not only in the
early phase of OA, but also in young animals as compared
with the mature animals [47]. It can be stated that the CS
epitope 3B3 responds to the cartilage anabolism. Coincid-
ing with these previous results, the level of CS epitope 3B3
in the HD dogs was lower than that in the non-HD dogs.
This shows that the metabolism of articular cartilage in HD
doesn’t involve the synthesis of new CS molecules. Hence,
the cartilages become highly degraded and this then causes
severe disease.
HA is one of the ECM molecules of the articular cartilage.
Previous studies have shown that HA can be used as a
biomarker in OA dogs [4,10,34] and rheumatoid disease
[4,46]. Our study demonstrates for the first time the
determination of the serum HA levels in HD dogs. We
observed that the level of HA in the HD group was 45%
lower than that in the non-HD group. This result is the same
as the previous work on inflammatory joint disease: the HA
concentration in the joint fluid and serum of animals with
diseased joints has been reported to be lower than normal
[14,35]. However, many studies have shown the
relationship between the HA level in serum and liver
disease [18,60] because the major site of metabolism for
circulating HA is the liver. The lysosomes of the liver
endothelial cells produce the enzymes hyaluronidase,
β-glucuronidase and β-N-acetylglucosaminidase, and
these are responsible for metabolizing HA to mono-
saccharides [57,58]. The level of serum HA was elevated
when the function of the liver was interrupted by disease or
chemicals [55]. To avoid these effects, we investigated the
CBC and blood chemicals in both the HD and non-HD
dogs, and abnormal liver signs were observed in both
groups. The results indicated that the level of serum HA in
our study is a direct effect of cartilage metabolism and is
not a result of liver function.
From the serological results, the WBC in the HD group
was significantly higher than that in the non-HD group.
Based on our knowledge, interleukin (IL-1) is mainly
produced by cells of the macrophage lineage such as the
synovial A-cell. Moreover, the IL-1 from synovial A-cells
and other macrophage cells stimulates chondrocytes to
produce IL-1 [7]. An increasing of IL-1 stimulates the
production of collagenase, stromelysin and prostaglandin
E2 by the chondrocytes. This mechanism induces
inflammation to proceed in the dysplatic joint [8,24] and it
increases the WBC. So far, this study supports those
previous publications that were mention above. Our study
found that the mean value of the WBC in the HD group was
significantly higher than that in the non-HD group.
However, the biological significance of the WBC in
HD-dog needs future study to expand our understanding of
the interaction between the WBC and HD-dogs.
It is interesting to compare the results for the serum HA
with the result for the CS epitopes (3B3 and WF6). The CS
epitope 3B3 may provide a measure of the mobilization of
the tissue proteoglycans that contain chondroitin 6-sulfate.
Biomarkers for osteoarthritis in canine hip dysplasia 323
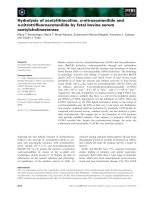
Fig. 3. The levels of serum chondroitin sulfate epitope 3B3 (A), WF6 (B) and hyaluronan (C) in the non-HD group. The animals of this
group were categorized into the male and female group. Data show the mean ± SD. No significant difference (p > 0.05) was observe
d
between the genders.
The 3B3 epitope is a 6-sulfated terminal disaccharide of CS
[15]. The 3B3 assay that was developed in this study with
using monoclonal antibody recognizes the unsaturated
terminal 6-sulfateed disaccharide structure that remains
attached to the protein after chondroitinase ABC digestion.
As the aggrecan degradation products from cartilage were
likely to be present in the serum and to be polyvalent, the
detection with 3B3 epitope may selectively provide a
measure of anabolism in the cartilaginous tissues. The
level of native CS epitope detected by monoclonal
antibody WF6 in the HD group was increased above the
level found in the non-HD group. An increase in the WF6
epitope may reflect a catabolic response and this may be
helpful for making the diagnosis or predicting the
prognosis of disease.
Moreover, this study shows the advantage of using these
biomarkers. Body weight, which is known as a pre-
disposing cause of OA [59], is not affected by the level of
these biomarkers. This means that the changes of the
biomarkers’ levels in serum are dependent on the severity
of disease. Also, a previous study from our group
demonstrated that the levels of CS epitope WF6 and 3B3
were not different between different body weight groups of
horses [47]. This shows that the change of biomarker levels
in the serum is directly related to the cartilage metabolism.
However, the relationship between the severity of disease
and the change of those biomarkers or other factors (such
as the disease management and breed of animal) needs to
be investigated for enlightening our understanding of the
pathogenesis of the articular cartilage in HD disease.
In conclusion, our study raises important questions
concerning the alterations in cartilage aggrecan metabolism
in HD dogs. We have demonstrated the potential for using
measurements of aggrecan epitopes and HA in the serum as
indicators of disease activity. Indeed, the results of the
present study suggest that several target biomarker
molecules of cartilage metabolism have the potential to
provide clinically useful indices of the effects of isolated
joint injury, the progression of the joint changes and the
response to therapy. The levels of the CS epitopes 3B3 and
WF6 in serum were increased, while the HA levels show a
decrease in hip dysplatic dogs. This information may prove
useful for making the differential diagnosis and monitoring
joint disease.
Acknowledgments
The authors express their gratitude and thanks to the
veterinarians and technician assistants at the Small Animal
Hospital, Faculty of Veterinary Medicine, Chiang Mai
University, for collecting the samples. This project was
supported by The Thailand Research Fund (TRF Ad-
vanced Research Scholar, Grant # BRG 4780018 to PK),
The National Research Council of Thailand (Research
program for drugs, chemicals, medical materials and
equipment) and the Faculty of Veterinary Medicine,
Chiang Mai University, Thailand.
References
1. Allan G. Radiographic signs of joint disease. In: Thrall DE
(ed.). Textbook of Veterinary Diagnostic Radiology. 2nd ed.
pp. 130-150, Saunders, Philadelphia, 1994.
2. Alwan WH, Carter SD, Bennett D, Edwards GB.
Glycosaminoglycans in horses with osteoarthritis. Equine
Vet J 1991, 23, 44-47.
3. Antonas KN, Fraser JR, Muirden KD. Distribution of
biologically labelled radioactive hyaluronic acid injected
into joints. Ann Rheum Dis 1973, 32, 103-111.
4. Arican M, Carter SD, May C, Bennett D. Hyaluronan in
324 Korakot Nganvongpanit et al.
canine arthropathies. J Comp Pathol 1994, 111, 185-195.
5. Belcher C, Yaqub R, Fawthrop F, Bayliss M, Doherty M.
Synovial fluid chondroitin and keratan sulphate epitopes,
glycosaminoglycans, and hyaluronan in arthritic and normal
knees. Ann Rheum Dis 1997, 56, 299-307.
6. Bj
örk J, Kleinau S, Tengblad A, Smedegård G. Elevated
levels of serum hyaluronate and correlation with disease
activity in experimental models of arthritis. Arthritis Rheum
1989, 32, 306-311.
7. Blom AB, van der Kraan PM, van den Berg WB.
Cytokine targeting in osteoarthritis. Curr Drug Targets 2007,
8, 283-292.
8. Bondeson J, Wainwright SD, Lauder S, Amos N, Hughes
CE. The role of synovial macrophages and macrophage-pro-
duced cytokines in driving aggrecanases, matrix metallo-
proteinases, and other destructive and inflammatory
responses in osteoarthritis. Arthritis Res Ther 2006, 8, R187.
9. Bruyere O, Collette JH, Ethgen O, Rovati LC, Giacovelli
G, Henrotin YE, Seidel L, Reginster JY. Biochemical
markers of bone and cartilage remodeling in prediction of
longterm progression of knee osteoarthritis. J Rheumatol
2003, 30, 1043-1050.
10. Budsberg SC, Lenz ME, Thonar EJ. Serum and synovial
fluid concentrations of keratan sulfate and hyaluronan in
dogs with induced stifle joint osteoarthritis following cranial
cruciate ligament transection. Am J Vet Res 2006, 67, 429-
432.
11. Cardinet GH 3rd, Kass PH, Wallace LJ, Guffy MM.
Association between pelvic muscle mass and canine hip
dysplasia. J Am Vet Med Assoc 1997, 210, 1466-1473.
12. Caterson B, Flannery CR, Hughes CE, Little CB. Mecha-
nisms involved in cartilage proteoglycan catabolism. Matrix
Biol 2000, 19, 333-344.
13. Caterson B, Griffin J, Mahmoodian F, Sorrell JM.
Monoclonal antibodies against chondroitin sulphate isomers:
their use as probes for investigating proteoglycan metabolism.
Biochem Soc Trans 1990, 18, 820-823.
14. Caterson B, Hughes CE, Roughley P, Mort JS. Anabolic
and catabolic markers of proteoglycan metabolism in osteo-
arthritis. Acta Orthop Scand Suppl 1995, 266, 121-124.
15. Caterson B, Mahmoodian F, Sorrell JM, Hardingham
TE, Bayliss MT, Carney SL, Ratcliffe A, Muir H.
Modulation of native chondroitin sulphate structure in tissue
development and in disease. J Cell Sci 1990, 97, 411-417.
16. DeAngelis PL. Hyaluronan synthases: fascinating glycosyl-
transferases from vertebrates, bacterial pathogens, and algal
viruses. Cell Mol Life Sci 1999, 56, 670-682.
17. Fuller CJ, Barr AR, Sharif M, Dieppe PA. Cross-sectional
comparison of synovial fluid biochemical markers in equine
osteoarthritis and the correlation of these markers with
articular cartilage damage. Osteoarthritis Cartilage 2001, 9,
49-55.
18. George J, Stern R. Serum hyaluronan and hyaluronidase:
very early markers of toxic liver injury. Clin Chim Acta
2004, 348, 189-197.
19. Goldberg RL, Rubin AS. Serum hyaluronate as a marker
for disease severity in the Lactobacillus casei model of
arthritis in the rat. J Rheumatol 1989, 16, 92-96.
20. Hazell PK, Dent C, Fairclough JA, Bayliss MT,
Hardingham T. Changes in glycosaminoglycan epitope
levels in knee joint fluid following injury. Arthritis Rheum
1995, 38, 953-959.
21. Hegemann N, Kohn B, Brunnberg L, Schmidt MF. Bio-
markers of joint tissue metabolism in canine osteoarthritic
and arthritic joint disorders. Osteoarthritis Cartilage 2002,
10, 714-721.
22. Heineg
ård D, Hascall VC. Aggregation of cartilage pro-
teoglycans. 3. Characteristics of the proteins isolated from
trypsin digests of aggregates. J Biol Chem 1974, 249, 4250-
4256.
23. Hollander AP, Heathfield TF, Webber C, Iwata Y,
Bourne R, Rorabeck C, Poole AR. Increased damage to
type II collagen in osteoarthritic articular cartilage detected
by a new immunoassay. J Clin Invest 1994, 93, 1722-1732.
24. Jacques C, Gosset M, Berenbaum F, Gabay C. The role of
IL-1 and IL-1Ra in joint inflammation and cartilage degrada-
tion. Vitam Horm 2006, 74, 371-403.
25. Johnson JA, Austin C, Breur GJ. Incidence of canine
appendicular musculoskeletal disorders in 16 veterinary
teaching hospitals from 1980 through 1989. Vet Comp Orth
Traum 1994, 7, 56-59.
26. Kaewsakorn T, Chotayaporn M, Suwankong N,
Nganvongpanit K, Jitpean S, Cutesuwan P. Normal
hematology and blood chemistry in small, medium and
larged adult healthy dogs. Chiangmai Vet J 2003, 1, 35-49.
27. Kelly GS. The role of glucosamine sulfate and chondroitin
sulfates in the treatment of degenerative joint disease. Altern
Med Rev 1998, 3, 27-39.
28. Kiani C, Chen L, Wu YJ, Yee AJ, Yang BB. Structure and
function of aggrecan. Cell Res 2002, 12, 19-32.
29. Kikuchi T, Yamada H, Shimmei M. Effect of high
molecular weight hyaluronan on cartilage degeneration in a
rabbit model of osteoarthritis. Osteoarthritis Cartilage 1996,
4, 99-110.
30. Knudson CB, Knudson W. Hyaluronan-binding proteins in
development, tissue homeostasis, and disease. FASEB J
1993, 7, 1233-1241.
31. Knudson W. The role of CD44 as a cell surface hyaluronan
receptor during tumor invasion of connective tissue. Front
Biosci 1998, 1, d604-615.
32. Kongtawelert P, Ghosh P. An enzyme-linked immuno-
sorbent-inhibition assay for quantiation of hyaluronan
(hyaluronic acid) in biological fluids. Anal Biochem 1989,
178, 367-372.
33. Leighton EA. Genetics of canine hip dysplasia. J Am Vet
Med Assoc 1997, 210, 1474-1479.
34. Leipold HR, Goldberg RL, Lust G. Canine serum keratan
sulfate and hyaluronate concentrations. Relationship to age
and osteoarthritis. Arthritis Rheum 1989, 32, 312-321.
35. Lohmander LS. Markers of cartilage metabolism in arthro-
sis. A review. Acta Orthop Scand 1991, 62, 623-632.
36. Lohmander LS, Dahlberg L, Eyre D, Lark M, Thonar
EJ, Ryd L. Longitudinal and cross-sectional variability in
markers of joint metabolism in patients with knee pain and
articular cartilage abnormalities. Osteoarthritis Cartilage
1998, 6, 351-361.
37. Lohmander LS, Ionescu M, Jugessur H, Poole AR.
Changes in joint cartilage aggrecan after knee injury and in
Biomarkers for osteoarthritis in canine hip dysplasia 325
osteoarthritis. Arthritis Rheum 1999, 42, 534-544.
38. Lust G. An overview of the pathogenesis of canine hip
dysplasia. J Am Vet Med Assoc 1997, 210, 1443-1445.
39. Manicourt DH, Pita JC. Quantification and characteriza-
tion of hyaluronic acid in different topographical areas of
normal articular cartilage from dogs. Coll Relat Res 1988, 8,
39-47.
40. Masuhara K, Nakai T, Yamaguchi K, Yamasaki S,
Sasaguri Y. Significant increases in serum and plasma
concentrations of matrix metalloproteinases 3 and 9 in
patients with rapidly destructive osteoarthritis of the hip.
Arthritis Rheum 2002, 46, 2625-2631.
41. May SA. Degenerative joint disease (osteoartritis),
osteoartrosis, secondary joint disease. In: Holton JEF,
Collinson R (eds.). Manual of Small Animal Arthrology. pp.
62-74, Bristish Small Animal Veterinary Association
Bournemounth, Cheltenham, 1994.
42. McLaughlin RM, Roush JK. Diagnosing osteoarthritis.
Vet Med 2002, 97, 120-133.
43. Nganvongpanit K, Ong-Chai S. Biological marker for
canine osteoarthritis diagnosis. Chiangmai Vet J 2004, 2, 39-
49.
44. Okumura M, Tagami M, Fujinaga T. Measurement of
serum and synovial fluid keratan sulphate and antibody to
collagen type II in equine osteoarthritis. Zentralbl
Veterinarmed A 1998, 45, 513-516.
45. Owens JM, Biery DN. Radiographic Interpretation for the
Small Animal Clinician. 2nd ed. Williams & Wilkins,
Baltimore, 1999.
46. Paimela L, Heiskanen A, Kurki P, Helve T, Leirisalo-
Repo M. Serum hyaluronate level as a predictor of
radiologic progression in early rheumatoid arthritis. Arthritis
Rheum 1991, 34, 815-821.
47. Peansukmanee S, Trinarong C, Kongtawelert P, Ong-
chai S. Chondroitin sulfate epitopes in sera of normal and
osteoarthritic horses. Chiangmai Vet J 2003, 1, 3-10.
48. Petersson IF, Boeg
ård T, Svensson B, Heinegård D,
Saxne T. Changes in cartilage and bone metabolism
identified by serum markers in early osteoarthritis of the
knee joint. Br J Rheumatol 1998, 37, 46-50.
49. Pothacharoen P, Siriaunkgul S, Ong-Chai S, Supaban-
dhu J, Kumja P, Wanaphirak C, Sugahara K, Harding-
ham T, Kongtawelert P. Raised serum chondroitin sulfate
epitope level in ovarian epithelial cancer. J Biochem 2006,
140, 517-524.
50. Pothacharoen P, Teekachunhatean S, Louthrenoo W,
Yingsung W, Ong-Chai S, Hardingham T, Kongtawelert
P. Raised chondroitin sulfate epitopes and hyaluronan in
serum from rheumatoid arthritis and osteoarthritis patients.
Osteoarthritis Cartilage 2006, 14, 299-301.
51. Ratcliffe A, Beauvais PJ, Saed-Nejad F. Differential levels
of synovial fluid aggrecan aggregate components in
experimental osteoarthritis and joint disuse. J Orthop Res
1994, 12, 464-473.
52. Ratcliffe A, Billingham MEJ, Saed-Nejad F, Muir H,
Hardingham TE. Increased release of matrix components
from articular cartilage in experimental canine osteoarthritis.
J Orthop Res 1992, 10, 350-358.
53. Rettenmaier JL, Keller GG, Lattimer JC, Corley EA,
Ellersieck MR. Prevalence of canine hip dysplasia in a
veterinary teaching hospital population. Vet Radiol
Ultrasound 2002, 43, 313-318.
54. Roush JK, McLaughlin RM, Radlinsky MAG. Under-
standing the pathophysiology of osteoarthritis. Vet Med
2002, 97, 108-119.
55. Sakugawa H, Nakayoshi T, Kobashigawa K, Yamashiro
T, Maeshiro T, Miyagi S, Shiroma J, Toyama A, Nakayo-
shi T, Kinjo F, Saito A. Clinical usefulness of biochemical
markers of liver fibrosis in patients with nonalcoholic fatty
liver disease. World J Gastroenterol 2005, 11, 255-259.
56. Sim
ánek V, Kren V, Ulrichová J, Gallo J. The efficacy of
glucosamine and chondroitin sulfate in the treatment of
osteoarthritis: Are these saccharides drugs or nutraceuticals?
Biomed Pap Med Fac Univ Palacky Olomouc Czech Repub
2005, 149, 51-56.
57. Smedsr
ød B, Kjellén L, Pertoft H. Endocytosis and
degradation of chondroitin sulphate by liver endothelial
cells. Biochem J 1985, 229, 63-71.
58. Smedsr
ød B, Pertoft H, Gustafson S, Laurent TC.
Scavenger functions of the liver endothelial cell. Biochem J
1990, 266, 313-327.
59. Smith GK, Mayhew PD, Kapatkin AS, Mckelvie PJ,
Shofer FS, Gregor TP. Evaluation of risk factors for
degenerative joint disease associated with hip dysplasia in
German shepherd dogs, Golden retrievers, Labrador
retrievers, and Rottweilers. J Am Vet Med Assoc 2001, 219,
1719-1724.
60. Tangkijvanich P, Kongtawelert P, Pothacharoen P,
Mahachai V, Suwangool P, Poovorawan Y. Serum
hyaluronan: a marker of liver fibrosis in patients with
chronic liver disease. Asian Pac J Allergy Immunol 2003, 21,
115-120.
61. Uesaka S, Nakayama Y, Shirai Y, Yoshihara K. Serum
and synovial fluid levels of chondroitin sulfate in patients
with osteoarthritis of the knee joint. J Nippon Med Sch 2001,
68, 165-170.
62. Wight TN, Kinsella MG, Qwarnstr
öm EE. The role of
proteoglycans in cell adhesion, migration and proliferation.
Curr Opin Cell Biol 1992, 4, 793-801.
63. Worrall JG, Wilkinson LS, Bayliss MT, Edwards JC.
Zonal distribution of chondroitin-4-sulphate/dermatan
sulphate and chondroitin-6-sulphate in normal and diseased
human synovium. Ann Rheum Dis 1994, 53, 35-38.