Quality of Telephone-Based Spoken Dialogue Systems phần 6 pptx
Bạn đang xem bản rút gọn của tài liệu. Xem và tải ngay bản đầy đủ của tài liệu tại đây (2.44 MB, 49 trang )
Quality of Synthesized Speech over the Phone
221
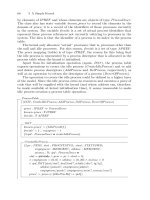
Figure 5.6. Effect of narrow-band circuit noise Nc. Normalized and E-model prediction
for individual voices. N for = –100 dBmp.
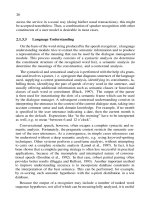
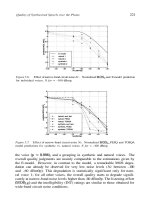
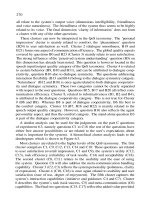
Figure 5.7. Effect of narrow-band circuit noise Nc. Normalized PESQ and TOSQA
model predictions for synthetic vs. natural voices. N for = –100 dBmp.
the voice and a grouping in synthetic and natural voices. The
overall quality judgments are mainly comparable to the estimations given by
the E-model. However, in contrast to the model, a remarkable MOS degra-
dation can already be observed for very low noise levels (Nc between –100
and –60 dBm0p). This degradation is statistically significant only for natu-
ral voice 1; for all other voices, the overall quality starts to degrade signifi-
cantly at narrow-band noise levels higher than -60 dBm0p. The listening-effort
and the intelligibility (INT) ratings are similar to those obtained for
wide-band circuit noise conditions.
222
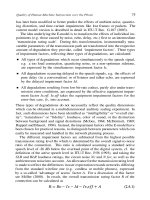
Figure 5.8. Effect of signal-correlated noise with signal-to-quantizing-noise ratio Q. Normal-
ized and E-model prediction for individual voices.
When comparing the results for narrow-band circuit noise, Nc, with the
predictions from signal-based comparative measures, the graph is similar to
the one found for wideband noise N for, see Figure 5.7. The predictions for
naturally produced and synthesized speech from PESQ are close to each other,
whereas the TOSQA model predicts a higher quality decrease for the naturally
produced speech, an estimation which is supported by the auditory tests. As for
N for, the TOSQA model predicts a very steep decrease for the MOS values
with increasing noise levels, whereas the shape of the curve predicted by PESQ
is closer to the one found in the auditory test. As can be expected, the scatter of
the auditory test results for medium noise levels (Nc ~ – 70 – 60 dBm0p) is
not reflected in the signal-based model predictions. It will have its origin in the
subjective ratings, and not in the speech stimuli presented to the test subjects.
5.4.2.3
Impact of Signal-Correlated Noise
Signal-correlated noise is perceptively different from continuous circuit noise
in the sense that it only affects the speech signal, and not the pauses. Its effects on
the overall quality ratings are shown in Figure 5.8. Whereas slight individual
differences for the voices are discovered (not statistically significant in the
ANOVA), the overall behavior for synthetic and natural voices is very similar.
This can be seen when the mean values for synthetic and natural voices are
compared, see the dotted lines in Figure 5.9. The degradations are – in principle
– well predicted by the E-model. However, for low levels of signal-correlated
noise (high Q), there is still a significant degradation which is not predicted by
the model. This effect is similar to the one observed for narrow-band circuit
noise, Nc; no explanation can be given for this effect so far.
Quality of Synthesized Speech over the Phone
223
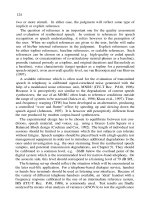
Figure 5.9. Effect of signal-correlated noise with signal-to-quantizing-noise ratio Q. Normal-
ized PESQ and TOSQA model predictions for synthetic vs. natural voices.
The predictions of the signal-based comparative measures PESQ and TOSQA
do not agree very well with the auditory test results. Whereas the PESQ model
estimations are close to the auditory judgments up to SNR values of
the TOSQA model estimates the signal-correlated noise impact slightly more
pessimistically. This model, however, predicts a slightly lower degradation of
the naturally produced speech samples, which is congruent with the auditory
test. Both PESQ and TOSQA models do not predict the relatively low quality
level for the highest SNR value in the test (Q = 30 dB), but give more optimistic
estimations for these speech samples. Expressed differently, the models reach
saturation (which is inevitable on the limited MOS scale) at higher SNR values
than those included in the test conditions. As a general finding, both models
are in line with the auditory test in that they do not predict strong differences
between the naturally produced and the synthesized speech samples.
The and the INT values are similar in the natural and synthetic case,
with slightly higher values for the natural voices. These results have not been
plotted for space reasons.
5.4.2.4
Impact of Ambient Noise
Degradations due to ambient room noise are shown in Figure 5.10. The
behavior slightly differs for the individual voices. In particular, the synthetic
voices seem to be a little less prone to ambient noise impairments than the
natural voices. Once again, this might be due to a higher ‘distinctness’ of the
synthetic voices, which makes them more remarkable in the presence of noise.
The same behavior is found for the intelligibility judgments, see Figure 5.11.
For all judgments, the data point for synthetic voice 1 and Pr = 35 dB(A)
224
Figure 5.10. Effect of hoth-type ambient noise
Pr
. Normalized and E-model prediction
for individual voices.
Figure 5.11. Effect of hoth-type ambient noise
Pr.
Normalized intelligibility score for
individual voices.
seems to be an outlier, as it is rated particularly negative. Informal listening
shows very inappropriate phone durations in two positions of the speech file,
which makes this specific sample sound particularly bad. Here, the lack of
optimization of the speech material discussed in Section 5.4.1.1 is noted.
5.4.2.5
Impact of Low Bit-Rate Coding
The low bit-rate codecs investigated here cover a wide range of perceptively
different types of degradations. In particular, the G.726 (ADPCM) and the
Quality of Synthesized Speech over the Phone
225
Figure 5.12. Effect of low bit-rate codecs. Normalized and E-model prediction for
synthetic vs. natural voices.
G.728 (LD-CELP) codecs produce an impression of noisiness, whereas G.729
and IS-54 are characterized by an artificial, unnatural sound quality (informal
expert judgments).
Figures 5.12 to 5.14 show a fundamental difference in the quality judgments
for natural and synthesized speech, when transmitted over channels including
these codecs (mean values over the natural and synthetic voices are reproduced
here for clarity reasons). Except for two cases (the G.726 and G.728 codecs,
which are rated too negatively in comparison to the prediction model), the
decrease in overall quality predicted by the E-model is well reflected in the au-
ditory judgments for natural speech. On the other hand, the judgments for the
synthesized speech do not follow this line. Instead, the overall quality of synthe-
sized speech is much more strongly affected by ‘noisy’ codecs (G.726, G.728
and G.726*G.726) and less by the ‘artificially sounding’ codecs. Listening-
effort and intelligibility ratings for synthesized speech are far less affected by
all of these codecs (they scatter around a relatively constant value), whereas
they show the same rank order for the naturally produced speech (once again,
with exception of the G.726 and G.728 codec). The differences in behavior of
the synthetic and the natural voices are also observed for the codec cascades
(G.726*G.726 and IS-54*IS-54) compared to the single codecs: Whereas for
the G.726 tandem mainly the synthetic voices suffer from the cascading, the
effect is more dominant for the natural voices with the IS-54 cascade.
The observed differences may be due to differences in quality dimensions
perceived as degradations by the test subjects. Whereas the ‘artificiality’ di-
226
Figure 5.13. Effect of low bit-rate codecs. Normalized listening-effort for synthetic
vs. natural voices.
Figure 5.14. Effect of low bit-rate codecs. Normalized intelligibility score for synthetic
vs. natural voices.
mension introduced by the G.729 and IS-54 codecs is an additional degradation
for the naturally produced speech, this is not the case for synthesized speech,
which already carries a certain degree on artificiality. It is not yet clear why
the G.726 and G.728 transmission circuits result in particularly low quality, an
effect which does not correspond to the prediction of the E-model. Other in-
vestigations carried out by the author in a working group of the ITU-T (Möller,
2000) also suggest that the model predictions are too optimistic for these codecs
when considered in isolation, i.e. without tandeming.
Quality of Synthesized Speech over the Phone
227
Figure 5.15. Effect of low bit-rate codecs. Normalized PESQ and TOSQA model
predictions for natural voices.
Figure 5.16. Effect of low bit-rate codecs. Normalized PESQ and TOSQA model
predictions for synthetic voices.
Signal-based comparative measures like PESQ and TOSQA have been devel-
ope
d
in particular for predicting the effects of low bit-rate codecs. A comparison
to the normalized auditory values is shown in Figure 5.15 for the nat-
ural voices. Whereas for the IS-54 codec and its combinations the predicted
quality is in good agreement with both models’ predictions, the differences are
bigger for the G.726, G.728 and G.729 codecs. As was found for the E-model,
the G.726 and G.728 codecs are rated significantly worse in the auditory test
compared to the model predictions. On the other hand, the G.729 codec is rated
228
better than the predictions of both PESQ and TOSQA suggest. In all cases,
either both models predict the codec degradations too optimistically or too pes-
simistically. Thus, no advantage can be obtained when calculating the mean of
the PESQ and TOSQA model predictions.
The picture is different for the synthesized voices, see Figure 5.16. The
quality rank order predicted by the E-model (i.e. the bars ordered with respect to
decreasing MOS values) is also found for the PESQ and TOSQA predictions, but
it is not well reflected in the auditory judgments. In all, the differences between
the auditory test results and the signal-based model predictions is larger for the
synthesized than for the naturally produced voices. For the three ‘noisy’ codec
conditions G.726, G.728 and G.726*G.726, both PESQ and TOSQA predict
quality more optimistically than was judged in the test. For the other codecs the
predictions are mainly more pessimistic. This supports the assumption that the
overall quality of synthesized speech is much more strongly affected by ‘noisy’
and less by the ‘artificially sounding’ codecs.
5.4.2.6
Impact of Combined Impairments
For combinations of circuit noise and low bit-rate distortions, synthetic and
natural voices behave similarly. This can be seen in Figure 5.17, showing the
combination of the IS-54 cellular codec with narrow-band circuit noise (mean
values for synthetic vs. natural voices are depicted). Again, the quality for low
noise does not reach the optimum value (the value predicted by the E-model).
This observation has already been made for the other circuit noise conditions.
In high-noise-level conditions, the synthetic voices are slightly less affected by
the noise than the natural voices. This finding is similar to the one described in
Section 5.4.2.2.
With the help of the normalization to the scale, the additivity of different
types of impairments postulated by the E-model can be tested. Figure 5.18
shows the results after applying this transformation. It can be seen that the
slope of the curve for higher noise levels is well in line with the results for
the natural voices. The synthesized voices seem to be more robust under these
conditions, although the individual results scatter significantly.
For low noise levels, the predictions of the E-model are once again too op-
timistic. This will be due to the unrealistically low theoretical noise floor level
(N f or = –100 dBmp) of this connection, for which the E-model predictions
even exceed 100 as the limit of the scale under normal (default) circuit con-
ditions. The optimistic model prediction can also be observed for the judgment
of the codec alone, depicted in Figure 5.12. In principle, however, the flat
model curve for the lower noise levels is well in agreement with the results
both for synthetic and natural voices. Thus, no specific doubts arise as to the
validity of adding different impairment factors to obtain an overall transmission
rating. Of course, the limited findings do not validate the additivity property as
Quality of Synthesized Speech over the Phone
229
Figure 5.17. Effect of narrow-band circuit noise Nc and the IS-54 codec. Normalized
and E-model prediction for synthetic vs. natural voices.
Figure 5.18. Effect of narrow-band circuit noise Nc and the IS-54 codec. Normalized and
E-model transmission rating prediction for individual voices.
a whole. Other combinations of impairments will have to be tested, and more
experiments have to be carried out in order to reduce the obvious scatter in the
results.
5.4.2.7
Acceptability Ratings
The ratings on the ‘perceived acceptability’ question in part 5.1 of the test
have to be interpreted with care, because acceptability can only finally be as-
sessed with a fully working system (for a definition of this term see Möller,
2000). Nevertheless, acceptability judgments are interesting for the develop-
230
Figure 5.19. Effect of narrow-band circuit noise Nc. Perceived acceptability ratings for indi-
vidual voices.
Figure 5.20. Effect of low bit-rate codecs. Perceived acceptability ratings for individual voices.
ers, because they show whether a synthetic voice is acceptable in a specific
application context.
As an example, Figure 5.19 shows the overall (not normalized) level of
perceived acceptability for noisy transmission channels. It can be seen that
synthetic voice 2 mostly ranges in between the natural voices, whereas syn-
thetic voice 1 is rated considerably worse. Interestingly, the highest perceived
acceptability level for the three better voices seems to be reached at a moderate
noise floor of
dBm0p,
and not for the lowest noise levels (except
natural voice 1 and Nc = –100 dBm0p). Thus, under realistic transmission
Quality of Synthesized Speech over the Phone
231
characteristics, these voices seem to be more acceptable for the target appli-
cation scenario then for (unrealistic) low-noise scenarios. The influence of
the transmission channel on the perceived acceptability ratings for the natural
voices as well as for synthetic voice 2 is very similar. The according voices
seem to be acceptable up to a noise level of Nc = – 60 dBm0p. The results for
synthetic voice 1 seem to be too low to be acceptable at all in this application
scenario.
A second example for the perceived acceptability ratings is depicted in
Figure 5.20. Once again, the synthetic voice 2 reaches a perceived accept-
ability level which is in the order of magnitude of the two natural voices.
Whereas the level is lower than both natural voices for the ‘noisy’ G.728 and
the G.726*G.726 codecs, it is higher than natural voice 2 for the ‘artificially
sounding’ codecs G.729 and IS-54, and higher than both natural voices for the
G.729*IS-54 and IS-54*IS-54 tandems. Apparently, synthetic voice 2 is rela-
tively robust against artificially sounding codecs, and more affected by noisy
codecs. This supports the finding that the perceptual type of degradation which
is introduced by the transmission channel has to be seen in relation to the percep-
tual dimensions of the carrier voice. When both are different, the degradations
seem to be accumulated, whereas similar perceptive dimensions do not further
impact the acceptability judgments.
5.4.2.8
Identification Scores
In part 5.2 of the test, subjects had to identify the two variable pieces of infor-
mation contained in each stimulus and write this information down on the screen
form. The responses have been compared to the information given in the stim-
uli. This evaluation had to be carried out manually, because upper/lowercase
changes, abbreviations (e.g. German “Hbf” for “Hauptbahnhof”) and mis-
spellings had to be counted as correct responses. The scores only partly reflect
intelligibility; they cannot easily be related to segmental intelligibility scores
which have to be collected using appropriate test methods.
In nearly all cases, the identification scores reached 100% of correct answers.
Most of the errors have been found for synthetic voice 1, which also showed
the lowest intelligibility rating, cf. Table 5.2. Only for three stimuli more
than one error was observed. In two of these stimuli, the location information
was not identified by 5 or all of the 6 test subjects. Thus, it can be assumed
that the particular character of the speech stimuli is responsible for the low
identification scores. In principle, however, all voices allow the variable parts
of the information contained in the template sentences to be identified.
The results show that the identification task cannot discriminate between
the different transmission circuit conditions and voices. This finding may be
partly due to the playback control which was given to the test subjects. Time
pressure during the identification task may have revealed different results. A
232
comparison to the perceived “intelligibility” ratings shows that although the test
subjects occasionally judged words hard to understand, their capacity to extract
the important information is not really affected.
5.4.2.9
Discussion
In the experiment reported here, the overall quality levels of natural and
synthetic voices differed significantly, and in particular the levels reached by
the two synthetic voices. Nevertheless, the relative amount of degradation
introduced by the transmission channel was observed to be very similar, so
general trends can be derived from the normalized judgments.
For most of the tested degradations, the impact on synthesized speech was
similar to the one observed on naturally produced speech. This result summa-
rize
s
the impact of narrow-band and wideband circuit noise, of signal-correlated
noise, as well as of ambient room noise. More precisely, the synthetic voices
seem to be slightly less affected by high levels of uncorrelated noise compared
to the natural voices. This difference – though not statistically significant in
most cases – was observed for overall quality, intelligibility and listening-effort
judgments. It was explained with a higher ‘distinctness’ of the synthetic voice
which might render it more remarkable in the presence of noise. However, it
is not clear how this finding can be brought in line with a potentially higher
cognitive load which has been postulated for synthetic voices, e.g. by Balestri
et al
.
(1992).
The situation is different for the degradations caused by low bit-rate codecs.
Whereas – with two exceptions – the quality ranking of different codecs as
is estimated by the E-model, and partly also by the signal-based comparative
measures PESQ and TOSQA, is well in line with the judgments for naturally
produced speech, the synthetic voices seem to be affected differently. The
quality impact seems to depend on the perceptual type of impairment which is
introduced by a specific codec. When the codec introduces noisiness, it seems to
degrade the synthetic voice additionally, whereas ‘artificially sounding’ codecs
do not add a significant degradation.
Nearly no differences in intelligibility and listening-effort ratings could be
observed for the codecs included in the tests. At least the intelligibility ratings
seem to be in contrast to the findings of Delogu et al. (1995). In their experi-
ments, the differences in segmental intelligibility were higher for synthesized
speech when switching from good transmission conditions (high quality) to
telephonic ones. The reason might be that – in the experiment reported here –
no comparison to the wideband channel was made, and that the intelligibility
judgments obtained from the subjects do not reflect segmental intelligibility.
Thus, the ‘perceived intelligibility’ seems to be less affected by the transmission
channel than the intelligibility measured in a segmental intelligibility test.
Quality of Synthesized Speech over the Phone
233
5.4.3 Conclusions from the Experiment
Two specific questions were addressed in the described experiment. The first
one has to be answered in a differentiated way. Noise-type degradations seem
to impact the quality of naturally produced and synthesized speech by roughly
the same amount. However, there was a tendency observed that synthesized
speech might be slightly more robust against high levels of uncorrelated noise.
For codec-type degradations, the impact seems to depend on the perceptual type
of degradation which is linked to the specific codec. A ‘noisiness’ dimension
seems to be an additional degradation for the synthesized speech, whereas an
‘artificiality’ dimension is not – probably because it is already included in the
auditory percept related to the source speech signal.
The second question can partly be answered in a positive way. All in all,
the predictions of the transmission rating model which was investigated here
(the E-model) seem to be in line with the auditory test results, both for natu-
rally produced as well as for synthesized speech. Unfortunately, the model’s
estimations are misleading for very low noise levels, a fact which results in too
optimistic predictions when such a channel is taken as a reference for normal-
ization. When the overall quality which can be reached with a specific network
configuration is over-estimated, problems may arise later on in the service op-
eration. It has to be admitted, however, that such low noise levels are generally
not assumed in the network planning process. The signal-based model PESQ
provides a good approximation of the quality degradation to be expected from
circuit noise, whereas the S-shaped characteristic of TOSQA underestimates the
quality at high noise levels. These levels, however, are fortunately not realistic
for normal network configurations. The degradations due to signal-correlated
noise are poorly predicted by every model, especially for high SNRs. The
situation for codec degradations has to be differentiated between the naturally
produced and the synthesized speech: Whereas the degradations on the former
are – with the exception of the G.726 and G.728 codec – adequately predicted
by all models, the degradations on synthesized speech are not well predicted by
any investigated model. This finding might be explained with the degradation
dimensionality introduced by the low bit-rate codecs under consideration.
The results which could be obtained in this initial experiment are obviously
limited. In particular, a choice had to be made with respect to the synthetic
voices under consideration. Two typical concatenative (diphone) synthesizers,
which show perceptual characteristics typical for such approaches, were chosen
here. The situation will be different for formant synthesizers – especially with
respect to coding degradations, but perhaps also for noise degradations, taking
into account that such systems normally reach a lower level of intelligibility.
The quality of speech synthesized with unit-selection approaches will depend on
the size and coverage of the target sentences in the inventory. Thus, the quality
234
will be time-variant on a long-term level. As the intelligibility and overall
quality level which can be achieved with unit-selection is often higher than the
one of diphone synthesizers, the differences observed in the reported experiment
may become smaller in this case. It is not yet clear how different coding
schemes of the synthesizer’s inventory will be affected by the transmission
channel degradations. The synthesizers in the reported experiment used a linear
16 bit PCM coding scheme or a vector-quantized LPC with a parametrized
glottal waveform. Other coding schemes may be differently affected by the
transmission channel characteristics.
A second limitation results from the purely listening-only test situation. In
fact, it cannot be guaranteed that the same judgments would be obtained in a
conversational situation. Experiments carried out by the author (Möller, 2000),
however, do not raise any specific doubts that the relative quality degradation
will be similar. Some of the degradations affecting the conversational situation
do not apply to interactions with spoken dialogue systems. For example, talker
echo with synthetic voice is only important for potential barge-in detectors of
SDSs, and not on a perceptual level. Typical transmission delays will often be
surpassed by the reaction time of the SDS. Here, the estimations for acceptable
delay from prediction models like the E-model might be used as a target for
what is desirable in terms of an overall reaction time, including system reaction
and transmission delay.
Obviously, not all types of degradations could be tested in the reported ex-
periment. In particular, the investigation did not address room acoustic influ-
ences (e.g. when listening to synthetic voice with a hands-free terminal), or
time-variant degradations from lost packets or fading radio channels. These
degradations are still poorly investigated, also with respect to their influence
on naturally produced speech. They are important in mobile networks and will
also limit the quality of IP-based voice transmission. Only few modelling ap-
proaches take these impairments into account so far. The E-model provides
a rough estimation of packet loss impact in its latest version (ITU-T Delayed
Contribution D.44,2001; ITU-T Rec. G.107,2003), and the signal-based com-
parative measures have also been tested to provide valid prediction results for
this type of time-variant impairment.
5.5
Summary
In this chapter, the quality of synthesized speech has been addressed in a
specific application scenario, namely an information server operated over the
telephone network. In such a scenario, quality assessment and evaluation has
to take into account the environmental and the contextual factors exercising
an influence on the speech output quality, and subsequently on usability, user
satisfaction, and acceptability.
Quality of Synthesized Speech over the Phone
235
The contextual factors have to be reflected by the design of evaluation ex-
periments. In this way, such experiments can provide highly valid results for
the future application to be set up. The requirements for such functional testing
have been defined, and an exemplary evaluation for the restaurant information
system used in the last chapter has been proposed. As will happen in many
evaluations carried out during the set-up of spoken dialogue systems, the re-
sources for this evaluation were limited. In particular, only a laboratory test
with a limited group of subjects could be carried out, and no field test or survey
with a realistic group of potential future users of the system. In spite of these
limitations, interesting results with respect to the influence of the environmental
factors were obtained.
The type of degradation which is introduced by the transmission channel was
shown to determine whether synthesized speech is degraded by the same amount
than naturally produced speech. For noise-type degradations (narrow-band and
wideband circuit noise, signal-correlated noise), the amount of degradation is
simila
r
in both cases. However, synthesized speech seemed to be slightly more
remarkable in high uncorrelated noise conditions. For codec-type degradations,
the dimensionality of the speech and the transmission channel influences have
to be taken into account. When the codec introduces an additional perceptive
dimension (such as noisiness), the overall quality is impacted. When the dimen-
sionality is already covered in the source speech signal (such as artificiality),
then the quality is not further degraded, at least not by the same amount as
would be expected for naturally produced speech.
The estimations provided by quality prediction models which have originally
been designed for naturally produced speech can serve as an indication of the
amount of degradation introduced by the transmission channel on synthesized
speech. Two types of models have been investigated here. The E-model relies
on the parametric description of the transmission channel, and thus does not
have any information on the speech signals to be transmitted as an input. It
nevertheless provides adequate estimations for the relative degradation caused
by the transmission channel, especially for uncorrelated noise. The signal-based
comparative measures PESQ and TOSQA are also capable of estimating quality
of transmitted synthesized speech to a certain degree. All models, however, do
not adequately take into account the different perceptive dimensions caused by
the source speech material and by the transmission channel. In addition, they
are only partly able to accurately predict the impact of signal-correlated noise.
The test results have some implications for the designers of telecommunica-
tion networks, and for speech synthesis providers. Whereas in most cases net-
works designed for naturally produced speech will transmit synthesized speech
with the same amount of perceptual degradation, the exact level of quality will
236
depend on the perceptual quality dimensions. These dimensions depend on the
speech signal and the transmission channel characteristics. Nevertheless, rough
estimations of the amount of degradation may be obtained with the help of qual-
ity prediction models like the E-model. The overall quality level is however
estimated too optimistically, due to misleading model predictions for very low
noise levels. In conclusion, no specific doubts arise as to whether telephone net-
works which are carefully designed for transmitting naturally produced speech
will also enable an adequate transmission of synthesized speech.
Chapter 6
QUALITY OF SPOKEN DIALOGUE SYSTEMS
Investigations on the performance of speech recognition and on the qual-
ity of synthesized speech in telephone environments like the ones reported in
the previous two chapters provide useful information on the influence of en-
vironmental factors on the system’s speech input and output capability. They
are, however, limited to these two specific modules, and do not address the
speech understanding, the dialogue management, the application system (e.g.
the database), and the response generation. Because the other modules may
have a severe impact on global quality aspects of the system and the service
it provides, user-orientated quality judgments can only be obtained when all
system components operate together. The quality judgments will then reflect
the performance of the individual components in a realistic functional situation.
The experiments described in this chapter take such a wholistic view of
the system. They are not particularly limited to the dialogue management
component for two obvious reasons. Firstly, users can only interact with the
dialogue manager via the speech input and output components. The form of both
speech input from the user and speech output from the system cannot, however,
be separated from its communicative function. Thus, speech input and output
components will always exercise an influence on the quality perceived by the
user, even when they show perfect performance. Secondly, the quality which is
attributed to certain dialogue manager functionalities can only be assessed in the
realistic environment of non-perfect other system components. For example,
an explicit confirmation strategy may be perceived as lengthy and boring in
case of perfect speech recognition capabilities, but may prove extremely useful
when the recognition performance decreases. Thus, quality judgments which
are obtained in a set-up with non-realistic neighboring system components will
not be valid for the later application scenario.
In order to estimate the impact of the mentioned module dependencies on
the overall quality of the system, it will be helpful to describe the relationships
238
between quality factors (environmental, agent, task, and contextual factors) and
quality aspects in terms of a relational network. Such a network should ide-
ally be able to identify and quantify the relationships, e.g. by algorithmically
describing how and by what amount the capabilities and the performance of
individual modules affect certain quality aspects. The following relationship
can be taken as an example: Transmission impairments obviously affect the
recognition performance, and their impact has been described in a quantitative
way with the help of the E-model, see Section 4.5. Now, further relationships
can be established between ASR performance (expressed e.g. by a WER or
WA) on the one side, and perceived system understanding (which is the result
of a user judgment) on the other. Perceived system understanding is one aspect
of speech input quality, and it will contribute to communication and task effi-
ciency, and to the comfort perceived by the user, as has been illustrated in the
QoS taxonomy. These aspects in turn will influence the usability of the service,
and finally the user’s satisfaction. If it is possible to follow such a concatena-
tion of relations, predictors for individual quality aspects can be established,
starting either from system characteristics (e.g. a parametric description of the
transmission channel) or from interaction parameters.
The illustrated goal is very ambitious, in particular if the relationships to be
established shall be generic, i.e. valid for a number of different systems, tasks
and domains. Nevertheless, even individual relationships will give light on how
users perceive and judge the quality of a complex service like the one offered
via an SDS. They will form a first basis for modelling approaches which allow
quality to be addressed in an analytic way, i.e. via individual quality aspects.
Thus, a first step will be to establish predictors for individual quality aspects.
Such predictors may then be combined to predict quality on a global level, e.g. in
terms of system usability or user satisfaction. From this perspective, the goal is
far less ambitious than that of predicting overall quality directly from individual
interaction parameters, as is proposed by the PARADISE framework discussed
in Section 6.3. Prediction of individual quality aspects may carry the additional
advantage that such predictors might be more generic in their prediction, i.e.
that they may be applied to a wider range of systems.
It is the aim of the experiments described underneath to identify quality
aspects which are relevant from a user’s point of view and to relate them to
interaction parameters which can be collected during laboratory tests. A proto-
typical example SDS will be used for this purpose, namely the BoRIS system
for information about the restaurants in the area of Bochum, Germany. The
system has been set up by the author as an experimental prototype for quality
assessment and evaluation. Speech recognition and speech synthesis compo-
nents which can be used in conjunction with this system have already been
investigated in Chapters 4 and 5. Now, user interactions with the fully working
system will be addressed, making use of the mentioned speech output compo-
Quality of Spoken Dialogue Systems
239
nents, and replacing the ASR module by a wizard simulation in order to be able
to control its performance. The experimental set-up of the whole system will
be described in Section 6.1.
A number of subjective interaction experiments have been carried out with
this system. They generally involve the following steps to be performed:
Set-up and running of laboratory interactions with a number of test subjects,
under controlled environmental and contextual conditions.
Collection of instrumentally measurable parameters during the interactions.
Collection of user quality ratings after each interaction, and after a complete
test session.
Transcription of the dialogues.
Annotation of dialogue transcriptions by a human expert.
Automatic calculation of interaction parameters.
Data analysis and quality modelling approaches.
The first steps serve the purpose of collecting interaction parameters and re-
lated quality judgments for specific system configurations. These data will be
analyzed with respect to the interrelations among interaction parameters and
quality judgments, and between interaction parameters and quality judgments,
see Section 6.2.
The starting point of the analysis carried out here is the QoS taxonomy
which has already been used for classifying quality aspects and interaction
parameters, see Sections 3.8.5 and 3.8.6. In this case, it will be used for selecting
interaction parameters and judgment scales which refer to the same quality
aspect. The analysis of correlation data will highlight the relationships between
interaction parameters and perceived quality, but also the limitations of using
data from external (instrumental or expert) sources for describing perceptive
effects. Besides this, it serves a second purpose, namely to analyze the QoS
taxonomy itself. These analyses will be described in detail in Section 6.2.4.
Both interaction parameters and subjective judgments reflect the character-
istics of the specific system. In the experiments, a limited number of system
characteristics were varied in a controlled way, in order to quantify the effects
of the responsible system components. Such a parametric setting is possible
for the speech recognizer (using a wizard-controlled ASR simulation), for the
speech output (using either naturally recorded or synthesized speech, or combi-
nations of both), and for the dialogue manager (selecting different confirmation
strategies). Effects of the respective system configurations on both interaction
parameters and subjective ratings are analyzed, and compared to data reported
240
in the literature, see Section 6.2.5. Other effects are a result of the test set-up
(e.g. training effects) and will be discussed in Section 6.2.6.
In the final Section 6.3, analysis results will be used to define new prediction
model approaches. Starting from a review of the most widely used PARADISE
model and its variants, a new approach is proposed which aims at finding pre-
dictors for individual quality aspects first, before combining them to provide
predictions of global quality aspects. Such a hierarchical model is expected to
provide more generic predictions, i.e. better extrapolation possibilities to un-
known systems and new tasks or domains. Although the final proof of this claim
remains for further study, the obtained results will be important for everyone in-
terested in estimating quality for selecting and optimizing system components.
They provide evidence that an analytic view of quality aspects – as is provided
by the QoS taxonomy – can fruitfully be used to enhance current state-of-the-art
modelling approaches.
6.1
Experimental Set-Up
In the following sections, results from three subjective interaction experi-
ments with the BoRIS restaurant information system will be discussed. The
experiments have been carried out with slightly differing system versions dur-
ing the period 2001-2002. Because the aim of each experiment was different,
also the evaluation methods varied between the experiments. In particular, the
following aims have been accomplished:
Experiment 6.1: Scenario, questionnaire and test environment design and
set-up; analysis of the influence of different system parameters on quality.
This experiment is described in detail by Dudda (2001), and part of the
results have been published in Pellegrini (2003).
Experiment 6.2: Questionnaire design and investigation of relevant quality
aspects. This experiment is described in Niculescu (2002).
Experiment 6.3: Analysis and validation of the QoS taxonomy; analysis of
the influence of different system configurations on quality aspects; analysis
and definition of existing and new quality prediction models. The experi-
ment is described in Skowronek (2002), and some initial results have been
published in Möller and Skowronek (2003a,b).
Experiments 6.1 and 6.3 follow the steps mentioned in the introduction, allowing
for a comparison between interaction parameters and subjective judgments.
Experiment 6.2 is limited to the collection of subjective judgments, making use
of guided interviews in order to optimally design the questionnaire.
Quality of Spoken Dialogue Systems
241
6.1.1
The BoRIS Restaurant Information System
BoRIS, the “Bochumer Restaurant-Informations-System”, is a mixed-initia-
tive prototype spoken dialogue system for information on restaurants in the area
of Bochum, Germany. It has been developed by the author at the Institut dalle
Molle d’Intelligence Artificielle Perceptive (IDIAP) in Martigny, Switzerland,
and at the Institute of Communication Acoustics (IKA), Bochum. The first
ideas were derived from the Berkeley restaurant project (BeRP), see Jurafski
et al. (1994). The dialogue structure was developed at Ecole Polytechnique
Fédéral
e
de Lausanne (EPFL), Switzerland (Rajman et al., 2003). Originally,
the system was designed for the French language, and for the restaurants in
Martigny. This so-called “Martigny Restaurant Project” (MaRP) was set up
in the frame of the Swiss-funded Info Vox project. Later, the system has been
adapted to the German language, and to the Bochum restaurant environment.
The system architecture follows, in principle, the pipelined structure depicted
in Figure 2.4. System components are either available as fully autonomously
operating modules, or as wizard simulations providing control over the module
characteristics and their performance. The following components are part of
BoRIS:
Two alternatives for speech input: A commercially available speech rec-
ognizer with keyword-spotting capability (see Section 4.3), able to recog-
nize about 395 keywords from the restaurant information domain, including
proper names; or a wizard-based ASR simulation relying on typed input
from the wizard, see Section 6.1.2.
A rough keyword-matching speech understanding module. It consists of a
list of canonical values which are attributed to each word in the vocabulary.
On the basis of the canonical value, the interpretation of the user input in
the dialogue context is determined.
A finite-state dialogue model, see below.
A restaurant database which can be accessed locally as a text file, or through
the web via an HTML interface. The database contains around 170 restau-
rants in Bochum and its surroundings. Searches in this database are based
on pattern matching of the canonical values in the attribute-value pairs.
Different speech generation possibilities: Pre-recorded speech files for the
fixed system messages, be they naturally produced or with TTS; and naturally-
produced speech or full TTS capabilities for the variable restaurant infor-
mation turns. This type of speech generation makes an additional response
generation unnecessary, except for the variable restaurant information and
the confirmation parts where a simple template-filling approach is chosen.
242
The system has been implemented in the Tcl/Tk programming language on
the Rapid Application Developer platform provided by the CSLU Toolkit, see
Section 2.4.3 (Sutton et al., 1996, 1998). This type of implementation implies
that no strict separation between application manager and dialogue manager
exists, a fact which is tolerable for the purpose of a dedicated experimental
prototype. The standard platform has been amended by a number of specific
functions like text windows for typed speech input and text output display, a
display for internal system variables (e.g. recognized user answer, current and
historical canonical slot values, state-related variables, database queries and
results), windows for selecting different confirmation strategies, wizard control
options, etc. The exchange of data between the dialogue manager and the
speech recognition and TTS modules is performed in a blackboard way via
files.
The system can be used either with a commercial speech recognizer, or with
a wizard-based speech recognition simulation. For the commercial ASR mod-
ule, an application-specific vocabulary has been built on the basis of initial
WoZ experiments. Because the other characteristics of the recognizer are not
accessible to the author, feature extraction and acoustic models have been kept
in their default configuration. The recognition simulation has been developed
by Skowronek (2002). It is based on a full transcription of the user utterances
which has to be performed by the wizard (or an additional assistant) during the
interactions. The simulation tool generates typical recognition errors on this
transcription in a controlled way. Details on the simulation tool are given in
Section 6.1.2. Using the simulation, it becomes possible to adjust the system’s
ASR performance to a pre-defined value, within a certain margin. A disad-
vantage is, however, that the wizard does not necessarily provide an error-free
transcription. In fact, Skowronek (2002) reports that in some cases words in the
user utterances are substituted by others with the same meaning. This shows
that the wizard does not really act as a human “recognizer”, but that higher
cognitive levels seem to be involved in the transcription task.
The system is able to give information about the restaurants in Bochum and
the surrounding area, more precisely the names and the addresses of restaurants
which match a user query. It does not permit, however, a reservation in a
selected restaurant, nor does it provide more detailed information on the menu
or opening hours. The task is described in terms of five slots containing AVPs
which characterize a restaurant: The type of food (Foodtype), the location of
the restaurant (Location), the day (Date) and the time (Time) the user wants to
eat out, and the price category (Price). Additional slots are necessary for the
dialogue management itself, e.g. the type of slot which is addressed in a specific
user answer, and logical operations (“not”, “except”, etc.). On these slots,
the system performs a simple keyword-match in order to extract the semantic
content of a user utterance. It provides a rough help capability by indicating
Quality of Spoken Dialogue Systems
243
its functionality and potential values for each slot. On the other hand, it does
not understand any specific “cancel” or “help” keywords, nor does it allow user
barge-in.
It is the task of the dialogue module to collect the necessary information
from the user for all slots. In the case that three or fewer restaurant solutions
exist, only some of the slots need to be filled with values. The system follows a
mixed-initiative strategy in that it also accepts user information for slots which
the system did not ask for. Meta-communication and clarification dialogues are
started in the case that an incoherence in the user utterance is detected (non-
understanding of a user answer, user answer is out of context, etc.). Different
confirmation strategies can be selected: Explicit confirmation of each piece of
information understood by the system (Skowronek, 2002), implicit confirma-
tion with the next request for a specification, or summarizing confirmation. The
latter two strategies are implemented with the help of a specialized HTML page,
see Dudda (2001). In the case that restaurants exist which satisfy the require-
ments set by the user, BoRIS indicates names and addresses of the restaurants
in packets of maximally three restaurants at a time. If no matching restau-
rants exist, BoRIS offers the possibility to modify the request, but provides no
specific information as to the reason for the negative response. The dialogue
structure of the final module used in experiment 6.3 is depicted in Appendix C,
Figures C.1 to C.3.
On the speech generation side, BoRIS makes use of pre-recorded messages
for the fixed system utterances, and messages which are concatenated according
to a template for the variable restaurant information utterances and for the
confirmation utterances. Both types of prompts can be chosen either from pre-
recorded natural speech, or from TTS. Natural prompts have been recorded
from one male and one female non-expert speaker in an anechoic environment,
using a high-quality AKG C 414 B-ULS microphone. Synthesized speech
prompts were generated with a TTS system developed at IKA. It consists of the
symbolic text pre-processing unit SyRUB (Böhm, 1993) and the synthesizer
IKAphon (Köster, 2003). and phone length modelling is performed as
described by Böhm. The inventory consists of variable-length units which are
concatenated as described by Kraft (1997). These units have been recorded
from a professional male speaker, and are stored in a linear 16 bit PCM coding
scheme. Because the restaurant information and the confirmation prompts are
concatenated from several individual pieces without any prosodic manipulation,
they show a slightly unnatural melody. This fact has to be taken into account
in the interpretation of the according results.
Test subjects can interact with the BoRIS system via a telephone link which
is simulated in order to guarantee identical transmission conditions. This tele-
phone line simulation system has already been described in Section 4.2. For the
244
experiments reported in this chapter, the simulation system has been set to its
default transmission parameter values given in Table 2.4. A handset telephone
with an electro-acoustic transfer characteristic corresponding to a modified IRS
(ITU-T Rec. P.830, 1996) is used by the test subjects. On the wizard’s side, the
speech signal originating from the test subjects can be monitored via headphone,
and the speech originating from the dialogue system is directly forwarded to
the transmission system, without prior IRS filtering. All interactions can be
recorded on DAT tape for a later expert evaluation.
The BoRIS system is integrated in an auditory test environment at IKA. It
consists of three rooms: An office room for the test subject, a control room
for the experimenter (wizard), and a room for the set-up of the telephone line
simulation system. During the tests, subjects only had access to the office room,
so that they would not suspect a wizard being behind the BoRIS system. This
procedure is important in order to maintain the illusion of an automatically
working system for the test subject. The office room is treated in order to limit
background noise, which was ensured to satisfy the requirements of NC25
(Beranek, 1971, p. 564-566), corresponding to a noise floor of below 35 dB(A).
Reverberation time is between 0.37 and 0.50 s in the frequency range of speech.
The room fulfills the requirements for subjective test rooms given in ITU-T Rec.
P.800 (1996).
6.1.2
Speech Recognition Simulation
In order to test the influence of speech recognition performance on different
quality aspects of the service, the recognition rate of the BoRIS system should
be adjustable within certain limits. This can be achieved with the help of a
recognition simulation which is based on an on-line transcription of each user
utterance by a wizard, or better – as has been done in experiment 6.3 – by an
additional assistant to the wizard. A simple way to generate a controlled number
of recognition errors on this transcription would be to substitute every tenth,
fifth, fourth etc. word by a different word (substitution with existing words or
with non-words, or deletion), leading to an error rate of 10%, 20%, 25% etc.
This way, which has been chosen in experiment 6.1, does however not lead to
a realistic distribution of substituted, deleted and inserted words. In particular,
sequence effects may occur due to the regularity of the errors, as has clearly
been reported by Dudda (2001).
To overcome the limitations, Skowronek (2002) designed a tool which is able
to simulate recognition errors of an isolated word recognizer in a more realistic
and scalable way. This tool considerably facilitates the wizard’s work and
generates error patterns which are far more realistic, leading to more realistic
estimates of the individual interaction parameters related to speech input. The
basis of this simulation is a confusion matrix which has been measured with
the recognizer under consideration, containing the correctly identified word
Quality of Spoken Dialogue Systems
245
counts in the main diagonal cells, and the confused word counts in the other
cells. This matrix has been generated as a part of the experiments of Chapter 4.
It has been amended by an additional row and column for the inserted and
deleted words. The matrix corresponds to a reference recognition rate
(percentage of correctly identified words) which can be calculated by
In this and in the following equations, the index refers to the rows which
contain the reference words, and to the columns of the matrix which contain
the “recognized” output words.
The matrix now has to be scaled in order to reach a (simulated) target recog-
nition performance by up-scaling the elements of the main diagonal and
lowering the other ones when or by doing the opposite when
The corresponding scaling will be different for each matrix ele-
ment of the scaled matrix It has to satisfy the following boundary
conditions which result from the limiting recognition rates:
(a)
Target recognition rate 100%:
In this case, all elements outside the main diagonal are added to the values
in the main diagonal, and the out-of-diagonal values are then set to zero.
(b)
Target recognition rate
In this case, no change in the confusion matrix takes place.
(c)
Target recognition rate 0%:
In this case, all elements of the main diagonal have to be set to zero, and
their counts have to be distributed to the out-of-diagonal elements. The
following method is used to achieve this goal:
All elements of a row with exception of element are multiplied with
a factor is determined in a way that the sum of all scaled elements
in the row is identical to the sum of all elements in the reference matrix row.
It follows: