Quality of Telephone-Based Spoken Dialogue Systems phần 7 potx
Bạn đang xem bản rút gọn của tài liệu. Xem và tải ngay bản đầy đủ của tài liệu tại đây (3.63 MB, 53 trang )
270
all relate to the system’s output voice (dimensions intelligibility, friendliness
and voice naturalness). The friendliness of the system thus seems to be highly
related to its voice. The final dimension ‘clarity of information’ does not form
a cluster with any of the other questions.
These clusters can now be interpreted in the QoS taxonomy. The ‘personal
impression’ cluster is mainly related to comfort, the ‘pleasantness’ question
(B24) to user satisfaction as well. Cluster 2 (dialogue smoothness, B19 and
B21) forms one aspect of communication efficiency. The global quality aspects
covered by questions B0 and B23 (Cluster 3) mainly relate to user satisfaction.
The strong influence of the ‘perceived system understanding’ question (B5) on
this dimension has already been noted. This question is however located in the
speech input/output quality category of the QoS taxonomy. Cluster 4 is related
to system behavior (B9, B10 and B11), and can be attributed to dialogue coop-
erativity, question B10 also to dialogue symmetry. The questions addressing
interaction flexibility (B13 and B14) belong to the dialogue symmetry category.
‘Naturalness’ (B12 and B18) is once again related to both dialogue cooperativ-
ity and dialogue symmetry. These two categories cannot be clearly separated
with respect to the user questions. Questions B15, B17 and B20 all reflect com-
munication efficiency. Cluster 8, related to informativeness (B1, B2 and B4),
is attributed to the dialogue cooperativity category. This is not true for Cluster
9 (B6 and B8): Whereas B8 is part of dialogue cooperativity, B6 fits best to
the comfort category. Cluster 10 (B7, B16 and B22) is mainly related to the
speech output quality category. However, question B16 also reflects the agent
personality aspect, and thus the comfort category. The stand-alone question B3
is part of the dialogue cooperativity category.
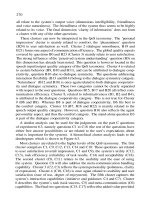
A similar analysis can be used for the judgments on the part C questions
of experiment 6.3, namely questions C1 to C18 (the rest of the questions have
either free answer possibilities or are related to the user’s expectations about
what is important for the system). A hierarchical cluster analysis leads to the
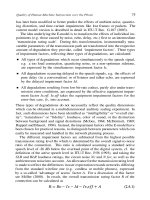
dendrogram which is shown in Figure 6.3.
Most clusters are related to the higher levels of the QoS taxonomy. The first
cluster comprises C1, C9, C12, C13, C14 and C18: These questions are related
to user satisfaction (overall impression, C1 and C9), the system’s utility (C12,
C13), task efficiency (reliability of task results, C14) and acceptability (C18).
The second cluster (C8, C11) relates to the usability and the ease of using
the system. Question C8 will also address the meta-communication handling
capability. Cluster 3 (C2, C3) reflects the system personality (politeness, clarity
of expression). Cluster 4 (C10, C16) is once again related to usability and user
satisfaction (ease of use, degree of enjoyment). The fifth cluster captures the
system’s interaction capabilities (initiative and guidance; C4 and C7). Cluster
6 describes the system’s task (task success, C5) and meta-communication (C6)
capabilities. The final two questions (C15, C17) reflect the added valueprovided
Quality of Spoken Dialogue Systems
271
Figure 6.3. Hierarchical cluster analysis of part C question ratings in experiment 6.3. Dendro-
gram using average linkage between groups.
by the service, and are thus also related to the service efficiency category.
Also the part C questions have been associated with the categories of the QoS
taxonomy, see Figure 6.1 and Tables 6.5 and 6.6.
Similar to the factor analysis, the cluster analysis shows that many questions
of part B and part C of the experiment 6.3 questionnaire group into categories
which have been previously postulated by the QoS taxonomy. Part B ques-
tions can mainly be associated with the lower levels of the taxonomy, up to
communication efficiency, comfort and, to some extent, task efficiency. On the
other hand, part C questions mostly reflect the higher levels of the taxonomy,
namely service efficiency, usability, utility and acceptability. User satisfaction
is covered by both part B and part C questions. The relationship shown in
Figure 6.1 will be used in Section 6.2.4 to identify subjective ratings which can
be associated to specific quality aspects.
The results of multidimensional analyses give some indications on the rel-
evance of individual quality aspects for the user, in that they show which di-
mensions of the perceptual space can be distinguished. The relevance may
additionally be investigated by directly asking the users which characteristics
of a system they rate as important or not important. This was done in Question
4 (4.1-4.15) of experiment 6.2, and Questions A8 and C22 of experiment 6.3.
The data from experiment 6.2, which will be discussed here, have been ranked
with respect to the number of ratings in the most positive category and
in case of equality to the accumulated positive answers to the statements (two
categories close to the “agree” label, and minus the accumulated number
272
Quality of Spoken Dialogue Systems
273
of negative answers (two categories close to the “disagree” label, and
The resulting rank order is depicted in Table 6.7.
The rank order shows that manner, transparency and relevance, and partly
also meta-communication handling and interaction control seem to be of major
importance to the users. The result may be partly linked to the particularities
of the BoRIS system (repetition capability, modification capability), but the
three major aspects – manner, transparency and relevance – will be of general
importance for other applications as well. They are all related to the basic
communicative and functional capabilities of the system (service aspects have
not been addressed by questions 4.1 to 4.15). The highest ranking is observed
for the speech input and output capabilities, which is the basic requirement for
the interaction with an SDS. The overall system quality seems to be largely af-
fected by a relatively low intelligibility of the TTS speech output. Transparency
subsumes the transparency of how to use the system, as well as its functional
capabilities. This quality aspect seems to reflect whether the user knows what
to say to the system at each step in the dialogue, in which format, as well as the
system’s navigation (modification, repetition and dialogue continuation) capa-
bilities. It may result in discomfort and stress if the system is not transparent
enough. Relevance can be defined on an utterance level (relevance of each
utterance in the immediate dialogue context) or on a global information (task)
level. In the qualitative interview, it turned out that the global information level
seems to pose problems with the current BoRIS version, due, in part, to database
problems, but also due to the low detail of information provided by the current
system version.
The user’s background knowledge and the level of experience play a role in
the judgement of overall quality. The qualitative interview of experiment 6.2
shows that test subjects who had no specific idea about such a system rated it
generally better than persons with a specific idea. In the questionnaire, high
expectations resulted mainly in more positive quality judgments after using the
system. This could clearly be observed for the judgments of the female test
subjects.
6.2.3
Multidimensional Analysis of Interaction Parameters
Apart from the users’ quality judgments, also the interaction parameters
will be related to each other. Such relations – if they are known – can be
used to define meaningful evaluation metrics, and to interpret the influences of
individual system components. This section will give a brief overview about
relationships which are reported in the literature and present the results of a
factor and cluster analysis of the data collected in experiment 6.3. A deeper
analysis with respect to the QoS taxonomy follows in the subsequent section.
274
A number of analyses report the obvious relationship between dialogue du-
ration DD and turn-related parameters. For example, Polifroni et al. (1992)
found out that the overall number of user queries correlates highly with DD
The correlation between DD and the number of unanswered user
queries was considerably lower The different problem-solving
strategies applied in the case of misunderstandings probably have a significant
impact on the duration of the interactions. Sikorski and Allen (1997) investi-
gated the correlation between dialogue duration and recognition accuracy. The
correlation turned out to be unexpectedly low The authors indicate
three potential reasons for this finding:
A robust parsing strategy, which makes it more important which words are
correctly recognized than how many.
Misunderstandings, i.e. the system taking an action based on erroneous
understanding, seems to be more detrimental to task success than non-
understanding, where both the system and the user are aware of the situation.
A system which is robust in this respect (i.e. one that tries to form an inter-
pretation even when there is low confidence in the input) can create a high
variance in the effectiveness of an interaction, and thus in the length of the
interaction.
A certain amount of nondeterminism (random behavior) in the system im-
plementation, which could not be compensated for by the small number of
test subjects.
Thus, the dialogue strategy may be a determining factor of dialogue duration,
although the number of turns remains an important predictor.
Several parameters indicate speech input performance on different levels.
Gerbino et al. (1993) compared absolute figures for correctly understood sen-
tences in a field test (30.4% correct, 21.3% failed, 39.7% incorrect) to the ones
in a laboratory situation (72.2% correct, 11.3% failed, 16.5% incorrect). Obvi-
ously, the field test situation was considerably more difficult for the recognizer
than a laboratory situation. For the field test situation, the figures can be com-
pared to the recognition accuracy (SA = 14.0%, WA = 52.4%). It turns out
that the understanding error rate is approximately in the middle of the word and
sentence error rates.
The relation between ASR performance (WA) and speech understanding
performance (CA) was also investigated by Boros et al. (1996). Both mea-
sures can differ considerably, because WA does not make a difference between
functional words and filler words. Thus, perfect CA can be reached without
perfect WA. On the other hand, CA may become lower than WA when words
which are relevant for understanding are missing in the system’s interpretation.
Results from a test corpus recorded over the public telephone network how-
Quality of Spoken Dialogue Systems
275
ever showed that WA and CA have a strong correlation, resulting in a nearly
linear relationship between WA and CA. For the tested system, WA seems
to be a good predictor for CA, as speech recognizer and parser collaborate
smoothly. In general, it cannot however be guaranteed that an increase in ASR
performance will always lead to better speech understanding capabilities. If
new words are added to the ASR vocabulary, this could provoke a degradation
of speech understanding performance. Investigations carried out at MIT (Po-
lifroni et al., 1998) however showed that a decrease in word error (from 21.7%
to 16.4%) also resulted in a decrease of sentence error (42.5% to 34.3%) and
in speech understanding error (31.7% to 23.8%). All in all, relatively strong
correlations between the ASR and speech understanding performance measures
can be observed.
Speech recognition and speech understanding performance will also be re-
lated to task success. Rosset et al. (1999) illustrate the relationship between
word error rate and task success for two system configurations which differ in
terms of a rejection threshold for poorly recognized words. Implementation of
such a threshold resulted in an increasing task success rate, especially for high
word error rates. Transaction success is however not necessarily closely linked
to speech understanding performance. Gerbino et al. (1993) report that their
system had a task success rate of 79% with only 30.4% correctly understood
sentences. Better predictors of task success may be found in the system-answer-
related parameters. Goodine et al. (1992) compared the percentage of correctly
resolved scenarios (as a measure of task success), the AN:CO parameter, and
It turned out that AN:CO was a good indicator of task success, but
that the parameter over-penalizes incorrect system answers.
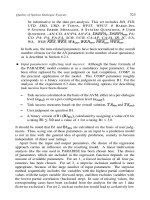
During experiment 6.3, a more-or-less complete set of interaction parameters
was collected. On this set, a factor analysis has been carried out, in the same
way as was done for the quality judgments (principal component analysis with
Varimax rotation and Kaiser normalization, missing values were replaced by
means). The complete results will not be reproduced here due to space limi-
tations; only a short summary will be given. 10 factors were extracted which
accounted for 81.9% of the variance in the parameter data.
Factor 1 loads high on all speech-input related parameters (IC, UA,
WER, WA, as well as on the
parsing parameters (PA:CO and PA:FA) and on Apparently, this
factor is related to the speech input capabilities. Factor 2 loads high on the
duration-related parameters DD, STD, SRD, # TURNS, WPST and WPUT,
and seems to be related to communication efficiency (additional loading on
PA:PA
)
. Factor 3 seems to be related to the system’s meta-communication
capabilities. It loads high on SCR, UCR, CA:AP, CA:IA, IR and PA:FA.
Factor 4 is related to the system’s answer capability. It has very high load-
ings on AN:CO, AN:FA, and Factor 5 reflects task
276
success: Loadings are high for and Interestingly, the per-
configuration version of does not show a high loading. Apparently, the sys-
tem configuration plays a significant role for determining task success. Factor
6 might be explained by the cognitive demand put on the user. It only shows
high loadings on UTD and URD. The last four factors are difficult to interpret.
They only show high loadings on one or two interaction parameters which are
not obviously related.
Figure 6.4. Hierarchical cluster analysis of interaction parameters in experiment 6.3. Dendro-
gram using average linkage between groups.
Links between interaction parameters can additionally be addressed by a hi-
erarchical cluster analysis, as was performed for the subjective judgments. The
resulting dendrogram is shown in Figure 6.4. The first cluster contains three pa-
Quality of Spoken Dialogue Systems
277
rameters which are all related to meta-communication (system error messages,
partially correct answers, and the DARPA error). The next cluster contains two
parameters related to communication efficiency
(
DD and # T
URNS
). The third
cluster relates once again to meta-communication, in particular to the correc-
tion capabilities (correction rates, inappropriate system utterances, and failed
speech understanding). Cluster 4 contains 6 parameters related to speech recog-
nition, and thus to the speech input quality of the system. The # B
ARGE
-I
NS
parameter seems to be independent of all other parameters.
The following cluster consists of 7 parameters which all seem to be related to
communication efficiency: STD, SRD, WPUT, WPST
and
# U
SER
Q
UES
-
TIONS
all
carry
a
direct impact
on the
dialogue length,
and
PA:PA
and
AN:FA
willalso contribute to lengthening of the dialogue due to subsequent clarification
dialogues. The next cluster is somehow related to task efficiency. It contains
the two task success measures and and two parameters which
reflect the number of correct system answers
(
AN:CO and The
following two parameters (URD and UTD) do not form a cluster in a proper
sense. They reflect the characteristics of the user, but cannot be interpreted with
respect to their quality impact. The next 8 parameters all relate to speech input
quality: The first group of three parameters addresses ASR performance, and
the second group of five parameters addresses speech understanding perfor-
mance. It is interesting to note that the parameter forms a cluster with the
word accuracy measures. This is an indication that the recognition rate seems
to play an important role for task success, and that task success (as expressed
by the coefficient) will depend on the target recognition rate of the system
configuration under test. In the group of speech-understanding-related param-
eters, the CA:AP parameter has to be noted. Apparently, appropriate system
answers are related to the system’s speech understanding capability. The final
two parameters do not form any specific cluster. In particular, no clustering of
with the other task-success-related parameters can be observed.
Both cluster and factor analysis show that interaction parameters mostly ad-
dress the lower level categories of the QoS taxonomy, namely speech input
quality, dialogue cooperativity, communication efficiency, task efficiency, and
comfort. This finding has to be placed in contrast to the higher level cate-
gories reflected in the dimensions of the user judgments, e.g. usability, service
efficiency, user satisfaction and acceptability. Although individual questions
(mainly part B questions) can be attributed to the lower level categories, the
more wholistic user view of the service, discussed in Chapter 3, is confirmed
here.
The finding may have some implications for the construction of prediction
models for SDS-based services: If interaction parameters mainly address low-
level categories and the user judges in high-level categories, then it might be
278
difficult to predict global quality aspects perceived by the user from interaction
parameters. Kamm et al. (1997a) already noted relatively weak correlations
between users’ perceptions of system quality and system performance metrics.
It may be an indication that global quality aspects are not the right target to be
predicted from interaction parameters, but that individual quality aspects are
more adequate for this purpose. The idea will be further discussed in Section 6.3.
6.2.4
Analysis of the QoS Schematic
The factor and cluster analyses described in the previous two sections high-
light the relationships amongst subjective quality judgments or interaction pa-
rameters. The extracted factors have been interpreted in the light of the QoS
taxonomy introduced in Section 2.3.1, however without giving further justifica-
tion for the classification it defines. In this section, the individual categories of
the taxonomy will be initially addressed in isolation, showing the correlations
between subjective judgments and interaction parameters. The findings will
then be interpreted with respect to the prediction potential for global quality
aspects like the ones addressed by questions B0 or C18.
A correlation analysis for the individual categories of the QoS taxonomy is
described in the following discussion. As most of the parameters and subjective
judgments do not show a gaussian distribution when accumulated over all sys-
tem configurations, Spearman rank order correlation coefficients have been
chosen. The correlation tables contain all parameters and questions which have
been attributed to a specific category (see Tables 6.5,6.6, and Figure 6.1 for the
subjective ratings, and Tables 3.1 and 3.2 for interaction parameters), as well
as all additional parameters which show a correlation with one of the
associated questions. Correlations which are significant are given
in italics.
Quality of Spoken Dialogue Systems
279
Informativeness:
The relevant questions and parameters are listed in Table 6.8. High correla-
tions are observed between questions Bl and B2, as well as between
and AN:CO. Apparently, the accuracy and the completeness of
the provided information are not easy to distinguish for the test subjects. Corre-
lation between questions and parameters is very low, with the exception of B1
which moderately correlates with and AN:CO. These
parameters are however only calculated for 18 dialogues, and the correlations
should be interpreted with care. # U
SER QUESTIONS is not correlated with
any other question or parameter of the list. This corresponds to the wizard’s
observation that most users were asking questions in order to assess the system
functionality, and not with respect to the restaurant information provided by
the system.
Truth and evidence:
Four questions and five parameters are related to this aspect, see Table 6.9.
All questions correlate moderately However, only question
B11 also shows some (moderate) correlation to the relevant parameters. The
generally low correlations may be an indication that the perception of truth by
the test subjects does not necessarily require system answers to be correct from
an external point of view. In fact, the test subjects have no possibility to verify
the correctness of information provided by the system, except when the system
gives explicit feedback on misunderstood items. The high correlations between
and AN:CO have already been noted. Also AN:FA
shows high correlations to these parameters.
Relevance:
Relevance is an aspect which is only indirectly covered in the user judg-
ments, namely via questions related to perceived system understanding (B5),
280
perceived system reasoning (B9, B10 and B11), and to the naturalness of the
interaction (B12, B18). Only the # B
ARGE
-I
NS
parameter may address this
aspect. Correlations between B5, B9, B10 and B11 on the one hand, and B12
and B18 on the other, are moderately high The number of
barge-ins does not correlate with any of the questions, which may however be
due to the fact that this parameter is only in rare cases different from zero.
Manner:
Table 6.11 shows correlations between five questions (B8, B10, B17, B19
and C2) and two parameters (# T
URNS
, WPST) related to the manner of
expression. Both interaction parameters highly correlate, but they only show
weak to moderate correlations to the questions. Question C2 does not show
any correlation with the part B questions. A factor analysis of all questions and
Quality of Spoken Dialogue Systems
281
parameters related to manner has been carried out, see Table 6.12. It reveals
two factors explaining 56.2% of the variance: Factor 1 loading high on B8, B10
and B19, and tentatively labelled “transparency of the interaction”, and Factor
2 loading high on B17, # T
URNS and WPST, labelled “system utterance
length”. The manner aspect seems to cover at least these two dimensions.
Background knowledge:
Although Table 3.1 indicates four interaction parameters related to the back-
ground knowledge aspect, only the # B
ARGE-INS parameter can be used for
the analysis, see the discussion in Section 6.2.1. In addition, questions B4, B8
and B10 address this aspect. No remarkable correlation can be observed, see
Table 6.13. The questions indicate that background knowledge covers both the
knowledge related to the task and to the interaction behavior.
Meta-communication handling:
Meta-communication is addressed by questions C4, C6, C8, and the inter-
action parameters # S
YSTEM
ERROR MESSAGES, SCR, and IR (the param-
282
eters # H
ELP
R
EQUESTS
and # C
ANCEL
A
TTEMPTS
being excluded from
the analysis). Whereas the correlations between the questions are moderate,
the interaction parameters do not correlate well with any of the questions. This
finding might be explained by the fact that the questions are rated after the
whole test session, whereas the interaction parameters are determined for each
dialogue.
Dialogue cooperativity:
The dialogue cooperativity category covers all aspects analyzed so far. It may
now be interesting to see which dimensions are relevant for this category, and
in how far the mentioned aspects are reflected in the dimensions. Fortunately,
the number of appropriate system utterances CA: AP is, by definition, a direct
measure of dialogue cooperativity. Thus, an analysis of covariance with this
parameter as the dependent variable may indicate the main contributing factors
to cooperativity. The result of this analysis is depicted in Figure 6.5.
Apparently, only questions B2 and B5 carry a significant influence on CA:AP,
and B11 is close to the significance level. These three questions refer to dif-
ferent aspects of cooperativity: Whereas B2 is directly linked to the system’s
informativeness, B5 describes the perceived system understanding. The latter
aspect is mainly attributed to the speech input/ooutput quality category, but also
reflects the relevance of system messages (category cooperativity). Question
B11 refers to the errors made by the system. It is related to the relevance of
system messages, but in addition it depends on the background knowledge of
the user, and results in meta-communication necessary for a clarification. Thus,
at least the four aspects informativeness, relevance, background knowledge and
meta-communication handling carry a significant contribution to dialogue co-
operativity defined by the CA:AP measure. The truth and evidence aspect
may be under-estimated in the test situation. Users do not feel in a realistic
situation and cannot verify the given information. It is however astonishing
Quality of Spoken Dialogue Systems
283
Figure 6.5. Univariate analysis of covariance for dialogue cooperativity. Covariate factors are
part B and C questions.
that none of the manner-related questions shows a significant contribution to
cooperativity. It may be the case that it is difficult for the test subjects to distin-
guish between the content-related manner aspect and the form-related speech
input/output quality category.
A correlation analysis (which is not reproduced here) shows how CA:AP
is related to the questions and interaction parameters belonging to the indi-
vidual quality aspects. High correlation levels are only obtained for
and obviously for
which is the inverse measure. Apparently, the cooperativity of system answers
is largely dependent on the system’s correction and recovery strategies. This
finding will have a general validity for SDSs with limited speech recognition,
understanding and reasoning capabilities.
Initiative:
Question C7 directly addresses the initiative experienced by the user, and
questions B8, B10, B12 and B18 describe the system behavior with respect
to the user’s expectations and the human background. Correlations between
part B questions are relatively low, except for B12 and B18 (both related to the
naturalness of the interaction). C7 does not correlate with any other question
or interaction parameter. The highest correlations between questions and in-
284
teraction parameters are observed between B8, B10, # TURNS, WPST and
WPUT, but they are still very limited. The mentioned parameters are mod-
erately correlated with each other, but with the exceptions of SCR and UCR
no other correlations larger than 0.5 are obtained. The correlation between
Quality of Spoken Dialogue Systems
285
# T
URNS
and WPST indicates that a talkative system seems to provoke more
system and user turns, and also more talkative users (correlation with WPUT).
The correlation between SCR and UCR can be explained by the way these
variables are coded, see Appendix D.3.
Interaction control:
Questions B13 and B14 relate to this aspect, as well as the # B
ARGE
-I
NS
and UCR parameters (the other parameters of Table 3.1 have not been included
in the analysis, see Section 6.2.1). The three parameters AN:CO,
and have been added because of their moderate correlation with
question B14. No obvious reason for this correlation can be found, but these
parameters could only be calculated for 18 dialogues, and the results should
consequently be interpreted with care. # B
ARGE
-I
NS
and UCR do not cor-
relate with any of the interaction-control-related questions. Only between the
questions a moderate correlation of can be observed.
Partner asymmetry:
A number of questions relate to this aspect, namely B8, B10, B12, B18,
B19 and C11, but only one interaction parameter (# B
ARGE
-I
NS
). Moderate
correlations are observed between B8/B10 and B19, which are all related to the
transparency of the dialogue, and between B12 and B18 which are related to the
naturalness. These two dimensions seem to contribute to the partner asymmetry
aspect. Question C11 relates to the functional capabilities of the system. Only
low correlations are found for this question.
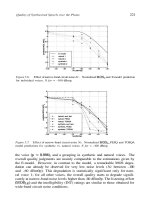
Speech output quality:
It has already been noted that no interaction parameters are known which
relate to speech output quality, see Section 3.8.5. Thus, this aspect has to be
investigated via subjective ratings only, namely the ones in questions B6, B7,
B16 and B22. As Table 6.19 shows, the correlations are only moderate or
low. This is an indication that the questions address different dimensions of
286
speech output quality which are independently perceivable by the test subjects.
Moderate correlations are observed between B6 and B7 (listening-effort and
intelligibility), and between B7, B16 and B22 (intelligibility, friendliness and
naturalness). Nevertheless, it is justifiable to collect judgments on all those
questions in order to better capture different speech output quality dimensions.
Speech input quality:
This aspect is addressed by a large number of interaction parameters, and by
questions which relate to the perceived system understanding (B5), and those
related to the perceived system reasoning (B9, B10 and B11). The correlations
between the two perceptive dimensions are all moderate
indicating that they are somehow related. Interestingly, the correlations between
questions and interaction parameters are all very low; the highest values are
observed for the PA:FA parameter Apparently, the perceived
system understanding and reasoning is not well reflected in speech recognition
or understanding performance measures. This finding is in agreement with the
one made by Kamm et al. (1997a), with the correlation coefficients in the same
order of magnitude.
Quality of Spoken Dialogue Systems
287
There are however strong correlations between the interaction parameters.
Very close relationships are found between WA, WER, and both
for the continuous as well as for the isolated ASR measures. The relationships
between the corresponding continuous and isolated measures are in the area
of On the speech understanding level, strong correlations are
observed between IC and UA, and moderate correlations also to the parsing-
related parameters. # SYSTEM ERROR MESSAGES is not correlated with
any of the other selected parameters. For future investigations, the number of
interaction parameters addressing the speech input aspect could be reduced,
e.g. to the four parameters WER or WA (either continuous or isolated speech
recognition), # S
YSTEM
E
RROR
M
ESSAGES
, a parsing-related parameter, and
either IC or UA. With this reduced set, the main characteristics of speech
recognition and speech understanding can be captured.
Speed:
This aspect is addressed by question B15, as well as by STD, UTD, SRD,
URD, and # B
ARGE
-I
NS
. Correlations between B15 and interaction parame-
ters are all very low, see Table 6.22. Moderate correlations are found between
UTD, SRD and URD, and also between SRD and STD. The relationship
between UTD and SRD can be explained by the “processing time” needed by
288
the wizard to transcribe the user utterances. SRD and URD may be related be-
cause a quickly responding system may also invite the user to respond quickly.
For the other relations, no obvious explanation has been found. As has been
observed in the other analyses, the # B
ARGE-INS parameter does not correlate
with any of the other entities.
Quality of Spoken Dialogue Systems
289
Conciseness:
The dialogue conciseness is addressed by questions B17 and B20, as well
as by four interaction parameters. Only B20 is moderately correlated to DD
and # T
URNS, but B17 does not show any high correlation to the interaction
parameters. This result is astonishing, because one would expect at least a
correlation with WPST. Apparently, the length of system utterances is not
directly reflected in the user’s perception. A reason might be that system utter-
ances which are interesting and new to the subjects are not perceived as lengthy.
Among the interaction parameters, a high correlation is observed between the
DD and # T
URNS, and a slightly lower value between DD, # TURNS and
WPST. It seems to be sufficient to extract either DD or the # T
URNS param-
eter in future experiments; however, the first one has the advantage of being
extracted fully instrumentally, and the latter is needed for normalization of other
interaction parameters.
290
Dialogue smoothness:
The correlations are given in Table 6.24. Whereas the part B questions all
show moderate correlations to each other question C6 does
not show meaningful correlations to any other question or parameter of the set.
Once again, correlations between questions and interaction parameters are very
low, and only between UCR and SCR can a close relationship be observed
(because these parameters are related by definition, see Appendix D.3).
Agent personality:
This aspect is only addressed by subjective ratings. No specifically high
correlation between the questions is noted. The only correlation value
is between B16 and B22, indicating that the perceived friendliness of the system
is linked to its voice.
Cognitive demand:
Questions B6, B19 and B25 are related to the cognitive demand required
from the user, and the parameter URD, see Table 6.26. Only the questions
show moderate correlations to each other. URD is nearly independent of the
questions. Apparently, it is not a good predictor for the cognitive demand or
stress perceived by the user.
Quality of Spoken Dialogue Systems
291
Figure 6.6. Univariate analysis of covariance for comfort. Covariate factors are part B and C
questions.
Comfort:
Question B24 has been directly attributed to the comfort category, see Ta-
ble 6.6. A univariate analysis of covariance with B24 as the dependent variable
and the other questions related to comfort as the independent variables indicates
the relevant features for this category. The result of this analysis is depicted in
Figure 6.6. Nearly all part B questions (B12, B16, B19, B22 and B25) show a
significant contribution to B24, covering about 72% of the variance. Whereas
B12 and B22 relate to the naturalness of the system’s voice and behavior, B16
addresses the friendliness of the system’s reaction, B19 the transparency of the
interaction, and B25 the stress experienced by the user. Although a high cor-
relation between B24 and B25 has been observed (both refer to the emotional
state of the subject), also naturalness, transparency and friendliness seem to
contribute significantly to the comfort perceived during the interaction. Thus,
if B24 is accepted as a descriptor of comfort, then the two aspects of the comfort
category (agent personality and cognitive demand) have an important relation-
ship to each other.
Task success:
Questions B1, B4, C5 and C14 relate to this aspect, as well as all task success
measures
and The parameters AN:CO,
and have been included because their correlation to B1 exceeds
0.5. Moderate correlations exist between B1 and B4. On the other hand, the
relations between questions and task success measures are all relatively low.
This may be an indication that many test subjects thought they would have
obtained the right information from the system, but in fact they didn’t. As
an example, subjects who asked for a moderately priced Italian restaurant got
information about Italian restaurants in another price category. For a user, such
292
an error cannot easily be identified, also if he/she has the possibility to visit the
restaurant after using BoRIS.
Among the parameters, and are highly correlated, as well as
AN:CO
, and
Interestingly, the correlation between
and is very low, as well as the correlation between the measures
and the TS measures. Thus, both types of task success metrics seem to provide
different types of information: Whereas TS always requires the full agree-
ment of all slots determining a restaurant, also takes partial task success and
the chance agreement into account. A moderate correlation can be observed
between the DARPA measures and the TS measures.
Task ease:
This aspect is only addressed by questions C11, C13 and C16, and no inter-
action parameter showed a correlation higher than 0.5 to one of these questions.
A moderate correlation between C11 and C13 can be observed. A service pro-
vided by the system seems to be more helpful when the user is informed about
its functionality.
Quality of Spoken Dialogue Systems
293
Service efficiency:
This category comprises the aspects of service adequacy and added value. It
is addressed by the questions C12, C13, C15 and C17, from which C12 shows
moderate correlations with C13 and C15, and C15 with C17. C12, C13 and
C15 all seem to be related to the perceived usefulness of the service. C15 and
C17 explicitly address the preference for a comparable interface, be it another
system or a human operator. No interaction parameters seem to be related to
these quality aspects.
Usability:
Usability is addressed by questions C8, C11 and C16. C8 and C11 are
moderately correlated; thus, if the users are adequately informed about the
system’s functionality, handling will be easier for them. It is surprising that C8
and C16 do not show a higher correlation. Both address the ease of handling
the system. However, users may have the impression that they were responsible
for interaction problems, and answer question C8 with “no” although they gave
a positive answer to question C16. It is important to find question wordings
which cannot be misinterpreted in this way.
User satisfaction:
User satisfaction in general is addressed by questions B0, B23 and C1. The
underlying aspects pleasantness (B24, C10) and personal impression (C9) have
additional related questions. Correlations between these questions are shown
in Table 6.31. Because AN:CO, and have moderate
294
correlations to B23, C9 and C10, these parameters have also been included
in the table. Amongst the questions, B0 and B23 are highly correlated (both
indicate the overall satisfaction), and moderate correlations can be seen for B24
with B0 and B23 (the system is rated pleasant when the user is satisfied), and
C1 with C9 (the user is impressed when the overall rating is positive). Once
again, correlations between part B questions (reflecting the individual interac-
tion) and part C questions (reflecting the whole test session) are relatively low.
Correlations between questions and interaction parameters are only moderate,
especially to B23, C9 and C10. The degree of correlation is similar for all
mentioned parameters, as their inter-correlation is very high.
In order to investigate the contribution of the individual questions to the
user satisfaction indicators, an analysis of covariance is performed. B0 (over-
all impression) is taken as the dependent (target) variable, and all other part
B questions are taken as covariate factors, except B23 which is on the same
level and highly correlated with B0. The result is shown in Figure 6.7. Signif-
icant contributors to B0 are B1 (system provided information), B3 (informa-
tion was clear), B5 (perceived system understanding), B6 (listening-effort) and
B24 (pleasantness). B4 (truth/evidence) and B13 (system flexibility) are close-
to-significant contributors. The significant contributors reflect the low-level
categories speech input/output quality, cooperativity, comfort, task efficiency,
and partly also dialogue symmetry. For the first category, both speech in-
put (perceived understanding) and output (listening-effort) are relevant. In the
cooperativity category, informativeness and relevance seem to be the most im-
portant aspects, followed by truth and evidence. Interestingly, communication