transformer engineering design and practice 1_phần 4 pdf
Bạn đang xem bản rút gọn của tài liệu. Xem và tải ngay bản đầy đủ của tài liệu tại đây (588.2 KB, 41 trang )
35
2
Magnetic Characteristics
The magnetic circuit is one of the most important active parts of a transformer. It
consists of laminated iron core and carries flux linked to windings. Energy is
transferred from one electrical circuit to another through the magnetic field
carried by the core. The iron core provides a low reluctance path to the magnetic
flux thereby reducing magnetizing current. Most of the flux is contained in the
core reducing stray losses in structural parts. Due to on-going research and
development efforts [1] by steel and transformer manufacturers, core materials
with improved characteristics are getting developed and applied with better core
building technologies. In the early days of transformer manufacturing, inferior
grades of laminated steel (as per today’s standards) were used with inherent
high losses and magnetizing volt-amperes. Later on it was found that the
addition of silicon content of about 4 to 5% improves the performance
characteristics significantly, due to a marked reduction in eddy losses (on
account of the increase in material resistivity) and increase in permeability.
Hysteresis loss is also lower due to a narrower hysteresis loop. The addition of
silicon also helps to reduce the aging effects. Although silicon makes the
material brittle, it is well within limits and does not pose problems during the
process of core building. Subsequently, the cold rolled manufacturing
technology in which the grains are oriented in the direction of rolling gave a new
direction to material development for many decades, and even today newer
materials are centered around the basic grain orientation process. Important
stages of core material development are: non-oriented, hot rolled grain oriented
(HRGO), cold rolled grain oriented (CRGO), high permeability cold rolled
grain oriented (Hi-B), laser scribed and mechanically scribed. Laminations with
lower thickness are manufactured and used to take advantage of lower eddy
losses. Currently the lowest thickness available is 0.23 mm, and the popular
thickness range is 0.23 mm to 0.35 mm for power transformers. Maximum
Copyright © 2004 by Marcel Dekker, Inc.
Chapter 236
thickness of lamination used in small transformers can be as high as 0.50 mm.
The lower the thickness of laminations, the higher core building time is required
since the number of laminations for a given core area increases. Inorganic
coating (generally glass film and phosphate layer) having thickness of 0.002 to
0.003 mm is provided on both the surfaces of laminations, which is sufficient to
withstand eddy voltages (of the order of a few volts).
Since the core is in the vicinity of high voltage windings, it is grounded to drain
out the statically induced voltages. If the core is sectionalized by ducts (of about 5
mm) for the cooling purpose, individual sections have to be grounded. Some users
prefer to ground the core outside tank through a separate bushing. All the internal
structural parts of a transformer (e.g., frames) are grounded. While designing the
grounding system, due care must be taken to avoid multiple grounding, which
otherwise results into circulating currents and subsequent failure of transformers.
The tank is grounded externally by a suitable arrangement. Frames, used for
clamping yokes and supporting windings, are generally grounded by connecting
them to the tank by means of a copper or aluminum strip. If the frame-to-tank
connection is done at two places, a closed loop formed may link appreciable stray
leakage flux. A large circulating current may get induced which can eventually
burn the connecting strips.
2.1 Construction
2.1.1 Types of core
A part of a core, which is surrounded by windings, is called a limb or leg.
Remaining part of the core, which is not surrounded by windings, but is essential
for completing the path of flux, is called as yoke. This type of construction
(termed as core type) is more common and has the following distinct advantages:
viz. construction is simpler, cooling is better and repair is easy. Shell-type
construction, in which a cross section of windings in the plane of core is
surrounded by limbs and yokes, is also used. It has the advantage that one can use
sandwich construction of LV and HV windings to get very low impedance, if
desired, which is not easily possible in the core-type construction. In this book,
most of the discussion is related to the core-type construction, and where required
reference to shell-type construction has been made.
The core construction mainly depends on technical specifications,
manufacturing limitations, and transport considerations. It is economical to have
all the windings of three phases in one core frame. A three-phase transformer is
cheaper (by about 20 to 25%) than three single-phase transformers connected in a
bank. But from the spare unit consideration, users find it more economical to buy
four single-phase transformers as compared to two three-phase transformers.
Also, if the three-phase rating is too large to be manufactured in transformer
works (weights and dimensions exceeding the manufacturing capability) and
Copyright © 2004 by Marcel Dekker, Inc.
Magnetic Characteristics 37
transported, there is no option but to manufacture and supply single-phase units.
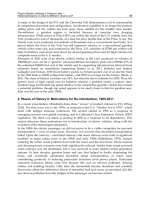
In figure 2.1, various types of core construction are shown.
In a single-phase three-limb core (figure 2.1 (a)), windings are placed around
the central limb, called as main limb. Flux in the main limb gets equally divided
between two yokes and it returns via end limbs. The yoke and end limb area
should be only 50% of the main limb area for the same operating flux density. This
type of construction can be alternately called as single-phase shell-type
transformer. Zero-sequence impedance is equal to positive-sequence impedance
for this construction (in a bank of single-phase transformers).
Sometimes in a single-phase transformer windings are split into two parts and
placed around two limbs as shown in figure 2.1 (b). This construction is
sometimes adopted for very large ratings. Magnitude of short-circuit forces are
lower because of the fact that ampere-turns/height are reduced. The area of limbs
and yokes is the same. Similar to the single-phase three-limb transformer, one can
have additional two end limbs and two end yokes as shown in figure 2.1 (c) to get
a single-phase four-limb transformer to reduce the height for the transport
purpose.
Figure 2.1 Various types of cores
Copyright © 2004 by Marcel Dekker, Inc.
Chapter 238
The most commonly used construction, for small and medium rating
transformers, is three-phase three-limb construction as shown in figure 2.1 (d).
For each phase, the limb flux returns through yokes and other two limbs (the same
amount of peak flux flows in limbs and yokes). In this construction, limbs and
yokes usually have the same area. Sometimes the yokes are provided with a 5%
additional area as compared to the limbs for reducing no-load losses. It is to be
noted that the increase in yoke area of 5% reduces flux density in the yoke by
5%, reduces watts/kg by more than 5% (due to non-linear characteristics) but
the yoke weight increases by 5%. Also, there may be additional loss due to
cross-fluxing since there may not be perfect matching between lamination steps
of limb and yoke at the joint. Hence, the reduction in losses may not be very
significant. The provision of extra yoke area may improve the performance
under over-excitation conditions. Eddy losses in structural parts, due to flux
leaking out of core due to its saturation under over-excitation condition, are
reduced to some extent [2,3]. The three-phase three-limb construction has
inherent three-phase asymmetry resulting in unequal no-load currents and
losses in three phases; the phenomenon is discussed in section 2.5.1. One can
get symmetrical core by connecting it in star or delta so that the windings of three
phases are electrically as well as physically displaced by 120 degrees. This
construction results into minimum core weight and tank size, but it is seldom used
because of complexities in manufacturing.
In large power transformers, in order to reduce the height for transportability,
three-phase five-limb construction depicted in figure 2.1 (e) is used. The magnetic
length represented by the end yoke and end limb has a higher reluctance as
compared to that represented by the main yoke. Hence, as the flux starts rising, it
first takes the path of low reluctance of the main yoke. Since the main yoke is not
large enough to carry all the flux from the limb, it saturates and forces the
remaining flux into the end limb. Since the spilling over of flux to the end limb
occurs near the flux peak and also due to the fact that the ratio of reluctances of
these two paths varies due to non-linear properties of the core, fluxes in both main
yoke and end yoke/end limb paths are non-sinusoidal even though the main limb
flux is varying sinusoidally [2,4]. Extra losses occur in the yokes and end limbs
due to the flux harmonics. In order to compensate these extra losses, it is a normal
practice to keep the main yoke area 60% and end yoke/end limb area 50% of the
main limb area. The zero-sequence impedance is much higher for the three-phase
five-limb core than the three-limb core due to low reluctance path (of yokes and
end limbs) available to the in-phase zero-sequence fluxes, and its value is close to
but less than the positive-sequence impedance value. This is true if the applied
voltage during the zero-sequence test is small enough so that the yokes and end
limbs are not saturated. The aspects related to zero-sequence impedances for
various types of core construction are elaborated in Chapter 3. Figure 2.1 (f)
shows a typical 3-phase shell-type construction.
Copyright © 2004 by Marcel Dekker, Inc.
Magnetic Characteristics 39
2.1.2 Analysis of overlapping joints and building factor
While building a core, the laminations are placed in such a way that the gaps
between the laminations at the joint of limb and yoke are overlapped by the
laminations in the next layer. This is done so that there is no continuous gap at the
joint when the laminations are stacked one above the other (figure 2.2). The
overlap distance is kept around 15 to 20 mm. There are two types of joints most
widely used in transformers: non-mitred and mitred joints (figure 2.3). Non-
mitred joints, in which the overlap angle is 90°, are quite simple from the
manufacturing point of view, but the loss in the corner joints is more since the flux
in the joint region is not along the direction of grain orientation. Hence, the non-
mitred joints are used for smaller rating transformers. These joints were
commonly adopted in earlier days when non-oriented material was used.
In case of mitred joints the angle of overlap (
α
) is of the order of 30° to 60°, the
most commonly used angle is 45°. The flux crosses from limb to yoke along the
grain orientation in mitred joints minimizing losses in them. For airgaps of equal
length, the excitation requirement of cores with mitred joints is sin
α
times that
with non-mitred joints [5].
Figure 2.2 Overlapping at joints
Figure 2.3 Commonly used joints
Copyright © 2004 by Marcel Dekker, Inc.
Chapter 240
Better grades of core material (Hi-B, scribed, etc.) having specific loss (watts/
kg) 15 to 20% lower than conventional CRGO material (termed hereafter as CGO
grade, e.g., M4) are regularly used. However, it has been observed that the use of
these better materials may not give the expected loss reduction if a proper value of
building factor is not used in loss calculations. It is defined as
(2.1)
The building factor generally increases as grade of the material improves from
CGO to Hi-B to scribed (domain refined). This is a logical fact because at the
corner joints the flux is not along the grain orientation, and the increase in watts/
kg due to deviation from direction of grain orientation is higher for a better grade
material. The factor is also a function of operating flux density; it deteriorates
more for better grade materials with the increase in operating flux density. Hence,
cores built with better grade material may not give the expected benefit in line
with Epstein measurements done on individual lamination. Therefore, appropriate
building factors should be taken for better grade materials using experimental/test
data.
Single-phase two-limb transformers give significantly better performances
than three-phase cores. For a single-phase two-limb core, building factor is as low
as 1.0 for the domain refined grade (laser or mechanically scribed material) and
slightly lower than 1.0 for CGO grade [6]. The reason for such a lower value of
losses is attributed to lightly loaded corners and spatial redistribution of flux in
limbs and yokes across the width of laminations. Needless to say, the higher the
proportion of corner weight in the total core weight, the higher are the losses. Also
the loss contribution due to the corner weight is higher in case of 90° joints as
compared to 45° joints since there is over-crowding of flux at the inner edge and
flux is not along the grain orientation while passing from limb to yoke in the
former case. Smaller the overlapping length better is the core performance; but the
improvement may not be noticeable. It is also reported in [6,7] that the gap at the
core joint has significant impact on the no-load loss and current. As compared to 0
mm gap, the increase in loss is 1 to 2% for 1.5 mm gap, 3 to 4% for 2.0 mm gap
and 8 to 12% for 3 mm gap. These figures highlight the need for maintaining
minimum gap at the core joints.
Lesser the laminations per lay, lower is the core loss. The experience shows that
from 4 laminations per lay to 2 laminations per lay, there is an advantage in loss of
about 3 to 4%. There is further advantage of 2 to 3% in 1 lamination per lay. As the
number of laminations per lay reduces, the manufacturing time for core building
increases and hence most of the manufacturers have standardized the core
building with 2 laminations per lay.
A number of works have been reported in the literature, which have analyzed
various factors affecting core losses. A core model for three-phase three-limb
transformer using a lumped circuit model is reported in [8]. The length of
Copyright © 2004 by Marcel Dekker, Inc.
Magnetic Characteristics 41
equivalent air gap is varied as a function of the instantaneous value of the flux in
the laminations. The anisotropy is also taken into account in the model. An
analytical solution using 2-D finite difference method is described in [9] to
calculate spatial flux distribution and core losses. The method takes into account
magnetic anisotropy and non-linearity. The effect of overlap length and number of
laminations per lay on core losses has been analyzed in [10] for wound core
distribution transformers.
Joints of limbs and yokes contribute significantly to the core loss due to cross-
fluxing and crowding of flux lines in them. Hence, the higher the corner area and
weight, the higher is the core loss. The corner area in single-phase three-limb
cores, single-phase four-limb cores and three-phase five-limb cores is less due to
smaller core diameter at the corners, reducing the loss contribution due to the
corners. However, this reduction is more than compensated by increase in loss
because of higher overall weight (due to additional end limbs and yokes).
Building factor is usually in the range of 1.1 to 1.25 for three-phase three-limb
cores with mitred joints. Higher the ratio of window height to window width,
lower is the contribution of corners to the loss and hence the building factor is
lower.
Single-phase two-limb and single-phase three-limb cores have been shown
[11] to have fairly uniform flux distribution and low level of total harmonic
distortion as compared to single-phase four-limb and three-phase five-limb
cores.
Step-lap joint is used by many manufacturers due to its excellent performance
figures. It consists of a group of laminations (commonly 5 to 7) stacked with a
staggered joint as shown in figure 2.4. Its superior performance as compared to the
conventional mitred construction has been analyzed in [12,13]. It is shown [13]
that, for a operating flux density of 1.7 T, the flux density in the mitred joint in the
core sheet area shunting the air gap rises to 2.7 T (heavy saturation), while in the
gap the flux density is about 0.7 T. Contrary to this, in the step-lap joint of 6 steps,
the flux totally avoids the gap with flux density of just 0.04 T, and gets
redistributed almost equally in laminations of other five steps with a flux density
close to 2.0 T. This explains why the no-load performance figures (current, loss
and noise) show a marked improvement for the step-lap joints.
Figure 2.4 Step-lap and conventional joint
Copyright © 2004 by Marcel Dekker, Inc.
Chapter 242
2.2 Hysteresis and Eddy Losses
Hysteresis and eddy current losses together constitute the no-load loss. As
discussed in Chapter 1, the loss due to no-load current flowing in the primary
winding is negligible. Also, at the rated flux density condition on no-load, since
most of the flux is confined to the core, negligible losses are produced in the
structural parts due to near absence of the stray flux. The hysteresis and eddy
losses arise due to successive reversal of magnetization in the iron core with
sinusoidal application of voltage at a particular frequency f (cycles/second).
Eddy current loss, occurring on account of eddy currents produced due to
induced voltages in laminations in response to an alternating flux, is proportional
to the square of thickness of laminations, square of frequency and square of
effective (r.m.s.) value of flux density.
Hysteresis loss is proportional to the area of hysteresis loop (figure 2.5(a)). Let
e, i
0
and
φ
m
denote the induced voltage, no-load current and core flux respectively.
As per equation 1.1, voltage e leads the flux
φ
m
by 90°. Due to hysteresis
phenomenon, current i
0
leads
φ
m
by a hysteresis angle (ß) as shown in figure 2.5
(b). Energy, either supplied to the magnetic circuit or returned back by the
magnetic circuit is given by
(2.2)
If we consider quadrant I of the hysteresis loop, the area OABCDO represents
the energy supplied. Both induced voltage and current are positive for path AB.
For path BD, the energy represented by the area BCD is returned back to the
source since the voltage and current are having opposite signs giving a negative
Figure 2.5 Hysteresis loss
Copyright © 2004 by Marcel Dekker, Inc.
Magnetic Characteristics 43
value of energy. Thus, for the quadrant I the area OABDO represents the energy
loss; the area under hysteresis loop ABDEFIA represents the total energy loss
termed as the hysteresis loss. This loss has a constant value per cycle meaning
thereby that it is directly proportional to frequency (the higher the frequency
(cycles/second), the higher is the loss). The non-sinusoidal current i
0
can be
resolved into two sinusoidal components: i
m
in-phase with
φ
m
and i
h
in phase with
e. The component i
h
represents the hysteresis loss.
The eddy loss (P
e
) and hysteresis loss (P
h
) are thus given by
(2.3)
(2.4)
where
t is thickness of individual lamination
k
1
and k
2
are constants which depend on material
B
rms
is the rated effective flux density corresponding to the actual r.m.s.
voltage on the sine wave basis
B
mp
is the actual peak value of the flux density
n is the Steinmetz constant having a value of 1.6 to 2.0 for hot rolled
laminations and a value of more than 2.0 for cold rolled laminations due to use
of higher operating flux density in them.
In r.m.s. notations, when the hysteresis component (I
h
) shown in figure 2.5 (b) is
added to the eddy current loss component, we get the total core loss current (I
c
). In
practice, the equations 2.3 and 2.4 are not used by designers for calculation of no-
load loss. There are at least two approaches generally used; in one approach the
building factor for the entire core is derived based on the experimental/test data,
whereas in the second approach the effect of corner weight is separately
accounted by a factor based on the experimental/test data.
No load loss=W
t
×K
b
×w (2.5)
or No load loss=(W
t
-W
c
)×w+W
c
×w×K
c
(2.6)
where,
w is watts/kg for a particular operating peak flux density as given by lamination
supplier (Epstein core loss),
K
b
is the building factor,
W
c
denotes corner weight out of total weight of W
t
, and
K
c
is factor representing extra loss occurring at the corner joints (whose value is
higher for smaller core diameters).
Copyright © 2004 by Marcel Dekker, Inc.
Chapter 244
2.3 Excitation Characteristics
Excitation current can be calculated by one of the following two methods. In the
first method, magnetic circuit is divided into many sections, within each of which
the flux density can be assumed to be of constant value. The corresponding value
of magnetic field intensity (H) is obtained for the lamination material (from its
magnetization curve) and for the air gap at joints. The excitation current can then
be calculated as the total magnetomotive force required for all magnetic sections
(n) divided by number of turns (N) of the excited winding,
(2.7)
where l is length of each magnetic section.
It is not practically possible to calculate the no-load current by estimating
ampere-turns required in different parts of the core to establish a given flux
density. The calculation is mainly complicated by the corner joints. Hence,
designers prefer the second method, which uses empirical factors derived from
test results. Designers generally refer the VA/kg (volt-amperes required per kg of
material) versus induction (flux density) curve of the lamination material. This
VA/kg is multiplied by a factor (which is based on test results) representing
additional excitation required at the joints to get VA/kg of the built core. In that
case, the no-load line current for a three-phase transformer can be calculated as
(2.8)
Generally, manufacturers test transformers of various ratings with different
core materials at voltage levels below and above the rated voltage and derive their
own VA/kg versus induction curves.
As seen from figure 2.5 (b), excitation current of a transformer is rich in
harmonics due to non-linear magnetic characteristics. For CRGO material, the
usually observed range of various harmonics is as follows. For the fundamental
component of 1 per-unit, 3
rd
harmonic is 0.3 to 0.5 per-unit, 5
th
harmonic is 0.1 to
0.3 per-unit and 7
th
harmonic is about 0.04 to 0.1 per-unit. The harmonics higher
than the 7
th
harmonic are of insignificant magnitude. The effective value of total
no-load current is given as
(2.9)
In above equation, I
1
is the effective (r.m.s.) value of the fundamental
component (50 or 60 Hz) whereas I
3
, I
5
and I
7
are the effective values of 3
rd
, 5
th
and
7
th
harmonics respectively. The effect of higher harmonics of diminishing
Copyright © 2004 by Marcel Dekker, Inc.
Magnetic Characteristics 45
magnitude have a small influence on the effective value of resultant no-load
current (40% value of 3
rd
harmonic increases the resultant by only about 8%).
Since the no-load current itself is in the range of 0.2 to 2% of the full load current,
harmonics in no-load current do not appreciably increase the copper loss in
windings except during extreme levels of core saturation. The harmonic
components of current do not contribute to the core loss if the applied voltage is
sinusoidal.
If the current harmonic components are modified or constrained, flux density
in the core gets modified. For example, if the third harmonic current is suppressed
by isolating the neutral, the flux density will be flat-topped for a sinusoidal current
as shown in figure 2.6 (hysteresis is neglected for simplicity). For this case, the
flux can be expressed as
(2.10)
where etc. represent the peak values of fundamental and harmonic
components. The induced voltage per turn is
(2.11)
The induced voltage as seen in figure 2.6 is peaky in nature with pronounced third
harmonic component (only the third harmonic component is shown for clarity).
Thus, even a small deviation of flux from the sinusoidal nature introduces
appreciable harmonic components in voltages (15% third harmonic component in
flux results into 45% of third harmonic component in the voltage). This results in
increase of eddy losses but hysteresis loss reduces as the maximum value of flux
density is reduced. The net effect on the total core loss will depend on the relative
changes in eddy and hysteresis losses.
Figure 2.6 Waveforms of flux and voltage for sinusoidal magnetizing current
Copyright © 2004 by Marcel Dekker, Inc.
Chapter 246
2.4 Over-Excitation Performance
The choice of operating flux density of a core has a very significant impact on the
overall size, material cost and performance of a transformer. For the currently
available various grades of CRGO material, although losses and magnetizing volt-
amperes are lower for better grades, viz. Hi-B material (M0H, M1H, M2H), laser
scribed, mechanical scribed, etc., as compared to CGO material (M2, M3, M4,
M5, M6, etc.), the saturation flux density has remained same (about 2.0 T). The
peak operating flux density (B
mp
) gets limited by the over-excitation conditions
specified by users. The slope of B-H curve of CRGO material significantly
worsens after about 1.9 T (for a small increase in flux density, relatively much
higher magnetizing current is drawn). Hence, the point corresponding to 1.9 T can
be termed as knee-point of the B-H curve. It has been seen in example 1.1 that the
simultaneous over-voltage and under-frequency conditions increase the flux
density in the core. Hence, for an over-excitation condition (over-voltage and
under-frequency) of a%, general guideline can be to use operating peak flux
density of [1.9/(1+
α
/100)]. For the 10% continuous over-excitation specification,
B
mp
of 1.73 T [=1.9/(1+0.1)] can be the upper limit. For a power system, in which
a voltage profile is well maintained, a continuous over-excitation condition of 5%
is specified. In this case, B
mp
of 1.8 T may be used as long as the core temperature
and noise levels are within permissible limits; these limits are generally achievable
with the step-lap core construction.
When a transformer is subjected to an over-excitation, core contains an amount
of flux sufficient to saturate it. The remaining flux spills out of the core. The over-
excitation must be extreme and of a long duration to produce damaging effect in
the core laminations. The laminations can easily withstand temperatures in the
region of 800°C (they are annealed at this temperature during their manufacture),
but insulation in the vicinity of core laminations, viz. press-board insulation (class
A: 105°C) and core bolt insulation (class B: 130°C) may get damaged. Since the
flux flows in air (outside core) only during the part of a cycle when core gets
saturated, the air flux and exciting current are in the form of pulses having high
harmonic content which increases the eddy losses and temperature rise in
windings and structural parts. Guidelines for permissible short-time over-
excitation of transformers are given in [14,15]. Generator transformers are more
susceptible for overvoltages due load rejection conditions and therefore need
special design considerations.
2.5 No-Load Loss Test
Hysteresis loss is a function of average voltage or maximum flux density, whereas
eddy loss is a function of r.m.s. voltage or r.m.s. flux density. Hence, the total core
Copyright © 2004 by Marcel Dekker, Inc.
Magnetic Characteristics 47
loss is a function of voltage wave-shape. If the sine-wave excitation cannot be
ensured during the test, the following correction procedure can be applied to
derive the value of no-load loss on the sine wave basis [16, 17]. When a voltmeter
corresponding to the mean value is used, reading is proportional to the maximum
value of flux density in the core. Hence, if the applied non-sinusoidal voltage has
the same maximum flux density as that of the desired sine-wave voltage,
hysteresis loss will be measured corresponding to the sine wave. The r.m.s. value
may not be equal to r.m.s. value of desired sine wave; hence eddy loss has to be
corrected by using a factor K
e
,
True core loss of transformer (P
c
) on the sine wave basis is then calculated from the
measured loss (P
m
) as
(2.12)
where and are hysteresis and eddy loss fractions of the total core loss
respectively. The following values are usually taken for these two fractions,
and for cold rolled steel
and for hot rolled steel
The calculation as per equation 2.12 is recommended in ANSI Standard
C57.12.90–1999. For highly distorted waveforms (with multiple zero crossings
per period), a correction which can be applied to this equation is given in [18].
As per IEC 60076–1 (Edition 2.1, 2000), the test voltage has to be adjusted
according to a voltmeter responsive to the mean value of voltage but scaled to read
the r.m.s. voltage of a sinusoidal wave having the same mean value (let the reading
of this voltmeter be V
1
). At the same time, a voltmeter responsive to the r.m.s.
value of voltage is connected in parallel with the mean value voltmeter and let its
reading be V. The test voltage wave shape is satisfactory if the readings V
1
and V
are within 3% of each other. If the measured no-load loss is
P
m
then the corrected no-load loss (P
c
) is given as
(2.13)
where (usually negative)
Copyright © 2004 by Marcel Dekker, Inc.
Chapter 248
The method given in [19] allows the determination of the core loss from the
measured data under non-sinusoidal excitation without artificial separation of the
hysteresis and eddy current losses. Harmonic components are taken into account.
The computed results are compared with the IEC method.
A voltage regulator with a large capacitor bank is better than a conventional
rotating machine source from the point of view of getting as sinusoidal voltage as
possible for core loss measurements.
The no-load loss test and the calculation of parameters of shunt branch of the
equivalent circuit of a transformer have been elaborated in Chapter 1. Now,
special topics/case studies related to the no-load test are discussed.
2.5.1 Asymmetrical magnetizing phenomenon
Unlike in a bank of three single-phase transformers having independent magnetic
circuits, a three-phase three-limb transformer has interlinked magnetic circuit.
The excitation current and power drawn by each phase winding are not the actual
current and power required by the corresponding magnetic sections of the core.
The current drawn by each phase winding is determined by the combination of
requirements of all the three core branches. Consider a three-phase three-limb
core shown in figure 2.7. Let the magnetomotive force required to produce
instantaneous values of fluxes ( and ) in the path between points P
1
to P
2
for the phase windings (r, y and b) be and respectively. There is an
inherent asymmetry in the core as the length of magnetic path of winding y
between the points P
1
and P
2
is less than that of windings r and b. Let the actual
currents drawn be I
r
, I
y
and I
b
.
Figure 2.7 Three-phase three-limb core with Y connected primary
Copyright © 2004 by Marcel Dekker, Inc.
Magnetic Characteristics 49
The following equations can be written:
(2.14)
(2.15)
(2.16)
For a Y-connected winding (star connected without grounded neutral),
I
r
+I
y
+I
b
=0 (2.17)
It follows from equations 2.14 to 2.17 that
(2.18)
(2.19)
(2.20)
where I
z
is the zero-sequence component of the currents required to establish the
required magnetomotive forces,
(2.21)
Higher the magnetizing asymmetry, higher is the magnitude of I
z
. The
magnetomotive force, NI
z
, is responsible for producing a zero-sequence leakage
flux in the space outside core between points P
1
and P
2
[20]. The magnitude of this
zero-sequence leakage flux is quite small as compared to the mutual flux in the
core. For convenience, the reluctance of the magnetic path of winding y between
points P
1
and P
2
is taken as half that of windings r and b. For sinusoidal applied
voltages, fluxes are also sinusoidal, and the excitation current required then
contains harmonics due to non-linear magnetic characteristics. Thus, the required
excitation currents in three-phases can be expressed as (harmonics of order more
than 3 are neglected)
(2.22)
(2.23)
(2.24)
where I
c
is the core loss component, and a negative sign is taken for third harmonic
components [21] to get a peaky nature of the excitation current (for a sinusoidal
Copyright © 2004 by Marcel Dekker, Inc.
Chapter 250
flux, excitation current is peaky in nature due to non-linear magnetic
characteristics). Substituting these expressions in equation 2.21,
(2.25)
After substituting this expression for I
z
and expressions for and from
equations 2.22 to 2.24 in equations 2.18 to 2.20, the actual excitation currents
drawn are
(2.26)
(2.27)
(2.28)
The condition that the sum of 3
rd
harmonic currents in three phases has to be zero
(since the neutral is isolated) is satisfied by above three equations. The essence of
the mathematical treatment can be understood by the vector diagrams of
fundamental and third harmonic components shown in figure 2.8. The magnitudes
of I
r
and I
b
are almost equal and these are greater than the magnitude of I
y
. The
current I
y
, though smallest of all the three currents, is higher than the current
required to excite middle phase alone The currents in the outer limbs
are slightly less than that needed to excite outer limbs alone ( and ).In
actual practice, the currents I
r
and I
b
may differ slightly due to minor differences in
the characteristics of their magnetic paths (e.g., unequal air gap lengths at corner
joints). The third harmonic component drawn by phase y is greater than that of
phases r and b.
Since the applied voltage is assumed to be sinusoidal, only the fundamental
component contributes to the power. The power corresponding to phase r will be
negative if I
z
is large enough to cause the angle between V
r
and I
r
to exceed 90°.
Negative power is read in one of the phases during the no-load loss test for
transformers whose yoke lengths are quite appreciable as compared to limb
heights increasing the asymmetry between the middle and outer phases.
It has been proved in [22] that for a length of central limb between points P
1
and
P
2
equal to half that of outer limbs (reluctance of central limb is half that of outer
limbs) in figure 2.7,
Copyright © 2004 by Marcel Dekker, Inc.
Magnetic Characteristics 51
I
r
:I
y
:I
b
=1:0.718:1 (2.29)
The effect of change in excitation is illustrated for r phase in figure 2.9. During
no-load loss test, losses are generally measured at 90%, 100% and 110% of the
rated voltage. The magnetizing component of excitation current is more sensitive
to the increase in flux density as compared to the core loss component.
Consequently as the voltage is increased, the no-load power factor decreases. The
value of I
z
also increases and hence the possibility of reading negative power
increases with the increase in applied voltage. When the angle between V
r
and I
r
is
90°, the r phase wattmeter reads zero, and if it exceeds 90° the wattmeter reads
negative.
Figure 2.8 Magnetizing asymmetry
Figure 2.9 Effect of excitation level
Copyright © 2004 by Marcel Dekker, Inc.
Chapter 252
The magnetizing asymmetry phenomenon described above has been analyzed
by using mutual impedances between 3 windings in [23]. It is shown that phase
currents and powers are balanced if mutual impedances Z
ry
, Z
yb
and Z
br
are equal.
These impedances are function of number of turns and disposition of windings,
winding connections within a phase and more importantly on dimensions and
layout of the core. These mutual impedances, which are unbalanced in three-
phase three-limb core (Z
ry
=Z
yb
Z
br
), redistribute the power shared between the
three phases. The form of asymmetry occurring in the phase currents and powers
is different for three-limb and five-limb cores. It is reported that there is star point
displacement in a five-limb transformer, which tends to reduce the unbalance
caused by the inequality of mutual impedances.
Similar analysis can be done for a delta connected primary winding, for which
the measured line current is the difference between currents of the corresponding
two phases. It can be proved that [24] when the delta connected winding is
energized, for Yd1 or Dy11 connection, line current drawn by r phase is higher
than that drawn by y and b phases, which are equal (I
r-L
>I
y-L
=I
b-L
). For Yd11 or Dy1
connection, the line current drawn by b phase is higher than that drawn by r and y
phases, which are equal (I
b-L
>I
y-L
=I
r-L
). It should be noted that, for the delta
connected primary winding also, the magnetic section corresponding to y phase
requires least magnetizing current, i.e., but the phasor addition of
two phase currents results into a condition that line current I
y-L
equals the current
of one of the outer phases.
2.5.2 Magnetic balance test
This test is performed at works or site as an investigative test to check the
healthiness of windings and core. In this test, a low voltage (say, 230 V) is
applied to a winding of one phase with all other windings kept open circuited.
Voltages induced in the corresponding windings of other two phases are
measured. When a middle phase (y) is excited, voltage induced in r and b phases
should be in the range of 40 to 60% of the applied voltage. Ideally it should be
50% but due to difference in reluctance of the magnetic paths corresponding to
r and b phases (on account of minor differences in air gaps at joints, etc.), some
deviation from the expected values need not be considered as abnormal. When r
(or b) phase is excited, one may get y-phase induced voltage as high as 90% and
the voltage induced in b (or r) phase as low as 10% for a healthy core. The
addition of r.m.s. voltages induced in unexcited phases need not necessarily be
equal to the voltage applied to the excited phase due to non-linear characteristics
of the magnetic circuit and the harmonics present in the fluxes of the unexcited
limbs.
The results of the magnetic balance test should be taken as indicative ones and
some other test (e.g., no-load loss test at rated voltage in manufacturer’s works)
should be performed to confirm the conclusions. The magnetic balance test can be
Copyright © 2004 by Marcel Dekker, Inc.
Magnetic Characteristics 53
done at various stages of manufacturing, viz. before and after connections, before
final tests, before dispatch; these test results can be used for comparison with those
done at any subsequent time to check whether any problem is developed in the
core and windings. If the voltages measured do not fall in the expected range, a
problem in core or windings can be suspected. Suppose there is a turn-to-turn fault
in r phase. When a low voltage is applied to y phase winding, instead of getting
almost equal induced voltages in r and b phase windings, a much higher voltage
is obtained in b phase winding as fault current circulating in the faulty section,
opposes the magnetizing flux compared to that of r phase, indicating a fault in
winding of phase r. A high thereby reducing the induced voltage in the faulty
phase. For the test, the core should be demagnetized because a slight
magnetization (e.g., after resistance measurement) can give erratic results. The
demagnetization can be achieved by a repeated application of variable AC voltage
which is slowly reduced to zero.
2.5.3 Trouble-shooting by no-load loss test
Detection and location of turn-to-turn fault can be done by the results of no-load
loss test. Suppose, it is suspected that during impulse testing a particular winding
has failed. The turn-to-turn fault may not result in appreciable change in the
transfer function (impedance) of the winding and hence there is no appreciable
disturbance noticed in the recorded impulse waveforms. The fault in the suspected
winding can be confirmed by doing a no-load loss test. Therefore, it is usually
recommended to do the no-load loss test after all high voltage dielectric tests for
detecting any developed fault in the windings. No-load loss value shoots up for a
fault between turns. In order to locate the exact position of a fault, the parallel
conductors are electrically separated at both ends, and then resistance is measured
between all the points available (1, 1', 2, 2', 3, 3') as shown in figure 2.10 for a
winding with 3 parallel conductors.
Let us assume that each of the parallel conductors is having a resistance of 0.6
ohms. If the fault is at a location 70% from the winding bottom between conductor
1 of one turn and conductor 3 of next turn, then the measured values of resistances
Figure 2.10 Trouble-shooting during no-load loss test
Copyright © 2004 by Marcel Dekker, Inc.
Chapter 254
between 1-3 and 1'-3' will be 0.36 ohms (2×0.3×0.6) and 0.84 ohms (2×0.7×0.6)
respectively. A voltage corresponding to one turn circulates very high currents
since these are limited only by above resistances (reactance in path is negligible).
The increase in no-load loss corresponds approximately to the loss in these two
resistance paths due to circulating currents.
2.5.4 Effect of impulse test on no-load loss
A slight increase of about few % in the no-load loss is sometimes observed after
impulse tests due to partial breakdown of interlaminar insulation (particularly at
the edges) resulting into higher eddy loss. The phenomenon has been analyzed in
[25], wherein it is reported that voltages are induced in core by electrostatic as
well as electromagnetic inductions. The core loss increase of an average value of
less than 2% has been reported. It is further commented that the phenomenon is
harmful to the extent that it increases the loss and that the loss will not increase at
site. Application of an adhesive at the edges can prevent this partial and localized
damage to the core during the high voltage tests.
2.6 Impact of Manufacturing Processes on Core
Performance
For building cores of various ratings of transformers, different lamination widths
are required. Since the lamination rolls are available in some standard widths from
material suppliers, slitting operation is required to get the required widths. It is
obvious that most of the times a full width cannot be utilized and the scrap of
leftover material has to be minimized by a meticulous planning exercise. A
manufacturer having a wide product range, generally uses the leftover of large
transformer cores for the cores of small distribution transformers.
The next operation is that of cutting the laminations in different shapes (e.g.,
mitred joint in figure 2.3). Finally, the corner protrusions of the built core are cut
because they are not useful (do not carry the flux), and they may contribute to the
noise level of the transformer due to their vibrations.
In a bolted yoke construction, which ensures rigidity of the core, holes are
punched in the yoke laminations. There is distortion of flux at the position of holes
as shown in figure 2.11.
Figure 2.11 Effect of yoke bolts
Copyright © 2004 by Marcel Dekker, Inc.
Magnetic Characteristics 55
This leads to an increase in core loss. Hence, many manufactures use boltless
yoke construction, in which special clamping arrangement consisting of fiber-
glass/stainless steel bands is adopted. The boltless yoke construction results in
better utilization of core material and reduction in core loss. Small guiding holes
are needed to facilitate the placement of laminations and core-building. In order to
strengthen the bonding of laminations, suitable epoxy resin is applied at the edges
of yoke laminations, which also results in reduction of noise level.
The processes of slitting, cutting and punching result in edges having burrs,
which not only worsen the stacking factor but also result into shorting of adjacent
laminations (due to damage of insulation coating) increasing eddy losses. The
upper limit of acceptable burr level is about 20 microns. A lower burr level
improves the stacking factor of the core and reduces loss. Higher the stacking
factor of laminations (which may be about 0.97 to 0.98), higher is the core area
obtained leading to a more cost effective design. This staking factor, which is
decided by lamination coating and burr, is different than the core space factor
(which of the order of 0.88 to 0.90). The core space factor is defined as the actual
core area obtained divided by the core circle area. The burrs can be removed by
passing the laminations through a de-burring process. A thin coating of varnish
may be applied at the edges to cover up the scratches formed during the de-burring
process.
All the above processes and multiple handling of laminations result into
development of mechanical strains inside the laminations, disturbing the original
grain orientation and thereby causing increase in core loss. This effect can be
mitigated by annealing the laminations at a temperature of about 800°C under
inert gas atmosphere. If state-of-the-art lamination slitting and cutting machines
having high degree of automation are used, handling of laminations is reduced
substantially and hence annealing is not considered necessary.
Core limbs are generally made of a large number of steps in order to get a
maximum core area for a given core diameter leading to an optimum design.
Yokes on the other hand may have lesser number of steps to provide better axial
support to the windings. The mismatch in number of limb and yoke steps may
result into some extra loss at the corner joints.
One question which is many times asked by production and planning
departments is: Can materials of different grades be mixed to overcome the
problem of non-availability of a particular grade in sufficient quantity? Needless
to say, one can mix only a better grade material, which can give marginal
reduction in the no-load loss. Actually, the grade mixing should not be
encouraged. In exceptional cases, however, mixing of a better grade may be
allowed to minimize shop inventory problems.
Copyright © 2004 by Marcel Dekker, Inc.
Chapter 256
2.7 Inrush Current
2.7.1 Theory
If it were possible to switch on a transformer exactly at an instant of a voltage wave
which corresponds to the actual flux density in the core at that instant, it would
not have resulted in any transient. In actual practice, a transient phenomenon in
the form of inrush current is unavoidable since the instant of switching cannot be
easily controlled and the instant of switching favourable to one phase is not
favourable to other two phases.
When a transformer is switched off, the excitation current follows the
hysteresis curve to zero, whereas the flux density value changes to a non-zero
value B
r
as evident from the hysteresis loop in figure 2.5 (point D). For a residual
flux density of +B
r
, a maximum inrush current is drawn when a transformer is
switched on at the instant when the applied voltage is zero as shown in figure 2.12.
If transformer was not switched off, excitation current (i) and flux density would
have followed the dotted curves. As per the constant flux linkage theorem,
magnetic flux in an inductive circuit cannot change suddenly; the flux just after
closing the switch (at t=0
+
) must remain equal to the flux just before closing the
switch (at t=0
-
). Hence, the flux density, instead of starting from the negative
maximum value (-B
mp
), starts from +B
r
and reaches the peak positive value of
(B
r
+2B
mp
) driving the core into saturation.
Figure 2.12 Case of maximum inrush current
Copyright © 2004 by Marcel Dekker, Inc.
Magnetic Characteristics 57
For an applied sinusoidal voltage, the flux density is sinusoidal and magnetizing
current is peaky in nature. The same result can be obtained by solving the
following governing equation:
(2.30)
where
V
p
=peak value of the applied voltage
θ
=angle at which voltage is switched on
i
0
=instantaneous value of magnetizing current
φ
m
=instantaneous value of flux at any time t
R
1
=primary winding resistance
N
1
=primary winding turns
The solution of the equation is quite straightforward when linear magnetic
characteristics are assumed. The solution is obtained by using the initial
conditions that at
(2.31)
For
θ
=0 and residual flux of the waveform of flux (flux density) is shown in
figure 2.13. It can be observed from equation 2.31 and the flux waveform that the
flux wave has a transient DC component, which decays at a rate determined by the
ratio of resistance to inductance of primary winding (R
1
/L
1
), and a steady-state AC
component A typical waveform of an inrush current is shown
in figure 2.14 for a phase switched on at the most unfavourable instant (i.e., at zero
crossing of the applied voltage wave).
Figure 2.13 Flux wave
Figure 2.14 Typical inrush current waveform
Copyright © 2004 by Marcel Dekker, Inc.
Chapter 258
It can be observed that the current waveform is completely offset in first few
cycles with wiping out of alternate half cycles because the flux density is below
saturation value for these half cycles (resulting in very small current value).
Hence, the inrush current is highly asymmetrical and has a predominant second
harmonic component which is used by differential protection schemes to restrain
relays from operating.
Time constant (L/R) of the circuit is not constant; the value of L changes
depending on the extent of core saturation. During the first few cycles,
saturation is high and L is low. Hence, initial rate of decay of inrush current is
quite high. As the losses damp the circuit and saturation drops, L increases
slowing down the decay. Hence, the decay of inrush current starts with a high
initial rate and progressively reduces; the total phenomenon lasts for few
seconds. Smaller transformers have higher rates of decay. In general,
transformers having higher losses (lower efficiency) have higher decay rates of
inrush current [26].
While arriving at equation 2.31, linear magnetic characteristics are assumed,
which is a major approximation. Accurate procedures for calculation of inrush
currents for single-phase transformers is given in a number of references [27,28]
in which non-linear magnetic characteristics are elaborately represented. For
estimation of inrush current in three-phase transformers, the analysis is more
involved [29,30,31]. A method of calculation of inrush currents in harmonic
domain for single-phase and three-phase transformers using operational matrices
is given in [32]. Inrush currents of transformers and associated overvoltages in
HVDC systems are dealt in [33], wherein AC system impedance, which is
generally inductive (that of generators, transformers and transmission lines), is
shown to resonate with filters on AC bus-bars (which act as lumped capacitance
below fifth harmonic). If the resulting resonance frequency of the combined AC
system and filters is equal to or close to a harmonic component of inrush current of
the same frequency, overvoltages occur.
2.7.2 Estimation of magnitude of first peak
A transformer user is generally interested in knowing the maximum value of
inrush current and the rate of decay of inrush current. If the saturation flux density
of core material is 2.03 T, the flux of magnitude (2.03×A
c
) is contained in the core,
where A
c
is the net core area. Rest of the flux spills out of the core, whose path is
predominantly in air. The ampere-turns required to produce the air flux are so
large that they can be also assumed to produce 2.03 T in the core. For the worst
instant of switching it can be written that
(2.32)
where A
w
is the mean area enclosed by a winding turn. Hence, the maximum
inrush current (first peak), i
0max
, drawn by the energized winding with N
1
turns and
Copyright © 2004 by Marcel Dekker, Inc.
Magnetic Characteristics 59
h
w
height can be calculated for a single-phase transformer from the following
equation (H is magnetic field intensity) as
(2.33)
(2.34)
For three-phase transformers, calculation of inrush current needs more
explanation. Let us consider the following three cases:
1) If it is a delta connected primary, each of the phases is independently
connected to the network, and the inrush phenomenon corresponding to flux of
each phase takes place as in the case of a single-phase transformer. This results in
the same value of phase inrush current as that of the single-phase transformer. But
in terms of line currents, inrush is less severe. Under normal operating conditions,
line current is times the phase current. During the inrush condition, only one
phase is having large inrush current (the phase which gets switched at the worst or
near worst instant of voltage switching); hence the line current is almost equal to
the phase current. Hence, the per-unit line inrush current of three-phase
transformer with delta connected primary is 0.577 times the
corresponding inrush current of a single-phase transformer.
2) For a bank of three single-phase transformers having independent magnetic
circuits, with star connected primary and delta connected secondary, the current
distribution expressed in terms of the maximum inrush current (i
0max
) of single-
phase transformer is shown in figure 2.15. It is assumed that phase a has the
maximum transient inrush current.
Figure 2.15 Inrush in Y-delta bank of transformers
Copyright © 2004 by Marcel Dekker, Inc.