Báo cáo lâm nghiệp: "Genetic variation of wood density components in a radiata pine progeny test located in the south of Chile" pps
Bạn đang xem bản rút gọn của tài liệu. Xem và tải ngay bản đầy đủ của tài liệu tại đây (850.83 KB, 10 trang )
105
Ann. For. Sci. 62 (2005) 105–114
© INRA, EDP Sciences, 2005
DOI: 10.1051/forest:2005002
Original article
Genetic variation of wood density components in a radiata pine
progeny test located in the south of Chile
Francisco ZAMUDIO
a
*, Philippe ROZENBERG
b
, Ricardo BAETTIG
a
, Adriana VERGARA
a
, Marco YAÑEZ
a
,
Carlos GANTZ
c
a
Facultad de Ciencias Forestales, Universidad de Talca, PO Box 747, 2 Norte 685, Talca, Chile
b
INRA Orléans, Unité d’Amélioration, Génétique et Physiologie Forestières, BP 20619 Ardon, 45166 Olivet Cedex, France
c
Forestal Mininco S.A., Avda. Alemania 751, PO Box 399, Los Angeles, Chile
(Received 27 October 2003; accepted 27 July 2004)
Abstract – This article describes changes in the genetic variation of wood density components with cambial age and their relationship with the
within-ring area components. Wood samples from 31 half-sib families of radiata pine were submitted to X-ray densitometry procedures. Traits
studied were earlywood (ED) and latewood (LD) density, earlywood (EA) and latewood (LA) area, and latewood proportion (LP). Between
rings 2 to 5 (juvenile wood) and 11 to 14 (mature wood), heritability estimates suggest that breeding for increased ED is feasible. Upward
selection for ED would also be associated with a phenotypic reduction in EA in juvenile and mature wood. Between rings 6 to 10, the heritability
estimates for ED indicate low genetic variation in the transition region. Attempts to increase ED by breeding might not have a significant impact
on LD, though this trait showed a moderate genetic control in this region. Any change in ED and LD would have unclear effects on EA and LA,
respectively, because of the changing pattern of genetic covariances.
wood density / heritability / radiata pine / earlywood / latewood
Résumé – Variabilité génétique de composantes de la densité du bois dans un test de descendances de pin radiata dans le sud du Chili.
Cet article décrit l’évolution en fonction de l’age cambial de la variabilité génétique de composantes de la densité intra-cerne et des relations
entre ces caractères et des composantes de la surface des cernes. Des échantillons de bois appartenant à 31 familles de demi-frères de pin radiata
ont été soumis à une procédure d’analyse microdensitométrique. Les caractères étudiés sont la densité du bois initial (ED) et du bois final (LD),
la surface du bois initial (EA) et du bois final (LA) et la proportion de bois final dans le cerne. Entre les cernes 2 à 5 (bois juvénile) et les cernes
11 à 14 (bois adulte), les valeurs estimées d’héritabilité suggèrent qu’il est possible d’augmenter ED génétiquement. Une sélection pour une
augmentation de ED entraînerait une diminution phénotypique de EA dans le bois juvénile et le bois adulte. Dans la région de transition
représentée par les cernes 6 à 10, les estimations de l’héritabilité montrent peu de variabilité génétique. Des tentatives d’augmenter génétiquement
la densité de ED pourraient ne pas avoir d’effet significatif sur LD, même si ce caractère est lui-même moyennement génétiquement contrôlé
dans cette zone. Toute modification de ED et LD aurait des effets changeants sur EA et LA en raison des variations de la valeur des covariances
génétiques.
densité du bois / héritabilité / pin radiata / bois initial / bois final
1. INTRODUCTION
Genetic improvement of radiata pine has been conducted in
Chile since the late 70’s, mainly by breeding of parents selected
for their outstanding growth rate and form, although wood den-
sity is considered as the main trait of interest by the forest indus-
try. The number of commercial plantings with specific families
(full- and half-sibs) or genotypes (clones) will systematically
increase in the future. Site preparation, pruning, and thinning
are part of currently and intensively applied silvicultural treat-
ments. Hence, trees from improved genetic stocks will reach
harvest volume at a younger age and the proportion of juvenile
wood within the stem will increase. In New Zealand, the real-
ized genetic gain in stem straightness and stem diameter growth
in radiata pine has already produced an increment of juvenile
wood proportion [7].
The properties of juvenile wood as compared to mature
wood have been widely discussed. The general viewpoint is
that juvenile wood has a lower quality than mature wood,
although there are some exceptions depending on the end prod-
ucts. Juvenile wood does not have the same adverse connota-
tion as it formerly did for fiber production since TMP and other
methods of pulp manufacture have been developed. In juvenile
wood, the lignin content is higher and the cellulose content is
* Corresponding author:
106 F. Zamudio et al.
lower than in mature wood [42]. In Pinus species, juvenile
wood is usually characterized by shorter tracheid length and
thinner cell walls than mature wood, and thus often produces
lower specific gravity wood. Characteristics of solid wood
products also differ depending on whether they are made from
juvenile or mature wood; strength varies greatly with cambial
age and is closely related to microfibrillar angle as well as to
specific gravity. Because of its low strength and instability on
drying, juvenile wood is still a problem for most solid wood
products [42].
Wood heterogeneity is described as an important defect and
uniformity of juvenile wood is usually lower than that of mature
wood [40, 41]. Therefore, possible consequences of an increase
in juvenile wood proportion in the stems of future plantings are
a decrease of wood mechanical properties and an increase of
wood heterogeneity. The forest managers and the wood proc-
essors have to face this challenge. The forest managers may
have to accept lower prices for harvested timber. The wood
processors may have to optimize processing conditions to
achieve a reliable end product performance, which can produce
an increment in processing costs and in the price of the end
products.
One possible action to diminish some of the negative effects
of short rotations on wood quality can be to breed for increased
juvenile wood density [27, 35]. Wood uniformity across the
stem is sometimes cited as the most important of all wood prop-
erties, the most desired by the product managers and the most
closely tied to profitability [41]. Hence, it would be desirable
that genotypes with improved juvenile wood properties also
show a reduced within-tree variation [30]. The breeder needs
to consider also the use of silviculture since it influences wood
properties variation as well.
Wood density is also often considered the most important
single property because of its strong effect on yield and quality
of both fibrous and solid wood products [2, 12]. It is a combi-
nation of several characteristics, each of which has a strong
inheritance pattern of its own.
Here, we consider that: (1) understanding the inheritance
pattern of ring density components may help to define selection
strategies aiming to increase the density of juvenile wood and
simultaneously reduce the variation of this trait between juve-
nile and mature wood; (2) breeding for increasing the value of
wood density components of selected regions of the stem (in
terms of cambial age) will enhance wood uniformity (from pith
to bark); (3) thus, a reduction of within-tree heterogeneity has
to take into account the genetic variation of within-ring density;
(4) for radiata pine in Chile, wood microdensity variation from
pith to bark is a good descriptor of within-tree heterogeneity;
and (5) to avoid unfavorable correlated responses, the genetic
relationships among ring density components and ring area
related traits must carefully be assessed.
In a first paper [38], we analyzed the relationship between
ring density and ring radial growth. We reported significant
changes in genetic control of average ring density (ARD) with
cambial age, particularly within the transition zone between
juvenile and mature wood. Heritability estimates in the juvenile
wood region were high, which is positive for breeding pur-
poses, but pith-to-bark trends in genetic and phenotypic corre-
lations between ARD and radial growth were difficult to inter-
pret. Thus it was not possible to use these results to suggest
general selection strategies for wood density in the radiata pine
breeding program. Here, we report results that describe changes
in: (1) the genetic variation of wood density components with
cambial age and (2) the relationships among these traits and
within-ring area components. Results are based on a decompo-
sition of ring density into its earlywood and latewood compo-
nents.
2. MATERIALS AND METHODS
2.1. Source of material
Wood samples used in this study came from a progeny test of radi-
ata pine established with 31 open-pollinated families in the South of
Chile by Forestal Mininco S.A. The test site was located near Los
Angeles, Bio-Bio province (lat. 37° 03’ 05’’ S, long. 72° 27’ 20’’, alti-
tude 122 m above sea level). The area is flat with a mean annual pre-
cipitation of 1 100 mm and a period of 4–5 months of drought. The
soil texture is sandy with a good drainage capability. Trees were
planted in 1981 at 3 m × 2.5 m spacing. The experiment was arranged
in seven randomized complete blocks and families were established
in five-tree row plots. No particular silvicultural treatment was per-
formed before the wood sample collection. The number of surviving
trees per family was variable.
2.2. Wood samples collection
Between one and two trees per plot were chosen for this study.
Selected trees were free of any physical and mechanical damage and
did not show any sign of plagues and diseases. Finally, a sample of
317 trees were felled at the end of 1998 (including 23 trees with no
pedigree and used as genetic controls) and two disks of wood of 20
and 10 cm thick, respectively, were obtained at 1.3 m above ground
level from each of them. The first disk was used for assessing physical
properties as well as radial growth, whereas the second one served for
measuring chemical properties, including cellulose and lignin content.
Geographical North was also marked on each wood disk, as a reference
for further analyses.
Along the north radius of each 20 cm thick wood disk, a sub-sample
10 mm wide × 1.8 mm thick was obtained from pith to bark. This direc-
tion was chosen to minimize the presence of compression wood, since
the prevailing winds were from the southwest.
2.3. Wood properties assessment
Wood samples were dried to equilibrium moisture of 12% and res-
ins were extracted with a solution of ethanol. Intra-ring density infor-
mation for each sample was obtained by using an indirect-reading
X-ray densitometry system at the INRA Research Station of Orléans,
France. The X-ray films of wood samples were digitized by using a
scanner with a color resolution of eight bits (256 tones of gray) and a
spatial resolution of 300 pixel/inch. Each pixel covered a length of
0.085 mm. The digitized images were processed by using the WinD-
ENDRO software [14]. The initial raw data consisted of a density pro-
file at the pixel level. Ring limits were also determined with the soft-
ware and a careful visual observation of the actual wood samples. The
last step in the data generation process used a computer routine written
in C to measure the traits of interest.
The first and last annual rings were discharged from all samples
because they were usually incomplete. This ensured the same statis-
tical precision at all rings. Thus, only rings 2 to 14 were included in
this research. The minimum (Dmin) and maximum (Dmax) density
Genetic variation within ring wood density 107
was measured in each ring. The mid density point (MDP) was calcu-
lated as half the difference between Dmin and Dmax (midway between
the minimum and maximum densities of the ring) plus the minimum
value:
(1)
The average ring density values lower and higher than the MDP were
denoted as early- (ED) and latewood (LD) density, respectively. Dis-
tances from pith across rings i (d
i
) and i–1 (d
i–1
) were directly obtained
from the X-ray density profiles and used to measure the overall ring
area (RA) as π(d
2
i
– d
2
i–1
). The areas lower and higher than the MDP
were denoted as early- (EA) and latewood (LA) areas, respectively.
The latewood proportion (LP) was estimated as the ratio between the
ring area consisting of latewood and the total ring area. Cumulative
late proportion (CLP) at cambial age t was estimated as
(2)
where LA
i
and RA
i
were defined above. The measurement units were
kilograms per cubic meter (kg/m
3
), for ED, LD, and squared centim-
eters (cm
2
) for EA, LA, and RA.
2.4. Linear mixed model and assumptions
The mixed linear model used to represent the data obtained for a
given trait and related to a particular ring was
Y
ijk
= µ + R
i
+ f
j
+ I
ij
+ e
ijk
(3)
where Y
ijk
is a phenotypic individual observation; µ is the overall
mean; R
i
is the fixed replication effect; f
j
is the random family effect
with mean zero and variance ; I
ij
is the random interaction or plot
effect with mean zero and variance ; and e
ijk
is the random residual
effect with mean zero and variance . Thus, Y
ijk
has mean µ + R
i
and
the phenotypic variance was estimated as = + + . Fam-
ilies were considered to be full maternal half-sibs, and therefore the
following relationship was assumed to estimate
(4)
where V
Ax
and
σ
2
Fx
are the additive genetic variance and family var-
iance component for trait X, respectively.
The final database was unbalanced due to the sampling scheme (1
to 2 healthy trees per plot). The normality of experimental data was
checked using the SAS INSIGHT procedure [31]. Analyses of vari-
ance were conducted for all traits and cambial ages, and type III sums
of squares were calculated by using the SAS GLM procedure [31]. The
Satterthwaite’s approximated test was used to measure the level of sig-
nificance of family related effects [29]. Variance components for each
trait and cambial age were estimated using the restricted maximum
likelihood principle and the SAS MIXED procedure [20].
2.5. Genetic and statistical analyses
The narrow-sense individual tree heritability (h
2
) was calculated
for each trait measured at the cambial age t (ring number) as
(5)
where
σ
2
F
and
σ
2
P
are the family and phenotypic variance estimates,
respectively.
Genetic correlations among different combinations of traits could
not be estimated at several cambial ages because the family variance
component of one trait was zero, as shown below in the figures depict-
ing the trend of heritability changes with cambial age. To overcome
this inconvenience, individual data were divided by the appropriate
phenotypic standard deviation. This transformation of data removed
the scale differences among traits and allowed reliable comparisons
of family covariances among different traits. Covariance components,
for each cambial age and transformed (standardized) traits, were also
estimated using the restricted maximum likelihood principle and the
SAS MIXED procedure [20]. It can be demonstrated that the family
covariance component estimated with transformed data (Cov
Fxy(std)
)
is equal to:
(6)
where Cov
Fxy
,
σ
Px
, and
σ
Py
are the family covariance component of
the original non-transformed data and phenotypic standard deviations
of the traits X and Y, respectively. Thus, the new family covariance
(transformed data) represents the contribution of the original family
covariance (non-transformed data) to the real phenotypic correlation.
A further analysis of the radial pattern of association among different
traits was conducted by comparing the family covariance, based on
transformed individual data, with the corresponding phenotypic cor-
relation, which was estimated as
(7)
where Cov
Pxy
is the phenotypic covariance between traits X and Y, and
was calculated as Cov
Pxy
= Cov
Fxy
+ Cov
Ixy
+ Cov
exy
, i.e. as the sum
of the family, interaction, and residual covariance components,
respectively. It can also be demonstrated that the phenotypic correla-
tion, r
Pxy
, is equal to Cov
Fxy(std)
+ Cov
Ixy(std)
+ Cov
exy(std)
, i.e. to the
sum of the family, interaction, and residual covariance components
respectively, estimated with transformed data. Here, we are also
assuming the following relationship:
Cov(A
x
, A
y
) = 4 Cov
Fxy
(8)
where Cov(A
x
, A
y
) and Cov
Fxy
are the additive genetic covariance and
family covariance component between traits X and Y, respectively.
Approximate standard errors of heritability and new family covar-
iance estimates were calculated by using the asymptotic large-sample
dispersion matrix associated to the REML method [32], and the Taylor
series expansion analysis [21].
3. RESULTS AND DISCUSSION
3.1. Variation of family means with cambial age
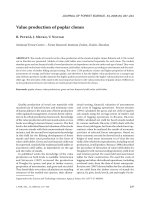
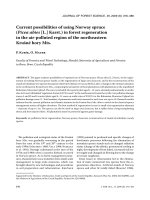
Family mean values for ED increased with cambial age for
all families (Fig. 1A). The same trend was observed for average
ring density reported in our previous paper. All families also
followed the same pattern of LD with cambial age (Fig. 1B).
Several studies reported that some coniferous species show
a tendency to increase values of ring density components out-
ward from the pith [10]. For example, Vargas-Hernandez [34]
observed that area weighted ED and LD increased with cambial
age in 60 families of coastal Douglas-fir that were analyzed at
age 15. A similar pattern was reported by Wang [36], who stud-
ied families of lodgepole pine and also observed that LD was
initially low but increased during the first years, reached its
MDP Dmin
Dmax Dmin–()
2
Dmin Dmax–()
2
=+
.
=
CLP
t
LA
i
i 2=
t
∑
RA
i
i 2=
t
∑
=
σ
f
2
σ
I
2
σ
e
2
σ
P
2
σ
f
2
σ
I
2
σ
e
2
V
AX
4
σ
Fx
2
=
h
2
4
σ
F
2
σ
P
2
=
Cov
Fxy std()
Cov
Fxy
σ
Px
σ
Py
=
r
Pxy
Cov
Pxy
σ
Px
2
σ
Py
2
()
1/2
=
108 F. Zamudio et al.
maximum at age 6, and then started to decline. Megraw [22]
also found for loblolly pine that latewood specific gravity
increases rapidly with ring number from the pith until values
reach a characteristic high level, at around ring 5. The same pat-
tern of changes in latewood density was also mentioned by
Zobel and Sprague [42] for other conifers. These authors added
that earlywood density tends to change less from pith to bark.
In contrast Hylen [18] studied Norway spruce and found that
average values of ED and LD decreased over the first few rings
from the pith and reached their lowest values at different rings.
Nicholls [26] also discussed the presence of different patterns
of changes in ring density from pith outwards in radiata pine.
In his study, he mentioned that density generally increased from
the pith outwards. But he also reported that some radiata pine
trees exhibited an initial decrease in density in the first few rings
before it started to increase outwards.
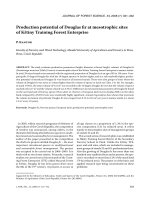
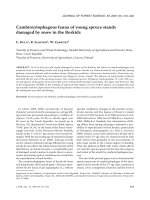
All family mean values for EA increased after ring 2 and
reached a plateau between rings 4 and 7. After ring 7, family
average tended to decrease (Fig. 2A). The same trend was also
observed for the total ring area as reported in our previous paper
[38]. All families showed the same fluctuating pattern of
changes for LA between rings 2 and 6 (Fig. 2B). The drastic
decrease in family mean LA at ring 5, recorded in all progenies,
is in direct relationship with the increment in LD observed at
the same ring (Fig. 1B).
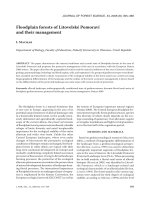
Most of the family averages for LP decreased from ring 2
to a minimum at ring 5 (see Fig. 3A). After ring 6, mean values
fluctuated erratically outwards to the bark. Family means for
CLP also decreased from ring 2 towards ring 5 (Fig. 3B), but
after ring 7 values asymptotically approached around 35%, for
all families.
Figure 1. Changes in family mean values for within ring density com-
ponents with cambial age. (A) ED; (B) LD.
Figure 2. Changes in family mean values for within ring area com-
ponents with cambial age. (A) EA; (B) LA.
Genetic variation within ring wood density 109
Wang [36] studied lodgepole pine and also recorded that LP
was high in the early rings, but declined sharply thereafter. In
Douglas-fir, Vargas-Hernandez [34] also observed a decreas-
ing but irregular trend in LP in early cambial age, and then a
steady increase after ring 11. A contrasting result was observed
by Hylen [18] in a young Norway spruce progeny test where
the LP increased steadily with increasing ring number, for indi-
vidual ring and cumulative values. Gantz [13] also reported
mean latewood percentages ranging between 38% and 45% for
10-year-old radiata pine trees growing on three different sites
in Chile.
Latewood and earlywood amounts are difficult to measure
since there is a transition zone between them. The two types of
woods are especially difficult to assess in the low-density con-
ifers, the soft pines, and the diffuse-porous hardwoods [41].
Different researchers can obtain different percentages when
measuring the same cross section of wood, depending on the
individual’s opinion or method used to determine where early-
wood stops and latewood starts. Though its accurate assess-
ment is not easy, latewood percent can be used to categorize
wood into broad groups [42]. According to Van Buijtenen [33],
the percent of latewood has by far the largest influence on wood
specific gravity. Zobel and Jett [41] mention that latewood per-
cent is usually referred as the ratio of latewood to earlywood.
In our research, we estimated latewood proportion using the
definition of Vargas-Hernandez [34] and Hylen [18], which is
based on the area of the ring occupied by the latewood.
Earlywood is characterized by lower density, larger lumens,
and thinner cell walls than latewood [16], and to some extent
by a greater cell size [41]. As a result, earlywood pulps are very
different from those made from latewood [42]. Watson and
Dadswell [37] reported that pulps of loblolly pine containing
20–50% of latewood fibers had a good tearing strength while
retaining acceptable levels for bursting and tensile strength.
They also mention that the proportion of latewood for radiata
pine was less than 20%, which would not have any marked
influence on papermaking properties. Zonel and Jett [41]
reported that the proportion of latewood in radiata pine is less
than 50%. Harris [15] stated that this percentage is about 20%.
Our results show that the cumulative latewood proportion
(CLP) approached a steady value around 35% with increasing
cambial age.
3.2. Family differences and changes in genetic control
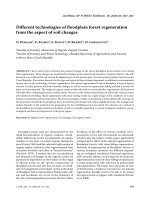
Family differences in ED (Fig. 4A) were only significant
near the pith (rings 2 to 4) and near the bark (rings 11 to 14).
Heritability for ED dropped from 0.43 at ring 2 to less than 0.2,
between rings 5 to 10, reflecting low genetic variation (Fig. 5A).
The maximum value was 0.51 and was recorded at ring 12. Also
the precision of the heritability estimate is low between rings
5 to 11. In our previous paper, we studied the pattern of average
ring density (ARD) of the whole ring and this trait followed the
same trend as ED.
The highest heritability for LD was also recorded at ring 2
(0.35). No genetic variation was observed at rings 11 and 13.
Heritability followed an oscillating pattern with cambial age
(Fig. 5B). The highest family differences in LD (Fig. 4A) were
also observed at rings 2 and 10.
In radiata pine, Nicholls [24] also reported a systematic
change in heritability with cambial age for wood density. He
observed that heritability of basic density in radiata pine
decreased from the pith outward until a minimum reached
around ring 9, followed by an increase in heritability with fur-
ther increase in age. In a following paper [25], the same author
states that the genetic control of this trait appears to reach a
maximum early in the life of trees and therefore maximum
gains from selection can be obtained in the first-formed wood.
In a 23 year-old radiata pine progeny test established in New
South Wales, Australia, Nyakuengama [28] found that narrow
sense heritabilities of latewood density initially decreased from
the pith until ring 12 and then increased until ring 18, while ear-
lywood density followed an oscillating pattern of variation. In
their study of families of radiata pine established in several sites
in New Zealand, Cown and Ball [8] also measured average ring
density and determined that heritability of wood density in the
Figure 3. Changes in family mean values for latewood proportion
with cambial age. (A) LP; (B) CLP.
110 F. Zamudio et al.
juvenile (rings 1 to 10) and mature (rings 11 and more) wood
sections were 0.62 and 0.68, respectively.
Zobel and Jett [41] stressed that for other species, such as
loblolly pine, heritability of wood density has a clear tendency
to increase with cambial age. In a study conducted in slash pine
(Pinus elliottii), Hodge and Purnell [16] observed moderate
heritability values for density (h
2
≥ 0.2) close to the pith (rings 3
and 4) and in mature wood (rings 11 and 13). Intermediate rings
showed slightly lower heritabilities (h
2
= 0.1–0.15).
In our study, heritability tended to increase with cambial age
for EA (Fig. 5C). Additive genetic variation was low (h
2
< 0.2)
before ring 8. Between rings 9 and 14, genetic control was mod-
erate with heritability ranging from 0.21 at ring 11 to 0.43 at
ring 13.
Family differences in LA (Fig. 4B) were significant only at
ring 14, also location of the highest heritability estimate for this
trait (Fig. 5D). In general, LA was under low genetic control
at most cambial ages (h
2
≤ 0.25).
Genetic control for LP was negligible (h
2
≤ 0.15) before ring
9 and 12 (Fig. 5E). Additive genetic variation was moderate (h
2
>
0.25) only at rings 11 and 13. Except for rings 12 and 14, family
differences in LP (Fig. 5B) were mainly significant after ring 8.
In contrast with these results, Hodge and Purnell [16] observed
heritability values for LP of 0.12–0.13 near the pith (rings 3 and 4)
and close to zero for intermediate and later rings. In our case,
there is little additive variance for LP in juvenile wood and all
trees produced the same percentage of earlywood (Figs. 3A and
5E).
The heritability estimates reported here should be viewed in
relative terms. The wood analysis was based on samples from
only one location and environmental effects have changed as
the stand matured. Therefore, heritability values may be biased
upward because of inadequate environmental sampling [23]. If
heritability is estimated on a single site, the family × environ-
ment interaction variance cannot be assessed and is added to
the estimate of family variance on that particular site. Thus, the
single-site heritability is biased because it estimates the sum of
additive plus additive × environment variance relative to the
total phenotypic variance [17].
3.3. Changes in family covariation and phenotypic
correlation between density components
The family covariance between ED and LD tended to
decrease with cambial age and was negative at rings 8 and 10
(Fig. 6A), which are in the transition region between juvenile
and mature wood. Contrarily, the phenotypic correlation
between both traits tended to increase with cambial age, par-
ticularly after ring 5 (Fig. 7A). In general, the family covariance
reflected a low contribution to the phenotypic correlation
between ED and LD across cambial ages.
The family covariance between ED and EA was negative at
age 2 and positive between ages 3 and 7, which is mainly juve-
nile wood (Fig. 6B). This covariance decreased with cambial
age after ring 5 and was negative between cambial ages 10 and
14. These results indicate a positive genetic relationship
between ED and EA in the wood close to the pith shifting to a
negative relationship towards the region formed by mature
wood. The phenotypic correlation between ED and EA was
positive only between rings 5 and 7 (Fig. 7B), but weak (< 0.1).
This correlation became more negative towards the pith and the
bark. It seems that non-genetic factors had more important
influences on both traits in mature wood (where |0.1| < r
Pxy
).
From rings 3 to 7, family covariance between LD and LA
was lower than between ED and EA (Fig. 6B). This relationship
was reversed from rings 9 to 13. Eight of the 13 rings showed
a negative covariance. The phenotypic correlation between LD
and LA was negative in 13 rings (Fig. 7B) and more negative
again between ED and EA in 10 rings. It is evident that for most
cambial ages, regardless of the type of wood formed (early or
Figure 4. Results from approximated F-tests for ring area and density
components. Significant differences among families are showed when
F-values are above the continuous line representing F = 1.56, and
P < 0.05. (A) ED and LD; (B) EA, LA and LP.
Genetic variation within ring wood density 111
Figure 5. Age trends in individual tree heritability (h
2
) and standard errors (SE) for (A): ED, (B): LD, (C): EA, (D): LA, and (E): LP, at different
ring numbers counted from the pith.
112 F. Zamudio et al.
Figure 6. Changes in family covariation estimated with transformed
data, which is the contribution of the original family covariation (non-
transformed data) to the phenotypic correlation: (A) ED v/s LD,
(B) ED v/s EA and LD v/s LA, and (C) PL v/s ED and PL v/s LD.
Figure 7. Changes in phenotypic correlation with cambial age:
(A) ED v/s LD; (B) ED v/s EA, and LD v/ LA; and (C) PL v/s ED
and PL v/s LD.
Genetic variation within ring wood density 113
latewood), an increment in LD is related to a decrease in the
corresponding area. Our results show that the genetic relationship
between both traits is negative but weak before ring 5 (juvenile
wood) and after ring 10 (mature wood).
The relationships between wood density components and
growth rate are of great importance. Few references are avail-
able describing changes with cambial age in radiata pine. Cown
[9] summarized several studies regarding the effect of growth
rate on the density of radiata pine, saying that there is no clear
correlation between growth rate and density, though Bannister
and Vine [1] found a weak negative phenotypic correlation
between both traits. Cown [9] added that tree age, not tree
growth rate, was the determining factor for wood density in all
site conditions studied. Nicholls et al. [27] also reported a small,
non-significant genetic correlation between ring width and
average density and the presence of a small negative correlation
that tended to disappear in older growth rings, which agrees
with results presented by Zamudio et al. [38]. In contrast, Burdon
and Young [4] recorded a strong negative correlation between
wood density and growth rate in rings 6 to 10, a weaker corre-
lation in rings 10 to 20, and no correlation in rings 0 to 5. Our
results suggest a weak positive genetic correlation between ear-
lywood density and its area in juvenile wood, and an increas-
ingly negative correlation between these traits towards the
mature wood.
Strong to moderate negative genetic relationships between
diameter growth rate and wood density have been reported in
several species, such as Picea abies [41], Picea glauca [5] and
Pseudotsuga menziesii [3, 19, 35]. Zhang et al. [39] studied
black spruce progenies growing in two sites and observed that
higher growth rate resulted in lower latewood percent and
lower wood density. They also suggested that latewood density
was significantly less related to latewood width than earlywood
density with earlywood width.
Family covariance between ED and PL was positive at rings 2,
7, 8 and after ring 9 (Fig. 6C) with a trend to increase with cam-
bial age. Family covariance between PL and LD was negligible
at rings 2 and 3 and positive only at rings 9 and 14. The phe-
notypic correlation between ED and PL is very weak, regardless
of the cambial age (eight values were < |0.1|). The phenotypic
correlation between LD and PL was zero at ring 7 and negative
at the others cambial ages, with 11 correlations in the range
–0.6 < r
P
< –0.3 (Fig. 7C). This means that an increment in
latewood density conducts to an evident but moderate decrease
in latewood proportion. Considering the magnitude of the phe-
notypic correlation, we think that the relationship between LD
and PL is mainly due to non-genetic effects.
3.4. Environmental effects on wood density components
Yearly variations in climatic conditions like the decrease in
the precipitation rate from 1986 to 1990 could have produced
the pattern of changes in mean ED and LD observed in
Figures 1A and 1B, although the environmental effect was
more pronounced on LD than on ED. For example, all families
follow the same highly significant increment in average LD
recorded at age 5. A similar but smaller increment in mean ED
was also observed in all families at age 4. Most authors agree
that the latewood component is the most sensitive to environ-
mental influences [7, 8]. Harris [15] found that LD in radiata
pine in New Zealand was closely correlated with mean annual
temperature (r = 0.94). In southern pines, Clark and Saucier [6]
stated that juvenile wood patterns were related to the length of
the growing season and to the rainfall patterns. Cregg et al. [11]
showed that the date of transition from earlywood to latewood
was earlier in dryer summer.
The erratic pattern of genetic control followed by LD is
another indication that this trait is more susceptible to environ-
mental effects than ED and average ring density. Thus, its
improvement should also be more sensitive to silviculture than
to genetic manipulation. Potential factor of the environment
affecting the trait is water availability in the soil, which is gen-
erally closely related to precipitation, temperature and photope-
riod. In Chile, radiata pine is planted in areas ranging from med-
iterranean to temperate climate, with very variable number of
months with precipitation during the growing season.
4. CONCLUSIONS
Our results suggest that any selection effort to modify the
homogeneity of wood density within the stem will have a more
direct impact on ED than LD. ED showed significant genetic
variation in juvenile wood region and after ring 11, thus breed-
ing for increasing ED in both regions is feasible.
From pith to bark phenotypic variation in density compo-
nents can be interpreted as plasticity, while genetic variation
in the same density components can be interpreted as an adap-
tive response to specific environmental conditions (here a
sandy soil, an average precipitation rate of 1100 mm year
–1
and
a drought period close to 5 months [38]). Next step will be to
determine whether the same pattern of changes in phenotypic
traits and in genetic parameters with cambial age is observed
or not in other progenies established in different test sites, under
similar or different environmental conditions. Results will con-
tribute to better understanding the consequences on wood quan-
tity and wood quality of the observed plastic and adaptive
response of radiate pine to varying environments in Chile.
Acknowledgments: Research was funded by the Chilean National
Science and Technology Commission (CONICYT), grant FONDE-
CYT No. 1980049. Support came also from the ECOS-CONICYT
grant No. C97B04. The authors are also grateful to Forestal Mininco
S.A. for its technical support in the field, for providing the database,
and for allowing publishing of the results of this study. The field exper-
iment complies with the current Chilean laws regarding safety and
environmental issues.
REFERENCES
[1] Bannister M.H., Vine M.H., An early progeny trial in Pinus radiata.
4. Wood density, N.Z. J. For. Sci. 11 (1981) 221–243.
[2] Barefoot A.C., Hitchings R.G., Ellwood E.L., Wilson E., The rela-
tionship between loblolly pine fiber morphology and kraft paper
properties, Bull. NC Agr. Exp. Stn. Tech. Bull. 202 NC State Univ.
Raleigh, NC, 1970, 88 p.
[3] Bastien J.C., Roman-Amat B., Vonnet G., Natural variability of
some wood quality traits in coastal Douglas-fir in a French progeny
test: implications on breeding strategy, in: Ruetz W., Nather J.
(Eds.), Proceedings, IUFRO Working Party on Breeding Strategies
114 F. Zamudio et al.
for Douglas-fir as an Introduced Species, June 1985, Vienna, Aus-
tria, 1985, 21, pp. 169–186.
[4] Burdon R.D., Young G.D., Some wood properties in four Pinus
radiata provenances at Kaingaroa Forest, rings 1–20 from pith-
pilot results, in: Proc. 11th Meeting Representative Research Wor-
king Group No. 1 (Forest Genetics) Australian For. Council Coo-
nawarra, South Australia, 1991, pp. 141–143.
[5] Carriveau A., Beaulieu J., Mothe F., Wood density of natural white
spruce populations in Quebec, Can. J. For. Res. 17 (1987) 675–682.
[6] Clark A., Saucier J.R., Influence of planting density, intensive cul-
ture, geographic location, and species on juvenile wood formation
in southern pine, Georgia For. Res. Pap. 85, Georgia For. Comm.
1991, 13 p.
[7] Cown D.J., Corewood (juvenile wood) in Pinus radiata – should
we be concerned? N.Z. J. For. Sci. 22 (1992) 87–95.
[8] Cown D.J., Ball R.D., Wood densitometry of 10 Pinus radiata
families at seven contrasting sites: Influence of tree age, site, and
genotype, N.Z. J. For. Sci. 31 (2001) 88–100.
[9] Cown D.J., McConchie D.L., Young G.D., Radiata pine-wood pro-
perties survey, FRI Bull. No. 50, Rotorua, New Zealand, 1991, 50 p.
[10] Cown D.J., Parker M.L., Densitometric analysis of wood from five
Douglas-fir provenances, Silvae Genet. 28 (1979) 48–53.
[11] Cregg B.M., Dougherty P.M., Hennessey T.C., Growth and wood
quality of young loblolly pine trees in relation to stand density and
climatic factors, Can. J. For. Res. 18 (1988) 851–858.
[12] Einspahr D.W., van Buijtenen J.P., Peckham J.R., Pulping charac-
teristics of ten years old loblolly pine selected for extreme wood
specific gravity, Silvae Genet. 18 (1969) 57–61.
[13] Gantz C.H., Evaluating the efficiency of the resistograph to esti-
mate genetic parameters for wood density in two softwood and two
hardwood species, M.S. thesis, College of Natural Resources,
North Carolina State University, 2002, 88 p.
[14] Guay R., Gagnon R., Morin H., A new automatic and interactive
tree ring measurement system based on a line scan camera, Forest.
Chron. 68 (1992) 138–141.
[15] Harris J.M., Specific gravity and summerwood percent, N.Z. For.
Serv. For. Res. Inst. FRI Rotorua, N.Z. Symp., 1966, pp. 34–36.
[16] Hodge G.R., Purnell R.C., Genetic parameter estimates for wood
density, transition age, and radial growth in slash pine, Can. J. For.
Res. 23 (1993) 1881–1891.
[17] Hodge G.R., White T.L., Genetic parameter estimates for growth
traits at different ages in slash pine and some implications for bree-
ding, Silvae Genet. 41 (1992) 252–262.
[18] Hylen G., Age trends in genetic parameters of wood density in
young Norway spruce, Can. J. For. Res. 29 (1999) 135–143.
[19] King J.N., Yeh F.C., Heaman J.Ch., Dancik B.P., Selection of wood
density and diameter in controlled crosses of coastal Douglas-fir,
Silvae Genet. 37 (1988) 152–157.
[20] Littell R.C., Milliken G.A., Stroup W.W., Wolfinger R.D., SAS
®
System for Mixed Models, Cary, NC: SAS Institute Inc., 1996,
633 p.
[21] Lynch M., Walsh B., Genetics and analysis of quantitative traits,
Sinauer Associates, Inc. MA., 1998, 980 p.
[22] Megraw R.A., Wood quality factors in loblolly pine, TAPPI Press,
Atlanta, GA, 1985, 89 p.
[23] Namkoong G., Barefoot A.C., Hitchings R.G., Evaluating control
of wood quality through breeding, Tappi 52 (1969) 1933–1938.
[24] Nicholls J.W., Preliminary observations on the change with age of
the heritability of certain wood characteristics in Pinus radiata clo-
nes, Silvae Genet. 16 (1965) 18–20.
[25] Nicholls J.W., Assesment of wood quality for tree breeding. IV.
Pinus pinaster grown in western Australia, Silvae Genet. 16 (1967)
21–28.
[26] Nicholls J.W., Within-tree variation in wood characteristics of
Pinus radiata D. Don, Aust. For. Res. 16 (1986) 313–335.
[27] Nicholls J.W., Morris J.D., Pederick L.A., Heritability estimates of
density characteristics in juvenile radiata wood, Silvae Genet. 29
(1980) 54–61.
[28] Nyakuengama J.G., Matheson C., Evans R., Spencer D., Vinden P.,
Effect of age on genetic control of Pinus radiata earlywood and
latewood properties, APPITA J. 53 (1999) 103–107.
[29] Rawlings J.O., Pantula S.G., Dickey D.A., Applied regression anal-
ysis. A research tool, 2nd ed., Springer-Verlag, 1998, 657 p.
[30] Ridoutt B.G., Sorensson Ch.T., Lausberg M.J.F., Wood properties
of twenty highly ranked radiata pine seed production parents selec-
ted for growth and form, Wood Fiber Sci. 32 (1998) 128–137.
[31] SAS Institute Inc., SAS/STAT
®
Software: Changes and Enhance-
ments through Release 6.12, Cary, NC SAS Institute Inc., 1997,
1167 p.
[32] Searle S.R., Casella G., McCulloch C.E., Variance components, John
Wiley & Sons, New York, 1992, 501 p.
[33] Van Buijtenen J.P., Anatomical factors influencing wood specifics
gravity of slash pines and the implications for the development of
high-quality pulpwood, Tappi 47 (1964) 401–404.
[34] Vargas-Hernandez J., Adams W.T., Krahmer R., Family variation
in age trends of wood density traits in young Coastal Douglas-fir,
Wood Fiber Sci. 26 (1994) 229–236.
[35] Vargas-Hernandez J., Adams W.T., Genetic variation of wood den-
sity components in young coastal Douglas-fir implications for tree
breeding, Can J. For. Res 21 (1991) 1801–1807.
[36] Wang T., Aitken S., Rozenberg P., Millie F., Selection for impro-
ved growth and wood density in lodgepole pine: Effects on radial
patterns of wood variation, Wood Fiber Sci. 32 (2000) 391–403.
[37] Watson A.J., Dadswell H.E., Influence of fibre morphology on
paper properties. Part II. Earlywood and Latewood, APPITA 15
(1962) 116–129.
[38] Zamudio F., Baettig R., Vergara A., Guerra F., Rozenberg P.,
Genetic trends in wood density and radial growth with cambial age
in a radiata pine progeny test, Ann. For. Sci. 59 (2002) 541–549.
[39] Zhang S.Y., Simpson D., Morgenstern E.K., Variation in the rela-
tionship of wood density with growth in 40 black spruce (Picea
mariana) families grown in New Brunswick, Wood Fiber Sci. 28
(1996) 91–99.
[40] Zobel B.J., Van Buijtenen J.P., Wood variation, its causes and con-
trol, Springer, Berlin, Heidelberg, and New York, 1989, 367 p.
[41] Zobel B.J., Jett J.B., Genetic if wood production, Springer, Berlin,
Heidelberg, and New York, 1995, 367 p.
[42] Zobel B.J., Sprague J.R., Juvenile wood in forest trees, Springer,
Berlin, Heidelberg, and New York, 1998, 300 p.