Báo cáo lâm nghiệp: "Evolution of the mineral fertility of an acidic soil during a period of ten years in the Vosges mountains (France). Impact of humus mineralisation" pps
Bạn đang xem bản rút gọn của tài liệu. Xem và tải ngay bản đầy đủ của tài liệu tại đây (172.01 KB, 8 trang )
253
Ann. For. Sci. 62 (2005) 253–260
© INRA, EDP Sciences, 2005
DOI: 10.1051/forest:2005017
Original article
Evolution of the mineral fertility of an acidic soil
during a period of ten years in the Vosges mountains (France).
Impact of humus mineralisation
Maurice BONNEAU*
INRA Centre de Nancy – Cycles biogéochimiques, 54280 Champenoux, France
(Received 12 December 2003; accepted 7 June 2004)
Abstract – A very acidic soil under an adult spruce (Picea abies) stand, in the Basses-Vosges (North-eastern France), was analysed in 1986,
and ten years later in 1996. The chemical composition of the mineral horizons did not show much variation, but the sum of exchangeable Ca
and Mg in the mineral horizons and their total contents in the OL, OF and OH horizons decreased significantly. In ten years, the Mg in particular
had decreased by about 30 kg·ha
–1
, i.e. about 1.7% per year of the exchangeable Mg present in 1986. This decrease, which is worrying for the
future, may be explained by peaks of humus mineralisation during warm summers combined with the inability of the mineral horizons, highly
saturated in aluminium, to retain Ca and Mg coming from this mineralisation in the organic horizons. As a result, these elements were lost in
drainage water instead of being taken up by the roots. As this soil was poor in weatherable minerals, the loss could not be compensated for by
mineral decomposition. It is probable that a similar situation occurs at the end of a forest rotation when organic horizons are exposed to light
and heat. Thus, the degradation of the humus from mull to dysmoder, followed by mineralisation, together with a high exchangeable Al content
in mineral horizons and acid rain, all lead to losses of Mg and secondarily Ca at different stages of development of forest stands on acidic soils.
Thus humus mineralisation, combined with a high exchangeable Al content, is one of the key mechanisms of soil acidification and
impoverishment.
aluminium / chemical fertility / climate / humus / soil acidification
Résumé – Évolution de la fertilité minérale d’un sol acide sur une période de 10 ans dans les Vosges (France). Impact sur la
minéralisation de l’humus. Un sol très acide des Basses Vosges (Nord-Est de la France), sous un peuplement d’épicéa adulte, a été analysé
en 1986, puis en 1996. La composition chimique des horizons minéraux n’a que peu varié, mais la somme du calcium et du magnésium
échangeables des horizons minéraux et totaux des horizons OL, OF et OH a diminué significativement, surtout celle de Mg qui a baissé de
30 kg·ha
–1
en dix ans, soit environ 1,7 % par an du magnésium échangeable présent en 1986. Cette diminution, préoccupante pour l’avenir, peut
s’expliquer par un pic de minéralisation de l’humus pendant les étés chauds combiné avec l’incapacité des horizons minéraux, fortement saturés
en aluminium, à retenir le calcium et le magnésium provenant de la minéralisation des couches d’humus. Ces éléments sont donc perdus par
drainage au lieu d’être prélevés par les racines. Dans ce sol, pauvre en minéraux altérables, cette perte ne peut pas être compensée par
l’altération. Une telle situation se produit certainement aussi en fin de révolution, lorsque les horizons humifères sont exposés à la lumière et à
la chaleur. Ainsi, la dégradation de l’humus de mull en dysmoder et, plus tard, sa minéralisation, couplée avec une forte teneur des horizons
minéraux en aluminium échangeable, conduit à de fortes pertes de magnésium et, secondairement, de calcium, à différents stades de
développement des peuplements forestiers en sol acide. L’association de ces deux facteurs peut être considérée comme un des mécanismes-clé
de l’acidification des sols et de leur appauvrissement.
aluminium / fertilité chimique / climat / humus / acidification du sol
1. INTRODUCTION
Forest soil acidification has been well documented during
the last two decades [3, 6, 10, 12–14, 19–21]. This phenomenon
is generally attributed to acid inputs in forests by rain precipi-
tation or dry deposition which lead to an exchange between H
+
ions in the throughfall and Ca, Mg or K ions on the exchange
complex. This results in a decrease in soil saturation by these
basic cations and an increased Al content which in turn prevents
sorption on the exchange complex of Mg and Ca coming from
external (dust) or internal sources (humus mineralisation, min-
eral weathering) [9]. Another cause of soil acidification is the
nitrogen cycle, particularly nitrification of ammonium from
external or internal sources [17, 22].
On the other hand, soil acidification may be considered
either as a pH decrease, accompanying lower soil base saturation,
* Corresponding author:
Present address: 4 rue de Bastogne, 54500 Vandœuvre-lès-Nancy, France.
Article published by EDP Sciences and available at or />254 M. Bonneau
or as a decrease in Acid Neutralization Capacity (ANC), that
is the difference between the sum of all the cations in soil (Ca,
Mg, K, Al, Fe, Mn in minerals, in an exchangeable form or in
the humus) and the acidic anions (SO
3
, P
2
O
5
, Cl) [22]. In very
acidic soils, it is possible that soil base saturation and pH
decreases are difficult to detect, or very low, while ANC still
progresses considerably. It was also pointed out that the soil
solution may provide a better indication of soil acidification
than base saturation [14, 18].
The evolution of the soil Ca and Mg contents can be mod-
elled from inputs (wet deposition, dry deposition, mineral
weathering) and outputs (immobilisation in biomass, drain-
age). These data are not usually very accurate, and so a direct
measurement of changes in total and exchangeable elements is
necessary. Poszwa [16] and Dambrine et al. [3] compared the
calculated and measured decrease of base saturation in the soil
of the Strengbach catchment (Vosges), and indicated that
results were similar for exchangeable calcium, but that, as far
as magnesium was concerned, the actual loss was higher than
the calculated one.
We set out to verify these phenomena using a “soil quality
observation plot” which had been set up in 1986, within the
framework of the DEFORPA Programme (Dépérissement des
forêts attribué à la pollution atmosphérique). The soil of this
observation plot was analysed in 1986 and again in 1996, and
the results were compared with a nutrient balance in the forest
ecosystem. As a result of that comparison, an acidification
process which had not yet been identified came to light.
2. MATERIALS AND METHODS
The site studied was located in plot 75 of the DONON State Forest
(Bas-Rhin, East of France, Lambert I coordinates 953770.21 N ×
99575.68 E, altitude 710 m). Mean pluviometry is about 800 mm and
annual mean temperature 7.5 °C. The spruce stand was 95 years old
at the beginning of the study in 1986, and had been planted in a former
beech stand. The soil was an acidic brown soil (Umbric Dystrochrept
according to Soil Taxonomy, or a District Cambisol according to the
W.R.B.), developed in a diluvium of Devonian volcanic rock. Soil tex-
ture was a loam, water pH ranged from 4 to 4.5, with a C.E.C. of about
11 cmol
+
·kg
–1
(measured at soil pH) in the A horizon, and 4 cmol
+
·kg
–1
in deeper soil horizons. (Ca + Mg + K)/C.E.C. ratio was 0.09 in the
A horizon, and 0.02 at a depth of 35 cm (Tab. I). The humus form was
a dysmoder [2, 11] with a 2 cm thick OL layer, an OF layer ranging
from 2 to 3 cm and an OH layer of 1 to 3 cm, depending on the location.
C/N ratio was 20.4 in the OH layer, and decreased to 17.8 in the A
horizon and 15.8 in the mineral horizons. The mineral horizons were
very rich in exchangeable aluminium as indicated by the low (Ca +
Mg + K)/C.E.C. ratio, and demonstrated by direct measurement of
exchangeable Al (Tab. I).
The soil reserve in weatherable minerals was very low; they were
present only in large (> 10 cm) unaltered blocks.
The study began in 1986. Six levels of the soil were sampled at
25 points selected from the 42 points of a 10 × 10 m systematic grid.
The following measurements ware made:
– in OL, OF, OH layers: total contents of Ca, Mg, K, C, N, S, P,
Cd, Co, Cr, Cu, Ni, Pb, Zn.
– at depth of 0–5, 8–18, 25–35 cm in the mineral soil: total con-
tents of C, N, S, Cd, Co, Cr, Ni, Pb, Zn; exchangeable Ca, Mg, K and
Al extracted using NH
4
Cl and determined by atomic absorption spec-
trometry; P
2
O
5
extracted in 2% citric acid (in the first soil analysis
(Tab. I), P
2
O
5
was determined using the Duchaufour method, double
extraction with H
2
SO
4
and OHNa) and colorimetry.
Statistical analysis of the 1986 results showed that the effect of time
between 1986 and 1996 would be described more accurately if two
groups of seven points (two blocks) containing the most homogeneous
soil properties were considered. Thus, ten years later, in 1996, the sam-
ples were only taken from 14 points, one metre from those collected
in 1986, and analysed. In addition, three replicates (triplets) were col-
lected from four sampling points to test short distance spatial variation
to be taken into account in the 1996/1986 comparison. The dry weight
of fine earth (< 2 mm) at 12 points including two replicates of three
points were also measured.
The same analyses as those used in 1986 were carried out, using
the same analytical methods, except for total elements in OL, OF and
OH for which mineralisation by combustion was replaced by acid
digestion in HNO
3
.
In order to eliminate analytical drift, all 1986 OL, OF and OH sam-
ples were re-analysed for total elements using the new HNO
3
method.
For exchangeable and bioavailable elements, all 1996 and 1986 sam-
ples were re-analysed using the same method as in 1986. For several
exchangeable or bioavailable elements in the 1986 samples, the 1986
Table I. Soil properties. Samples were taken in a soil pit at the edge of the study plot. Exchange complex was determined at soil pH. P
2
O
5
was
determined by the Duchaufour method (two successive extractions with H
2
SO
4
0.004 N and OHNa 0.01 N).
Particle size (%) Total
org. C
C/N Exchange complex
(cmol
+
·kg
–1
)
Bioav.
P
2
O
5
Clay Fine
silt
Coarse
silt
Fine
sand
Coarse
sand
% C.E.C.
at pH 7
Ca Mg K Al ‰
OH
3–0 cm
– – – – – 20.5 20.4 37.1 1.2 0.49 0.56 9.4 –
A
0–5 cm
– – – – – 7.0 17.8 21.1 0.2 0.16 0.22 7.4 –
A/B
5–20 cm
18.9 29.1 10.5 15.5 26.0 3.1 15.5 12.9 0.1 0.06 0.12 5.1 0.17
S
20–40 cm
16.3 27.6 14.6 17.3 24.2 1.8 15.8 9.2 0.1 0.02 0.07 3.7 0.36
S/C
40–75 cm
14.9 24.9 15.2 18.3 26.7 6.8 < 0.1 0.01 0.07 5 to 6 –
Article published by EDP Sciences and available at or />Humus, aluminium and chemistry of an acidic soil 255
and 1996 results were slightly different, suggesting that the chemical
composition of these samples had evolved during ten years of stockage.
This phenomenon was also mentioned by Falkengren-Grerup [8].
Table II shows the results of the 1986 and 1996 analyses of the 1986
samples. Finally, the results used for the 1986 samples in the statistical
analysis were those obtained in 1996 for total contents and those
obtained in 1986 for exchangeable and bioavailable elements.
In addition it was observed that workers operating in the second
block of seven points in 1996 had sampled a little less OH material
than those operating in the first block and in the two blocks in 1986.
In order to compare the values of OH mass obtained in 1986 and 1996
correctly, as well as the chemical composition of the A horizon
(because a little OH material was sampled with A), the weight of the
OH sampled in the second block was multiplied by 1.2 and A horizon
element contents were corrected using the following formula:
Corrected A horizon content = initial content × 1.046
– OH concentration × 0.046.
From 1993 to 1996, the precipitation was collected in open grass-
land near the study site, and throughfall in two 20 × 20 cm under can-
opy rain gauges. Drainage water was collected at a depth of 60 cm, in
zero-tension lysimeters. The element contents of the precipitation and
soil solutions made it possible to calculate input and output fluxes to
calculate the soil budget.
Needle litter in ten litter traps was collected and analysed every
third month from 1990 to 1995. Element contents in this litter were
used to calculate element immobilisation in the increasing needle bio-
mass following needle loss during “forest decline” (1984–1986).
Statistical interpretation
We considered the differences between the 1986 and 1996 results
to be significant if:
– they were significant in a two block test taking into account the
seven individual results in each block;
– they were 1.96 higher than the mean standard deviation in the
four triplets ; i.e. the interannual variation was higher than the short
distance variability recorded in 1996.
3. RESULTS
The results are given in Tables III and IV.
3.1. Mass of OL, OF and OH layers and total element
concentration
The OL layer mass decreased between 1986 and 1996, but
this variation was not significant. However the block test was
positive and the 1986–1996 decrease was not much lower than
the local variation (0.44–0.56). Thus a real decrease is possible,
and could be interpreted as a consequence of a longer needle
retention after the forest decline of 1983–1988. More needles
fell during this period, but then the trees recovered a normal
needle biomass by reducing needle fall.
The OF layer mass remained approximately unchanged, but
that of OH decreased significantly in the block test and in com-
parison with the local variation. This decrease could have been
caused by high organic matter mineralisation during the hot
summers of 1990, 1991 and 1992.
With respect to element concentration, Pb and Cr concen-
trations decreased significantly in OL, that of Pb decreased sig-
nificantly in OF (the block test was significant and the differ-
ence was only slightly lower than the standard deviation of the
triplets), certainly as a consequence of using unleaded fuel. K
increased and Cr decreased in OF, and P increased in OH.
3.2. Element concentrations in the mineral horizons
Water pH did not change in any horizon, but KCl pH
decreased in the A horizon (0–5 cm), whereas exchangeable
Mg and K increased. The increase in Mg concentration proba-
bly resulted from OH mineralisation. Ca and H decreased in the
8–18 cm layer (S horizon). KCl pH increased slightly in the
25–35 cm layer while exchangeable H decreased.
Finally it appeared that there were few, and insignificant
changes in element concentrations. Short-term soil chemical
fertility was not impaired between 1986 and 1996.
3.3. Evolution of the total quantities of K,
Ca and Mg in the soil
Exchangeable elements are the bioavailable forms for tree
nutrition, when a short period is considered. If a longer period
is considered, it is clear that total elements in the organic layers
are subjected to mineralisation and evolution into exchangea-
ble elements, and will thus be able to play an important role in
the mineral nutrition of trees in the future. We therefore calculated
the evolution of Ca, Mg and K from 1986 to 1996 considering the
sum of total forms in the organic layers and exchangeable forms
in the mineral horizons at depth of 0 to 35 cm.
The results are shown in Table V. Both total Ca and Mg
decreased considerably in the humus layers (83.9 and
115.9 kg·ha
–1
respectively in 1996, compared with 98.1 and
161.2 in 1986), whereas K decreased slightly. Exchangeable
Mg increased slightly in the mineral horizons, whereas Ca
decreased a little and K increased.
In conclusion, if we consider the sum of the humus layers
and mineral horizons, 23 kg·ha
–1
Ca and 31 kg·ha
–1
Mg were
lost from 1986 to 1996, which represented about 16% and 18%
of the total 1986 stocks respectively. The increase in the K stock
amounted to 13% in the same period.
Table II. Comparison between analytical results of the 1986 sam-
ples. Old: 1986 analyses. New: analyses repeated in 1996. Results
are expressed in cmol
+
·kg
–1
for exchangeable elements and in g·kg
–1
for bioavailable P
2
0
5
.
Element Old 1986 results New 1986 results
Exchangeable Ca 0.26 0.18
Exchangeable Mg 0.20 0.34
Exchangeable K 0.18 0.22
Exchangeable Mn 0.16 0.55
Exchangeable Fe 0.04 0.13
Exchangeable Al 7.55 6.60
Bioavailable P
2
O
5
(extracted by 2% citric acid)
0.034 0.055
Article published by EDP Sciences and available at or />256 M. Bonneau
4. DISCUSSION
How can this decrease in Ca and Mg be explained? In order
to answer that question, the quantities of Ca, Mg and K incorpo-
rated in the woody biomass and the increasing needle biomass
(as explained in the section on “mass of OL, OF, and OH lay-
ers”) from 1986 to 1996 were estimated carefully. Ca and Mg
inputs in wet and dry deposition were calculated, element con-
centrations in drainage water were measured, and element
releases from soil minerals were estimated. Finally reliable bal-
ance limits for these elements were calculated.
Precipitation and throughfall were collected and analysed as
described in the section on “materials and methods”. Dry dep-
osition was calculated, using the method of Dambrine and
Prevosto [4], to be 80% of the difference between throughfall
and precipitation in open grassland for Ca, 50% for Mg and
10% for K. Total deposition was calculated by adding dry dep-
osition and precipitation deposition, assuming that these three
elements were not directly absorbed by needles (it is known that
elements other than nitrogen are not absorbed at all or very lit-
tle).
Mineral weathering was estimated according to Ezzaïm [7]
who calculated weathering in the Beaujolais mountains on very
similar soils and rocks, but, because of difficulties in measuring
mineral surfaces, this author only gave a probable data range:
0.2–1.06 kg·ha
–1
·yr
–1
Ca, 0.3–3 kg Mg and 1.8–8 kg K.
Water drainage composition was established annually by
analysis. Drainage was estimated to be 480 mm·yr
–1
, as the dif-
ference between precipitation (800 mm) and evapotranspira-
tion, the latter being estimated following the study of Moham-
med Ahmed [15] at the Bonhomme Pass in the Vosges, which
was at a higher altitude (850 m). The warmer climate of Donon
forest compared with the Bonhomme Pass was taken into
account and evapotranspiration was estimated to be higher
(320 mm).
Element immobilisation in biomass was estimated using the
same study, but the data were increased because wood production
Table III. Significant differences in organic layers. The 1996–1986 difference is in bold type when significant in the block interpretation. The
value of 1.96 triplet standard deviation is noted only when the 1996–1986 difference in the block interpretation is significant. This value is in
bold type when lower than the absolute value of the 1996–1986 difference.
Feature 1986 1996 1986–1996
difference
Triplet standard
deviation
×1.96
Significant
change
OL
Mass kg·m
–2
1.44 1.00 – 0.44 0.56 no
Total Ca g·kg
–1
2.44 2.70 + 0.26 no
Total Mg g·kg
–1
0.31 0.40 + 0.09 0.31 no
Total K g·kg
–1
0.77 0.83 + 0.06 no
Total P 0.86 0.84 – 0.02 no
Total Pb mg·kg
–1
64.7 35.2 – 29.5 16.0 yes
Total Cd mg·kg
–1
0.38 0.33 – 0.05 no
Total Cr mg·kg
–1
2.13 1.03 – 1.10 0.71 yes
OF
Mass kg·m
–2
1.77 2.62 + 0.85 1.48 no
Total Ca g·kg
–1
1.99 1.50 – 0.49 no
Total Mg g·kg
–1
0.57 1.03 + 0.46 2.76 no
Total K g·kg
–1
0.65 1.04 + 0.39 0.25 yes
Total P 0.94 0.99 + 0.05 no
Total Pb mg·kg
–1
143 103 – 40 40.66 no
Total Cd mg·kg
–1
0.38 0.28 – 0.10 0.12 no
Total Cr mg·kg
–1
3.00 1.84 – 1.16 0.88 yes
OH
Mass kg·m
–2
7.26 4.10 – 3.16 2.60 yes
Total Ca g·kg
–1
0.43 0.49 + 0.06 no
Total Mg g·kg
–1
1.99 1.65 – 0.34 no
Total K g·kg
–1
1.33 1.63 + 0.30 0.41 no
Total P 0.94 1.12 + 0.18 0.15 yes
Total Pb mg·kg
–1
117 145 + 28 55.7 no
Total Cd mg·kg
–1
0.15 0.17 + 0.02 no
Total Cr mg·kg
–1
4.53 3.53 – 1.00 no
Article published by EDP Sciences and available at or />Humus, aluminium and chemistry of an acidic soil 257
was higher in Donon forest: 5 t·ha
–1
·yr
–1
, compared with 2.5 t
at the Bonhomme Pass.
Element immobilisation in the increasing needle biomass
was calculated on the basis of 6 t·ha
–1
of needles (dry weight)
in ten years, with an element composition corresponding to the
“stabilized element concentrations”. When young needles
develop, only part of the necessary elements come from the soil,
the rest are provided by older needles. Thus, actual uptake from
the soil corresponds to old needle element concentrations when
they have supplied elements to younger needles. The “stabi-
lized concentrations” were chosen as those of needles collected
in the litter traps: 3 g·kg
–1
Ca, and a little more for Mg and K,
as these elements could have been leached to varying extents
by rain before collection: 0.6 g·kg
–1
Mg and 2 g·kg
–1
K.
The budget which was established from these calculations
or estimations is presented in Table VI.
Table IV. Significant differences in mineral horizons. The 1996–1986 difference is in bold type when significant in the block interpretation.
The value of 1.96 triplet standard deviation is noted only when the 1996–1986 difference in the block interpretation is significant. This value is
in bold type when lower than the absolute value of the 1996-1986 difference. Exchangeable elements are expressed in cmol
+
·kg
–1
, and availa-
ble P
2
O
5
in g·kg
–1
.
Feature 1986 1996 1986–1996
difference
Triplets
Standard deviation
×1.96
Significant
change
0–5 cm
Water pH 3.9 4.1 + 0.20 0.26 no
KCl pH 3.6 3.3 – 0.30 0.15 yes
Exchangeable Ca 0.26 0.31 + 0.05 0.18 no
Exchangeable Mg 0.20 0.38 + 0.18 0.18 yes
Exchangeable K 0.18 0.32 + 0.14 0.11 yes
Exchangeable H 1.19 1.77 + 0.58 0.82 no
Exchangeable Al 7.55 7.43 – 0.12 no
Bioavailable P
(2% citric acid)
0.034 0.048 + 0.014 no
Total Pb 67.0 97.2 + 30.2 21.9 yes
Total Zn 67.3 73.8 + 13.4 7.79 yes
8–18 cm
Water pH 4.3 4.5 + 0.20 0.30 no
KCl pH 3.9 3.9 0 no
Exchangeable Ca O.16 0.10 – 0.06 0.04 yes
Exchangeable Mg 0.08 0.18 + 0.10 0.14 no
Exchangeable K 0.11 0.15 + 0.040 no
Exchangeable H 0.53 0.17 – 0.36 0.23 yes
Exchangeable Al 5.36 5.03 – 0.33 no
Bioavailable P
(2% citric acid)
0.021 0.025 + 0.004 no
25–35 cm
Water pH 4.5 4.5 0 no
KCl pH 4.1 4.2 + 0.10 0.06 yes
Exchangeable Ca 0.11 0.08 – 0.03 0.05 no
Exchangeable Mg 0.05 0.08 + 0.03 0.06 no
Exchangeable K 0.09 0.12 + 0.03 0.043 no
Exchangeable H 0.43 0.004 – 0.39 0.11 yes
Exchangeable Al 4.07 3.71 – 0.36 no
Bioavailable P
(2% citric acid)
0.019 0.025 + 0.006 no
Article published by EDP Sciences and available at or />258 M. Bonneau
This table shows that the real K increase (measured by soil
analysis and indicated in table) was within the limits of the cal-
culated budget interval. For Ca and Mg, the real losses were
much higher than the highest calculated value.
We tried to establish a balance for mineral horizons alone
(Tab. VII). Element decrease in OL, OF and OH layers was
considered to be due to the part of the mineralisation which
exceeded steady state, and theoretically able to increase
exchangeable elements in mineral horizons. Data were drawn
from Table V. A theoretical balance for mineral horizons was
calculated by adding together the elements released from all the
organic layers (i.e. the absolute value of change in humus layers)
Table V. Quantitative balance. This balance was drawn-up for the 1986–1996 period from soil analysis of total elements in the OL, OF and OH
layers and of exchangeable elements in the mineral horizons from depths between 0 and 35 cm.
Soil mass (t·ha
–1
)Ca (kg·ha
–1
) Mg (kg·ha
–1
) K (kg·ha
–1
)
1986 1996 1986 1996 1986 1996 1986 1996
OL 14.4 10.0 34.5 26.2 4.4 4.1 10.8 8.3
OF 17.7 26.2 30.4 37.9 13.8 27.2 11.0 27.4
OH 72.6 41.0 33.2 19.8 143.0 84.6 96.4 77.2
Total in the organic horizons 104.7 77.2 98.1 83.9 161.2 115.9 118.2 110.9
0–5 cm 186 194 9.7 10.6 4.5 8.2 13.1 22.0
5–8 cm 123 123 5.2 5.2 2.1 4.2 7.0 11.4
8–18 cm 385 385 12.4 7.3 3.7 8.2 16.5 22.1
18–25 cm 262 262 7.1 4.5 2.0 4.1 10.2 13.8
25–35 cm 436 436 9.6 6.7 2.6 4.3 15.3 21.1
Total in the mineral horizons 1392 1400 44.0 34.3 14.9 29.0 62.1 90.4
Total for the whole soil 142.1 118.9 176.1 144.9 180.3 203.3
1996–1986 Balance –23.2 –31.2 +23.0
Table VI. Estimation of inputs and outputs for the whole soil. Data and balance are expressed in kg·ha
–1
for ten years.
Element Outputs Inputs Theoretical balance
in the whole soil
(4) + (5) – (1) – (2) – (3)
Drainage
(1)
Immobilization in wood
(2)
Increase in the
needle biomass
(3)
Atmospheric input
(precipitation
and dry deposition)
(4)
Mineral
weathering
(5)
Probable range Probable range Mean
Ca 33 30 21 69 2 to 10 – 13 to – 5 – 9
Mg 28 6 3 15 3 to 30 – 19 to + 8 – 5.5
K 31 28 10 40 18 to 90 – 11 to + 61 + 25
Table VII. Theoretical and actual balance in mineral horizons. Data and balance are expressed in kg·ha
–1
for ten years
.
Element Theoretic balance in the whole soil
(Table VI)
Mineralisation in OL, OF,
OH, and transfer into
mineral horizons
(Tab. V)
(3)
Theoretical balance
in mineral horizons
Actual balance in
mineral horizons
Data in Table V
Probable
range (1)
Mean
(2)
Probable range
(1) + (3)
Mean
(2) + (3)
Ca – 13 to – 5 – 9 14.2 + 1.2 to + 9.2 + 5.2 – 9.7
Mg – 19 to + 8 – 5.5 45.3 + 26.3 to + 53.3 + 39.8 + 14.1
K – 11 to + 61 + 25 7.3 – 3.7 to + 68.3 + 32.3 + 23.0
Article published by EDP Sciences and available at or />Humus, aluminium and chemistry of an acidic soil 259
and the theoretical balance for the whole soil (i.e. the change
in the whole soil = change in humus layers + change in mineral
horizons).
This theoretical balance was positive to varying degrees for
Ca, Mg and K. For K, the actual balance (soil analysis) was in
the calculated interval, but, for Ca, there was a loss of 9.7 kg·ha
–1
instead of a gain of 5.2, and, for Mg, the actual gain, 14.1 kg·ha
–1
,
was much lower than the theoretical one (39.8 kg·ha
–1
). A very
likely explanation is that Mg loss in drainage water was much
higher during the 1986–1993 period than the loss measured
between 1993 and 1996, probably as a likely result of very
active mineralisation of the organic layers in the warm summers
of 1990 to 1992. This mineralisation probably occurred at the
end of the summer, when the first autumn rains wetted the soil,
but, unfortunately, drainage water was not sampled before
1993. It is also possible that all the Ca and Mg which were trans-
ferred from humus layers by mineralisation were not adsorbed
onto the mineral horizons.
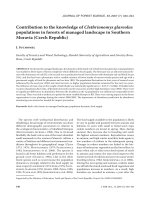
Hildebrand [9] applied the Gapon cation exchange law to
soils rich in exchangeable Al, and showed that, when the
exchange complex was very rich in exchangeable Al, it became
unable to adsorb Ca and Mg (Fig. 1).
On this basis, it was possible to explain Ca and Mg losses.
When mineralised and released into the soil solution of organic
layers, Ca and Mg were transferred into the mineral horizons,
but they could not be adsorbed onto an Al-rich exchange com-
plex, and were consequently lost in drainage water. Thus, the
stock of exchangeable Mg in mineral horizons increased by
14.1 kg·ha
–1
instead of 42.3 kg·ha
–1
. Similarly, the stock of
exchangeable Ca decreased by 9.7 kg·ha
–1
instead of increasing
by 6.7 kg·ha
–1
.
These results agree well with those of the Strengbach catch-
ment [3, 16] which also showed that the actual Mg loss was
higher than that calculated from element balance, but, at the
Donon soil experimental site, the Ca was also affected by the
same phenomenon.
These results are also in agreement with the needle nutrient
composition of the stand (N: 14.3 g·kg
–1
; P: 1.5; S: 0.92; K:
5.16; Ca: 2.36; Mg: 0.85). Concentrations of N, P, S and K were
satisfactory but concentrations in Ca and Mg were rather low.
Investigations of spruce and white fir needle composition dur-
ing dry or humid years in fertilisation experiments showed that
Mg concentration should amount to 1.3 g·kg
–1
in order to pre-
vent a dramatic decrease to 0.5–0.7 g·kg
–1
during dry years [1].
5. CONCLUSION
These results are firstly a good illustration of the fact that
acidification, in the sense of pH and base saturation decrease,
may be low, while loss of ANC is very high.
Secondly, it is clear that threats to future nutritional elements
of forest stands may not be detected if we only consider levels
of exchangeable elements at a given moment and that chemical
fertility seems stable whereas the soil is losing important quan-
tities of Ca and Mg from the organic horizons.
Thirdly, it is clear that, in very acidic soils, the loss of base
cations, namely Ca and Mg, is not only a direct consequence
of acid rain and a progressive exchange between H
+
and base
cations, but also of periods of high humus layer mineralisation
together with a high concentration of exchangeable aluminium
in the mineral horizons. The role of over-saturation of mineral
horizons by Al has been known for a long time [9]. But the role
of humus layers in the loss of nutrients seems less well docu-
mented or has been interpreted differently: being mainly attrib-
uted to soluble organic acids percolating through the soil from
the organic layers when the humus form is moder or dysmoder [5].
During high humus mineralisation periods such as warm
summers, and probably clear felling, large quantities of cations
are leached from the humus layers into mineral horizons. The
inability of roots to take up such large quantities, exceeding
growth needs, and the inability of Al-rich mineral horizons to
adsorb Ca and Mg efficiently, lead to high losses of these ele-
ments in drainage water, whereas K is increasingly retained on
the exchange complex [9].
Thus the interaction between climate, humus forms and
over-concentration of exchangeable Al in mineral horizons
seems to be a very important aspect of the biogeochemical cycles
of Mg and Ca in acidic soils, together with acid precipitation.
Deterioration of humus forms from mull into moder or dysmoder,
along with soil acidification, immobilise large quantities of
Figure 1. Effect of Al on Ca and Mg adsorption in mineral horizons.
Evolution of Gapon’s selectivity coefficients of an acidic soil,
K
G(Ca/
Al) and
K
G(Mg/Al), when saturation of Al
3+
and Fe
3+
increases
(after [9]).
Article published by EDP Sciences and available at or />260 M. Bonneau
nutrients in the humus layers. As a result, these elements are
lacking in the A horizon and in the mineral horizons where the
roots take up nutrients, and, more seriously, are subjected to
large losses when strong mineralisation of the humus, namely
the OH layer, occurs. This phenomenon is a key mechanism in
soil acidification that seems to have been underestimated until
now.
Acknowledgments: Many thanks to colleagues who helped with the
sampling: Claude Nys, Yves Lefèvre, Dominique Gelhaye and Daniel
Imbert; to Saïd Belkacem and the INRA laboratory in Arras for mineral
soil analyses, to the INRA laboratory in Bordeaux (L.E.R.M.A.V.E.)
for organic horizon analyses; to Jacques Ranger for reading, criticizing
and improving this paper and to Geraldine Rigou, Christine Young and
Aldice Nys for correcting English. The European Union, the French
Ministry for Environment, the Alsace Region and INRA contributed
financially to this work.
REFERENCES
[1] Bonneau M., Fertilisation sur résineux adultes (Picea abies Karst.
et Abies alba Mill.) dans les Vosges : composition foliaire en rela-
tion avec la défoliation et le jaunissement, Ann. Sci. For. 50 (1993)
159–175.
[2] Brun J.J., Étude de quelques humus forestiers aérés acides de l’Est
de la France. Critères analytiques, classification morphologique,
Thèse de Doctorat 3
e
cycle, Université de Nancy I, 1988.
[3] Dambrine E., Pollier B., Poszwa A., Ranger J., Probst A., Viville
D., Biron P., Granier A., Wieder R.K. (Eds.), Evidence of current
soil acidification in spruce stands in the Vosges mountains – North
eastern France, Water, Air Soil Pollut. 105 (1998) 43–52.
[4] Dambrine E., Prevosto B., Flux des éléments minéraux dans un éco-
système forestier d’altitude soumis à la pollution atmosphérique,
relation avec le dépérissement. Rapport scientifique DEFORPA,
1988, Nancy.
[5] Duchaufour P., Introduction à la Science du sol. Sol, végétation,
environnement, Dunod, Paris, 2001.
[6] Dupouey J.L., Thimonier A., Lefèvre Y., Le Tacon F., Bonneau M.,
Dambrine E., Poszwa A., Landmann G., Désaturation et enrichisse-
ment en azote des sols forestiers du Nord-Est de la France au cours
des dernières décennies, Rev. For. Fr. L (1988) 391–402.
[7] Ezzaïm A., Intérêt de la mesure du flux d’éléments issu de l’altéra-
tion des minéraux du sol dans le calcul des bilans minéraux d’un
écosystème forestier. Le cas des plantations de Douglas dans le
Beaujolais (France), Thèse de Doctorat, Sciences de la Terre, Uni-
versité Henri Poincaré, 1997, Nancy-I.
[8] Falkengreen-Grerup U., Effects of long-term storage on some
chemical properties of forest soil samples, Ecol. Bull. 44 (1995)
129–132.
[9] Hildebrand E.E., Zustand und Entwicklung der Austauscheigens-
chaften von Mineralböden an Standorten mit erkrankten Waldbes-
tand, FowCbl. 105 (1986) 60–76.
[10] Hovman M.F., Bille-Hansen J., Sheppard L.J., Cape J.N., Atmos-
pheric input to Danish spruce forests and effects on soil acidifica-
tion and forest growth based on 12 years measurements, Water Air
Soil Pollut. 106 (1999) 75–88.
[11] Jabiol B., Brêthes A., Ponge J.F., Toutain F., Brun J.J., L’humus
sous toutes ses formes, ENGREF, Nancy, 1995.
[12] Kreutzer K., Beier C., Bredemeier M., Planck K., Cummings T.,
Farrell E.P., Lammersdorf N., Rasmussen L., Rothe A., Weiss T.,
Xu Y.J., De Visser P.H., Wright R.F. (Eds.), Atmospheric deposi-
tion and soil acidification in five coniferous forest ecosystems: a
comparison of the control plots of the EXMAN sites, For. Ecol.
Manage. 101 (1998) 125–142.
[13] Lefèvre Y., Essai de mise en évidence d'une évolution récente du
pH et de la teneur en cations basiques de quelques sols forestiers
des Vosges (nord-est de la France), Ann. Sci. For. 54 (1997) 483–
492.
[14] Lindstrom U.S., Nyberg L., Danielsson R., Andersson M., van
Hees P.A.W., Forest soil monitoring on the regional scale, Warm-
land, Sweden, Ambio 27 (1998) 551–556.
[15] Mohammed Ahmed D., Rôle du facteur édaphique dans le fonc-
tionnement bio-géochimique et l’état de santé de deux pessières
vosgiennes. Effet d’un amendement calco-magnésien, Thèse de
Doctorat, Université Henri Poincaré, Nancy I, 1992.
[16] Poszwa A., Dambrine E., Pollier B., Fichter J., Mise en évidence
directe de l’acidification d’un sol forstier à Aubure (bassin versant
du Strengbach, Haut-Rhin, France, Écologie 29 (1998) 407–410.
[17] Raubuch M., Beese F., Bolger T., Andersson J.M., Berg M.P.,
Couteaux M.M., Ineson P., McCarthy F., Splatt P., Verhoef H.A.,
Willison T., Acidifying processes and acid-base reaction in forest
soils reciprocally transplanted along European transect with
increasing pollution, Biogeochemistry 41 (1998) 71–88.
[18] Ranger J., Augusto L., Impact of tree species on soil solutions in
acidic conditions, Ann. For. Sci. 58 (2001) 47–58.
[19] Raulund-Rasmussen K., Larsen J.B., Causes and effects of soil aci-
dification in forests, with particular reference to the effects of air
pollution and silvicultural practices, Dansk Skovbrugs Tidsskrift
75 (1990) 1–41.
[20] Tamm C.O., Acidification research in Sweden – national and inter-
national perspectives, Ecol. Bull. 44 (1995) 11–16.
[21] Tamm C.O., Hallbäcken L., Changes in soil acidity in two forest
areas with different acid deposition 1920 s to 1980 s, Ambio 17
(1988) 56–61.
[22] Van Bremen N., Driscoll C.T., Mulder J., Internal deposition and
internal proton sources in acidification of soils and waters, Nature
37 (1984) 599–604.
Article published by EDP Sciences and available at or />