Báo cáo lâm nghiệp: "Predicting balsam fir growth reduction caused by spruce budworm using large-scale historical records of defoliation" potx
Bạn đang xem bản rút gọn của tài liệu. Xem và tải ngay bản đầy đủ của tài liệu tại đây (411.77 KB, 7 trang )
261
Ann. For. Sci. 62 (2005) 261–267
© INRA, EDP Sciences, 2005
DOI: 10.1051/forest:2005018
Original article
Predicting balsam fir growth reduction caused by spruce budworm
using large-scale historical records of defoliation
David POTHIER
a
*, Daniel MAILLY
b
, Stéphane TREMBLAY
b
a
Département des Sciences du bois et de la forêt, Université Laval, Sainte-Foy, Québec, G1K 7P4, Canada
b
Ministère des Ressources naturelles et de la faune du Québec, Direction de la recherche forestière,
2700 rue Einstein, Sainte-Foy, Québec, G1P 3W8, Canada
(Received 20 May 2004; accepted 31 August 2004)
Abstract – To predict the reduction in growth of balsam fir (Abies balsamea (L.) Mill.) subjected to spruce budworm (Choristoneura
fumiferana (Clem.)) epidemics, tree-ring chronologies of dominant trees were related to historical records of defoliation collected in the
province of Quebec, Canada. These trees were sampled on 136 sites and were harvested for stem analyses that allowed us to calculate indexed
radial growth and tree volume increment for a period (1965–1995) that covers the last insect outbreak. Defoliation variables explained 36% and
23% of the annual changes in ring width index and annual volume increment index, respectively. Defoliation that dated back by as much as six
years affected current-year growth whereas current-year defoliation had limited impact. Several severe annual defoliation events reduced
volume growth of dominant balsam fir by 50% over a 10-year period. These results can help predict future growth reduction among dominant
balsam fir trees subjected to different scenarios of spruce budworm defoliation over broad areas.
balsam fir / spruce budworm / defoliation class / growth reduction / stem analysis
Résumé – Prédiction de la réduction de croissance du sapin baumier causée par la tordeuse des bourgeons de l’épinette en utilisant des
relevés historiques de défoliation recueillis à grande échelle. Afin de prédire les pertes de croissance de sapins baumiers (Abies balsamea
(L.) Mill.) soumis à des épidémies de tordeuse des bourgeons de l’épinette (Choristoneura fumiferana (Clem.)), les séries chronologiques de
cernes annuels d’arbres dominants ont été reliées à des relevés historiques de défoliation recueillis dans la province de Québec, Canada. Ces
arbres, échantillonnés sur 136 stations, ont été abattus pour faire des analyses de tige qui ont permis de calculer des indices de croissance radiale
et d’accroissements en volume pour une période (1965–1995) couvrant la dernière épidémie de cet insecte. Les variables de défoliation
expliquent 36 % et 23 % de la variation interannuelle de l’indice de croissance radiale et de l’indice d’accroissement annuel en volume,
respectivement. Les défoliations s’étant produites jusqu’à six ans auparavant ont affecté la croissance de l’année courante alors que les
défoliations de l’année courante n’ont eu qu’un effet limité. Des défoliations sévères répétées pendant plusieurs années ont diminué de 50 % la
croissance en volume des sapins baumiers dominants pendant une période de 10 ans. Ces résultats peuvent contribuer à prédire la future
réduction de croissance de sapins baumiers dominants soumis à différents scénarios de défoliation par la tordeuse des bourgeons de l’épinette
pour de grands territoires.
sapin baumier / tordeuse des bourgeons de l’épinette / classe de défoliation / réduction de la croissance / analyse de tige
1. INTRODUCTION
In the eastern coniferous forests of Canada, spruce budworm
(Choristoneura fumiferana (Clem.)) causes large periodic tim-
ber losses through extensive tree mortality and growth reduc-
tion [2–5, 7, 12]. Its preferred host is balsam fir (Abies balsamea
(L.) Mill.) whereas less significant defoliation can also be
observed on white spruce (Picea glauca (Moench) Voss.), red
spruce (P. rubens Sarg.) and black spruce (P. mariana (Mill.)
B.S.P.). A recent historical study based on tree-ring analyses
have shown that the frequency of spruce budworm outbreaks
has remained quite stable over the last four centuries [9], pre-
sumably because of the continuous abundance of balsam fir
stands [8, 24, 25]. Since fir-dominated stands are still abundant
and are expected to remain so into the future, sustained man-
agement of these forests must consider the impact of future
insect defoliation by integrating estimation of wood losses in
volume prediction models.
Balsam fir volume growth can be reduced by as much as 50%
at the end of a 10-year period from spruce budworm defoliation
[2, 19]. However, when consecutive events of defoliation occur
over many years, wood volume lost to mortality becomes
increasingly significant and the relative contribution of growth
reduction to total volume losses decreases accordingly [2].
* Corresponding author:
Article published by EDP Sciences and available at or />262 D. Pothier et al.
Mortality attributable to spruce budworm generally begins
after 4–5 years of moderate to severe defoliation [5, 18, 21] but
seems to be highly variable from region to region and even from
stand to stand within a region [12, 18]. This spatial variation
of mortality can be explained by differences in stand maturity
[12, 19], regional defoliation pattern [14] and/or species com-
position at the stand level and at the landscape level [6, 26, 30].
Even though growth reduction of live trees at the end of a severe
outbreak could be less extensive in comparison to mortality, it
nevertheless remains a significant component of volume losses
and thus needs to be quantified. Moreover, defoliation-induced
mortality may be preceded by growth reductions from which
patterns of change, as predicted by yearly defoliation, could
potentially help estimate volumes lost to mortality.
Regression models relating radial or volume growth to defo-
liation or larval density have been fitted for different insect and
host species (e.g. [1, 3, 11, 23, 29]). However, these models
have been calibrated with data often collected on restricted
areas and/or over relatively short periods of time that limit their
use in sustained yield calculations applied to large territories.
On the scale of the province of Quebec, Gray et al. [14] ana-
lyzed historical records of defoliation by spruce budworm and
observed numerous spatial and temporal patterns that differed
in their overall impact. These historical records of defoliation
were developed from terrestrial and aerial surveys carried out
annually since 1968 and thus represent a long-term and large-
scale source of data. Despite the relative imprecision of these
surveys at the plot or tree level, they present a valuable potential
for incorporating volume losses into sustained yield calculations
since they cover a complete cycle of spruce budworm outbreak
over a very large territory. Growth loss predictions stemming
from these historical records could thus be used to forecast the
effect of different potential scenarios of spruce budworm defo-
liation. Moreover, such predictions can help update information
from past inventories that are required as input by a sustained
yield model when defoliation occurred between the time of
inventory and the starting year of calculations.
Therefore, the general objective of this study is to test the
predictive capacity of the historical records of defoliation to
explain the growth pattern of individual balsam fir trees as
derived from stem analyses. The related specific objectives are
to: (1) isolate the respective impact of two classes of defoliation
level on diameter and volume growths; (2) determine the spe-
cific effects of past- and current-year defoliation on growth of
balsam fir; and (3) quantify volume losses of individual trees
for incorporation into various potential scenarios involving
spruce budworm defoliation.
2. MATERIALS AND METHODS
2.1. Sampled stands
The stands sampled for this study were selected from a network of
permanent sample plots (PSPs) established by the Ministère des Res-
sources naturelles et de la faune du Québec beginning in 1970. PSP
selection was based on several criteria. First, a stand composition cri-
terion was applied to limit the scope of this study to balsam fir stands,
which were defined as stands composed of at least 50% of merchant-
able basal area in balsam fir. Second, since the most recent spruce bud-
worm outbreak began during the 1970s, we selected PSPs that were
established before 1980 wherever possible. The stand composition cri-
terion was applied to the first inventory that was generally performed
at the beginning of or during the outbreak. This criterion was not
applied to later inventories of PSPs, even if mortality caused by insect
defoliation decreased the fir proportion of some stands. Third, we
avoided PSPs that were located at more than 800 m from an accessible
road so as to facilitate transportation of stem analysis materials.
Fourth, we tried to distribute the PSPs uniformly across the natural
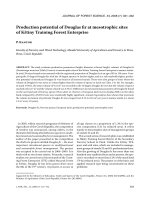
range of balsam fir stands in the province of Quebec. The application
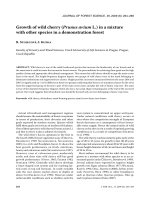
of these criteria resulted in the selection of 136 PSPs whose locations
are illustrated in Figure 1, whereas their main characteristics are sum-
marized in Table I.
2.2. Sampling procedure
The selected PSPs were located and inventoried again during the
snow-free periods between 1998 and 2002. The inventory consisted
in measuring the diameter at breast height (± 1 mm) of each tree larger
than 9.0 cm within the 400 m
2
circular plot and in measuring the height
of three dominant balsam fir trees (± 0.1 m). According to the meas-
ured diameter of the four largest balsam fir trees per plot (i.e. 100 larg-
est fir trees/ha), two to three dominant fir trees were then selected in
the vicinity of the plot at a distance of at least 25 m. These trees were
harvested and sample discs (3-cm thick) were cut at 0.15, 0.60, 1.00,
1.30 and 2.00 m, and then at each meter along the main stem. These
discs were transported to the laboratory, where they were sanded (grit
# 400), measured and digitized for stem analyses.
2.3. Tree-ring analyses
For each fir selected for stem analysis (n = 363), the disc sampled
at breast height (1.3 m) was used to analyze tree-ring series. At this
height, these discs were composed of at least 50 annual growth rings.
Table I. Characteristics of the 136 sampled balsam fir stands at the time of the last inventory (1998–2002).
Mean Standard dev. Minimum Maximum
dbh (cm) 16.2 2.6 8.8 25.8
Dominant height (m) 15.7 2.7 8.4 22.2
Age 75 21 34 159
SI (m) 13.8 3.6 6.0 24.8
N
m
1310 533 100 2600
G
m
(m
2
/ha) 28.3 9.1 0.6 61.2
dbh is the mean diameter at breast height (1.3 m above ground level) of the plot; dominant height is the average height of the three largest trees per plot;
age is the average number of rings counted on discs sampled at 15 cm above ground level for three trees per plot; SI is site index at a reference age of
50 years; N
m
is the number of merchantable trees per hectare; and G
m
is the merchantable basal area per hectare.
Article published by EDP Sciences and available at or />Growth reduction of defoliated balsam fir 263
Four radii of each sampled disc were digitized: the first radius was
determined at 22.5° (clockwise) of the largest disc diameter and the
three other radii were located at 90°, 180° and 270° of the first. Dating
of each ring series was done using all the discs sampled for each tree.
First, very large or very narrow rings were pointed on discs sampled
in the tree bole since missing rings rarely occur in this part of the tree.
Second, these diagnostic rings were identified on discs sampled lower
down the tree and their dating allowed us to detect missing rings. The
dating of all the discs of the same tree was then checked with
COFECHA [15]. The dating of diagnostic rings was also checked
between trees located on the same site, but not between sites because
different diagnostic rings can likely be pointed out in such broad sam-
pling area (Fig. 1). Corresponding ring widths of the four radii were
then averaged to produce tree-ring series. Because trees sampled at
each site had similar age, height and crown class, their ring width series
were averaged to produce a single ring width chronology for each site.
The presence or absence of suppression at the juvenile stage and suc-
cessive spruce budworm outbreaks of varying intensities often obscure
the typical ring width decrease that is observable over time. It thus
proved difficult to select a fitting model so as to eliminate long term
growth trends. Because shorter-term growth trends were easier to
determine, we only analyzed the 1965–1995 period that entirely
includes the last insect outbreak. This ring width chronology was then
standardized using a simple linear regression model in order to retain
low-frequency variations associated with insect defoliation while
removing longer-term growth trend due to ageing. Following Fritts
[13], each ring-width value was then divided by the value of the cor-
responding fitted line for that year, producing series of ring width indices.
2.4. Height and volume reconstruction
The 11 to 26 discs taken on each sample tree allowed us to recon-
struct their height and volume development according to standard pro-
cedures for stem analyses [10]. The height of the trees at each year was
determined by assuming that the height growth between two sections
is linear. The site index (height at 50 years) was estimated using the
height reconstruction of each tree after a correction was applied to
eliminate the effect of suppressed growth at the juvenile stage. This
correction consisted of determining the number of years of suppressed
growth and then applying the linear height growth of the subsequent
years to the suppression period. Suppressed growth was defined as the
very small height growth (usually less than 5 cm/year) occurring when
trees were shorter than 3 m and that was followed by a relatively long
period of normal height growth (generally more than 20 cm/year). The
total tree volume of each tree was estimated using Smalian’s formula [16].
2.5. Defoliation record
Balsam fir ring width and volume increment chronologies were
related to insect defoliation records estimated from aerial surveys
made annually by the same team of observers. As described by Gray
et al. [14], these defoliation surveys were made by the Ministère des
Ressources naturelles et de la faune du Québec for the entire balsam
fir range of the province of Quebec. These surveys consisted of parallel
(south–north) flight lines, 5–10 km apart, at an altitude of 180–250 m.
Cells of 5 minutes (latitude) by 5 minutes (longitude) were then formed
and identified by the coordinates of their centers. An average level of
tree defoliation was assigned to each of these cells, which averaged
58 km
2
in size. The tree defoliation codes were: 0, no observable defo-
liation; 1, light defoliation (< 35%); and 2, moderate to severe defo-
liation (35%). In the figures, however, light and moderate to severe
defoliations were set at 25% and 50%, respectively. Even though these
defoliation classes seem rather broad, the defoliation level separating
these two classes correspond to a critical value below which survival
rates is quite stable [12]. The surveys were conducted from late June
in the southwest of the province to early August in the northeast
according to regional climate and tree phenology.
Figure 1. Location of the 136 permanent sample plots near which dominant balsam fir trees were cut for stem analyses.
Article published by EDP Sciences and available at or />264 D. Pothier et al.
The geographical information of each cell was used to assign a his-
torical defoliation record to each site where balsam fir was sampled
for stem analysis according to the known latitude and longitude of
adjacent permanent sample plots. A database was then formed to relate
tree annual growth indices to defoliation of the current year as well as
of the previous 10 years of defoliation. Moreover, for each year of
defoliation, two variables were created to distinguish the impact of
light defoliation from that of moderate to severe defoliation.
2.6. Radial and volume increment losses
Radial and volume increment losses were assessed on the basis of
standardized ring width and periodic annual increment in volume,
respectively, in order to eliminate the effect of tree ageing and initial
tree size on growth loss estimations. Since we tried to evaluate growth
losses due to insect defoliation only, we used a regression model relat-
ing ring width or volume increment indices to the defoliation charac-
teristics of each plot. Growth losses were estimated by subtracting the
predicted growth during the outbreak from the potential growth during
the same years. Predicted growth was computed as the estimates of
the entire model (Tab. II) for a given number of years, and potential
growth was calculated as the summation of the positive terms of the
model. These growth losses were expressed as percentages of the ref-
erence level. To compute losses of tree volume in dm
3
, we applied the
above % growth losses to the annual increment in volume inferred
from stem analyses.
2.7. Statistical analyses
The modelling of ring width and volume increment indices as a
function of defoliation of the current and the past 10 years was per-
formed using the MIXED procedure of the SAS system that calculates
the parameters of a multiple linear regression model. The time series
that characterized each tree-ring chronology were taken into account
by using an autoregressive covariance structure. This technique was
used to remove the correlation between successive ring widths of the
same individual and allowed us to calculate unbiased statistics associated
with the regression model. Since our objectives aimed at assessing the
impact of the two defoliation classes occurring at different periods in
the past, we first submitted all the defoliation and site variables to the
model. Then, to determine the variables that played a significant role
in explaining the variation of ring width index and annual volume
increment index, we successively eliminated those that were not sig-
nificant (p > 0.05), beginning with the largest p-value.
3. RESULTS AND DISCUSSION
3.1. Model fitting
The statistical analyses applied to the tree-ring chronologies
resulted in fitted multiple linear regressions that related ring
width index to defoliation variables but not to site variables
such as site index (Tab. II). Defoliation variables explained
36% of the interannual changes in ring width index of dominant
balsam fir trees that survived the outbreak (Tab. II). Although
this R
2
value can appear modest, we believe rather that it con-
stitutes an important contribution to the explanation of the var-
iation of ring width index considering the coarse defoliation
estimates (three categories) and the scaling difference between
defoliation assessments (~ 58 km
2
) and projected tree area
(~ 10 m
2
). Moreover, other sources of interannual variation of
ring width index are not included in the model. Past- and cur-
rent-year temperature and precipitation are examples of such
variables that can explain a large part of the interannual varia-
tion of ring width index [13]. Considering that the model was
fitted using 136 ring width series covering a large range of defo-
liation patterns and that the residuals are well distributed (not
shown), it appears that the relationship is quite robust and reliable.
Table II. Significant (p < 0.05) parameter values and related statistics of the multiple linear regression models relating ring width index and
annual volume increment index of balsam fir to defoliation classes.
RWI AVII
Intercept 1.0085 1.0198
NbS 0.0167 (0.0418) 0.0160 (0.0238)
S
n
– –0.0267 (0.0005)
L
n–1
–0.0234 (0.0006) –
S
n–1
–0.1490 (0.0868) –0.1593 (0.0531)
L
n–2
–0.0244 (0.0001) –
S
n–2
–0.1739 (0.1488) –0.1715 (0.0999)
L
n–3
–0.0324 (0.0005) –
S
n–3
–0.1330 (0.0662) –0.1198 (0.0361)
L
n–4
–0.0306 (0.0005) –
S
n–4
–0.0760 (0.0115) –0.0667 (0.0072)
S
n–5
– –0.0198 (0.0022)
S
n–6
– –0.0222 (0.0031)
RMSE 0.2357 0.3406
R
2
0.3568 0.2259
These models have the form: Y = b
0
+ b
1
NbS + b
2
S
n
+ … + b
i
S
n–6
where Y is RWI (ring width index) or AVII (annual volume increment index), b
0
is
the intercept, NbS is the number of years of moderate to severe defoliation, and b
1
to b
i
are the parameters to estimate. The names of the other variables
refer to defoliation codes that are composed of the defoliation level (L = light and S = moderate to severe) and the year of defoliation where n
corresponds to the current year of defoliation. RMSE is the root mean square of error and R
2
is the coefficient of determination. Numbers in
parentheses are partial R
2
that correspond to the additional amount of variation explained by the introduction of each new variable in the model.
Article published by EDP Sciences and available at or />Growth reduction of defoliated balsam fir 265
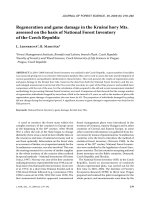
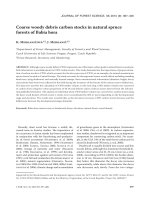
In Figure 2, the model was adjusted to four different defo-
liation patterns that correspond to the four classes of defoliation
impact proposed by Gray et al. [14]. Over the duration of the
outbreak, predicted values followed the observed variations in
ring width index, especially when defoliation caused important
drops of radial increment (Fig. 2). Incidentally, the model
includes a variable (NbS) that increases the magnitude of these
drops with increasing number of years during which moderate
to severe defoliation occurs (Tab. II). Comparisons of param-
eter values within each year of past defoliation indicates that
severe defoliation has 2 to 7 times more impact on ring
width index than light defoliation (Tab. II). Baskerville and
Kleinschmidt [3] also observed this minor effect of light defo-
liation events on growth losses even when they are repeated
over many consecutive years. It would appear that the carbon
fixed by the foliage that remains after light defoliation is suf-
ficient to maintain normal diameter growth at breast height. In
the tree bole and in the root system, however, light defoliation
could produce a negative impact on ring width [17].
In our predictive model, the past four years of defoliation
negatively affected ring width index measured at breast height
whereas current-year defoliation had no significant effect (Tab. II).
Many authors have previously observed a lag of one or more
years between defoliation and tree growth response for a variety
of insects and host species [1, 3, 5, 7, 23]. This lag response
can be explained by the relatively low larval population gen-
erally occurring at the beginning of an outbreak, which results
in the consumption of only current-year needles [19] and, con-
sequently, in a limited impact on current-year diameter growth.
3.2. Growth losses
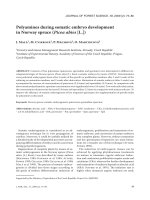
Using the parameters of the ring width index model for the
1970–1990 spruce budworm outbreak (Tab. II), we calculated
the losses in radial increment at breast height resulting from one
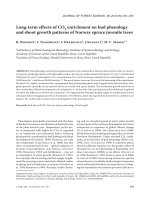
year of defoliation (Fig. 3A). The largest impact was produced
two years after defoliation, although significant growth losses
were also observed in the first and the third year after defoliation
(Fig. 3A). By the fifth year following defoliation, no observable
Figure 2. Observed (solid line) and predicted (dotted line) ring width
index for dominant balsam fir subjected to the four levels of defolia-
tion impact proposed by Gray et al. [14]. Annual defoliation is repre-
sented by vertical bars. These dominant balsam fir trees were located
near four randomly selected plots among the 136 sampled plots: plot
048 (negligible impact), plot 055 (low impact), plot 090 (moderate
impact), and plot 031 (severe impact). Predicted values were calcu-
lated according to the model and the parameters presented in Table II.
Figure 3. Predicted radial increment loss (solid line) of a dominant
balsam fir that survived the outbreak and that was subjected to one
(A) and seven (B) consecutive years of moderate to severe defoliation
(bars). Predicted radial increment losses were calculated as the ratio
between the predictive value of the model presented in Table II when
all the parameters are used and that of the same model when only the
positive parameters are used.
Article published by EDP Sciences and available at or />266 D. Pothier et al.
radial growth reduction was predicted, and the dominant fir
trees have likely completed their foliage recovery, which seems
to be favoured by their ability to produce epicormic shoots [27, 28].
Regression parameters of the 1970–1990 outbreak were also
used to simulate the radial increment losses produced by many
years of consecutive defoliation events (Fig. 3B). Predicted
growth losses increased almost linearly during the first four
years after the first defoliation and then reached a plateau at
around 50% of radial growth reduction (Fig. 3B). This plateau
possibly corresponds to the maximum growth loss that a dom-
inant balsam fir can suffer without deteriorating in mortality.
For long periods of moderate to severe defoliation, diameter
growth of less vigorous trees likely continues to decrease
beyond the plateau value of 50%. This plateau could thus indi-
cate a threshold over which tree mortality induced by spruce
budworm defoliation begins. Accordingly, many authors have
reported that trees usually start to die after four to five years of severe
defoliation [1, 5, 7, 18, 21]. Therefore, the pattern of radial growth
reduction, as predicted from defoliation scenarios, could be
useful to empirically forecast volume loss from mortality.
The procedure used to standardize ring width chronological
series was also applied to the annual volume increment series
derived from stem analyses. The result of this standardization,
the annual volume increment index, was then correlated with
defoliation variables (Tab. II). Defoliation variables that sig-
nificantly explained annual volume increment index were all
related to moderate to severe defoliation. Hence, light defolia-
tion seemed to have negligible impact on volume growth of
dominant trees. Moreover, current-year volume increment was
affected by moderate to severe defoliation that occurred the
same year and that dated back as long as six years (Tab. II).
These results differ from those obtained with ring width index
measured at breast height which was not affected by current-
year defoliation as well as by defoliation occurring prior to four
years ago. These differences could be explained by varying
diameter growth responses along the stem [17], all of which
have been integrated into the calculation of the annual volume
increment index.
From the relationship between annual volume increment
index and defoliation variables (Tab. II), volume growth
changes were calculated for four defoliation scenarios (Fig. 4)
that correspond to the four classes of defoliation impact pro-
posed by Gray et al. [14]. For a period of 30 years, a time
roughly equivalent to the return interval of the recent spruce
budworm outbreak [9], these volume losses were estimated at
2, 8, 15 and 24% for the negligible, light, moderate, and severe
classes of defoliation impact, respectively. Similar results
have been derived from a process-based model developed by
Baskerville and Kleinschmidt [3] for balsam fir stands sub-
jected to defoliation by spruce budworm in north-central Maine
and New Brunswick. Other authors have reported growth
losses of approximately 50% when the impact of six years or
more of severe defoliation was averaged over a 10-year period
[2, 19, 20]. These growth losses correspond to the moderate to
severe defoliation scenarios calculated with the equation of
Table II for a period of 10 years. Therefore, the estimation of
growth losses on the basis of the relationship between annual
volume increment index and defoliation variables seems reli-
able and confirms that such factors can contribute substantially
to the total stand volume losses (mortality + growth loss).
4. CONCLUSION
Even though they are rough estimates, the defoliation classes
stemming from large-scale aerial surveys explained an impor-
tant part of the growth variation of dominant balsam fir trees
affected by the last spruce budworm outbreak. Thus, even at
this point, this defoliation dataset offers two main advantages.
First, it can be used to work up realistic scenarios of future
spruce budworm defoliation (e.g. [14]) given that the abun-
dance, distribution and vulnerability of host species will be similar
to those during the last outbreak. Second, based on the relation-
ships developed in the present study, it is possible to estimate
the growth losses of dominant balsam fir trees that survived the
outbreak. Further, these growth losses could help calibrate a
model that would predict future yield of balsam fir stands sub-
jected to different scenarios of spruce budworm defoliation
(e.g. [22]). Such a model, together with realistic defoliation sce-
narios, are needed to improve sustained yield calculations that
determine the annual allowable cut over periods of time that can
cover two or three epidemic cycles. In addition to growth
losses, a balsam fir growth and yield model must take into
account volume lost to mortality. The next step in developing
such a model will thus consist of estimating volume losses due
to mortality for different spruce budworm defoliation patterns
using permanent sample plots that cover the natural range of
balsam fir in Quebec.
Acknowledgements: We thank Luc Duchesne, Carl Lemieux, François
Lacombe, Gilles Audy, Simon Pouliot, and many summer students for
their help in the field and laboratory. We are indebted to the Direction
de la conservation des forêts and the Direction des inventaires fores-
tiers of the Ministère des Ressources naturelles et de la faune du
Québec for providing us the defoliation and the PSP datasets used in
this study. We also thank Jean Noël for drawing the map in Figure 1
and Bruno Boulet, Donald Kellough and two anonymous reviewers
for helpful comments on the manuscript.
Figure 4. Predicted volume changes over time of a hypothetical domi-
nant balsam fir that was never defoliated (U) and that was subjected
to the four classes of defoliation impact following different patterns
of annual defoliation that were proposed by Gray et al. [14]: negligible
(N), low (L), moderate (M), and severe (S). Volume increment losses
were calculated as the ratio between the predictive value of the model
presented in Table II when all the parameters are used and that of the
same model when only the positive parameters are used.
Article published by EDP Sciences and available at or />Growth reduction of defoliated balsam fir 267
REFERENCES
[1] Alfaro R.I., Van Sickle G.A., Thomson A.J., Wegwitz E., Tree
mortality and radial growth losses caused by the western spruce
budworm in a Douglas-fir stand in British Columbia, Can. J. For.
Res. 12 (1982) 780–787.
[2] Archambault L., Beaulieu J., Réduction de croissance en volume
occasionnée au sapin baumier, suite à la défoliation par la tordeuse
des bourgeons de l’épinette, For. Chron. 61 (1985) 10–13.
[3] Baskerville G., Kleinschmidt S., A dynamic model of growth in
defoliated fir stands, Can. J. For. Res. 11 (1981) 206–214.
[4] Beaulieu J., Hardy Y.J., Mortalité du sapin baumier défolié par la
tordeuse des bourgeons de l’épinette dans la région de la Gatineau
au Québec, For. Chron. 58 (1982) 213–221.
[5] Belyea, R.M., Death and deterioration of balsam fir weakened by
spruce budworm defoliation in Ontario. Part II. An assessment of
the role of associated insect species in the death of severely weake-
ned trees, J. For. 50 (1952) 729–738.
[6] Bergeron Y., Leduc A., Morin H., Joyal C., Balsam fir mortality
following the last spruce budworm outbreak in northwestern Que-
bec, Can. J. For. Res. 25 (1995) 1375–1384.
[7] Blais J.R., Effects of defoliation by spruce budworm (Choristo-
neura fumiferana Clem.) on radial growth at breast height of bal-
sam fir (Abies balsamea (L.) Mill.) and white spruce (Picea glauca
(Moench) Voss.), For. Chron. 34 (1958) 39–47.
[8] Blais J.R., Trends in the frequency, extent, and severity of spruce
budworm outbreaks in eastern Canada, Can. J. For. Res. 13 (1983)
539–547.
[9] Boulanger Y., Arseneault D., Spruce budworm outbreaks in eastern
Quebec over the last 450 years, Can. J. For. Res. 34 (2004) 1035–
1043.
[10] Carmean W.H., Site index curves for upland oaks in the central sta-
tes, For. Sci. 18 (1972) 102–120.
[11] Dobesberger E.J., Stochastic simulation of growth loss in thinned
balsam fir stands defoliated by the spruce budworm in Newfoun-
dland, Can. J. For. Res. 28 (1998) 703–710.
[12] Erdle T.A., MacLean D.A., Stand growth model calibration for use
in forest pest impact assessment, For. Chron. 75 (1999) 141–152.
[13] Fritts H.C., Tree rings and climate, Academic Press, New York,
1976.
[14] Gray D.R., Régnière J., Boulet B., Analysis and use of historical
patterns of spruce budworm defoliation to forecast outbreak pat-
terns in Quebec, For. Ecol. Manage. 127 (2000) 217–231.
[15] Holmes R.L., Computer-assisted quality control in tree-ring dating
and measurement, Tree-ring Bull. 44 (1983) 69–75.
[16] Husch B., Miller C.I., Beers T.W., Forest mensuration, 3rd ed.,
Krieger Publishing Company, Melbourne, USA, 1993.
[17] Krause C., Morin H., Changes in radial increment in stems and
roots of balsam fir [Abies balsamea (L.) Mill.] after defoliation by
spruce budworm, For. Chron. 71 (1995) 747–754.
[18] MacLean D.A., Vulnerability of fir-spruce stands during uncontrol-
led spruce budworm outbreaks: a review and discussion, For.
Chron. 56 (1980) 213–221.
[19] MacLean D.A., Effects of spruce budworm outbreaks on the pro-
ductivity and stability of balsam fir forests, For. Chron. 60 (1984)
273–279.
[20] MacLean D.A., Hunt, T.L., Eveleigh E.S., Morgan M.G., The rela-
tion of balsam fir volume increment to cumulative spruce budworm
defoliation, For. Chron. 72 (1996) 533–540.
[21] MacLean D.A., Piene H., Spatial and temporal patterns of balsam
fir mortality in spaced and unspaced stands caused by spruce bud-
worm defoliation, Can. J. For. Res. 25 (1995) 902–911.
[22] MacLean D.A., Erdle T.A., MacKinnon W.E., Porter K.B., Beaton
K.P., Cormier G., Morehouse S., Budd M., The spruce budworm
decision support system: forest protection planning to sustain long-
term wood supply, Can. J. For. Res. 31 (2001) 1742–1757.
[23] Mason R.R., Wickman B.E., Paul H.G., Radial growth response of
Douglas-fir and grand fir to larval densities of the Douglas-fir tus-
sock moth and the western spruce budworm, For. Sci. 43 (1997)
197–205.
[24] Morin H., Analyse dendroécologique d’une sapinière issue d’un
chablis dans la zone boréale, Québec, Can. J. For. Res. 20 (1990)
1753–1758.
[25] Morin H., Laprise D., Bergeron Y., Chronology of spruce budworm
outbreaks near Lake Duparquet, Abitibi region, Quebec, Can. J.
For. Res. 23 (1993) 1497–1506.
[26] Needham T., Kershaw J.A. Jr., MacLean D.A., Su Q., Effects of
mixed stand management to reduce impacts of spruce budworm
defoliation on balsam fir stand-level growth and yield, North. J.
Appl. For. 16 (1999) 19–24.
[27] Ostaff D.P., MacLean D.A., Patterns of balsam fir foliar production
and growth in relation to defoliation by spruce budworm, Can. J.
For. Res. 25 (1995) 1128–1136.
[28] Piene H., Spruce budworm defoliation and growth loss in young
balsam fir: defoliation in spaced and unspaced stands and indivi-
dual tree survival, Can. J. For. Res. 19 (1989) 1211–1217.
[29] Steinman J.R., MacLean D.A., Predicting effects of defoliation on
spruce-fir stand development: a management-oriented growth and
yield model, For. Ecol. Manage. 69 (1994) 283–298.
[30] Su Q., MacLean D., Needham T.D., The influence of hardwood
content on balsam fir defoliation by spruce budworm, Can. J. For.
Res. 26 (1996) 1620–1628.
Article published by EDP Sciences and available at or />