Báo cáo lâm nghiệp: "Reduction of wood hygroscopicity and associated dimensional response by repeated humidity cycles" doc
Bạn đang xem bản rút gọn của tài liệu. Xem và tải ngay bản đầy đủ của tài liệu tại đây (720.47 KB, 10 trang )
275
Ann. For. Sci. 62 (2005) 275–284
© INRA, EDP Sciences, 2005
DOI: 10.1051/forest:2005020
Original article
Reduction of wood hygroscopicity and associated dimensional
response by repeated humidity cycles
Luis GARCÍA ESTEBAN
a
*, Joseph GRIL
b
, Paloma DE PALACIOS DE PALACIOS
a
,
Antonio GUINDEO CASASÚS
a
a
Cátedra de Tecnología de la Madera, Departamento de Ingeniería Forestal, Escuela Técnica Superior de Ingenieros de Montes,
Universidad Politécnica de Madrid, Ciudad Universitaria s/n, 28040 Madrid, Spain
b
Laboratoire de Mécanique et Génie Civil, Université Montpellier 2, France
(Received 14 April 2003; accepted 31 August 2004)
Abstract – The reduction of wood response to variations of ambient humidity, described as kind of ageing, has been studied from both points of
view of moisture uptake and dimensional changes. Clearwood specimens from 3 gymnosperms (Pinus sylvestris L., Pinus pinaster Ait., Pinus
insignis Dougl.) and 4 angiosperms (Populus spp., Quercus pyrenaica Willd., Entandrophragma cylindricum Sprague, Chlorophora excelsa Benth.
& Hook f.) were subjected to five wet-dry cycles and their moisture content and dimensional changes in radial and tangential direction at three
increasing levels of relative humidity (57.6, 84.2 and 90.2%) were measured before and after the treatment. For a given increase of relative humidity,
a coefficient of hygroscopic ageing was defined as the relative decrease of moisture uptake, and the coefficient of dimensional ageing as the
difference of swelling strain before and after ageing. All species exhibited a clear ageing effect, much stronger in the wet range than in the dry range.
Calculation of swelling coefficients suggested that in some cases the relation between swelling strain and moisture content is no longer linear in
aged wood.
wood / sorption / hygroscopicity / swelling / ageing
Résumé – Réduction de l’hygroscopicité du bois et des variations dimensionnelles associées au moyen de cycles d’humidité répétés. La
réduction de la réponse du bois aux variations d’humidité ambiante, décrite comme une forme de vieillissement, a été étudiée du double point de
vue de la reprise d’humidité et des variations dimensionnelles. Des échantillons de bois sans défaut de 3 gymnospermes (Pinus sylvestris L., Pinus
pinaster Ait., Pinus insignis Dougl.) et 4 angiospermes (Populus spp., Quercus pyrenaica Willd., Entandrophragma cylindricum Sprague,
Chlorophora excelsa Benth. & Hook f.) ont été soumis à 5 cycles humide-sec à 50 °C. Leur taux d’humidité et leurs variations dimensionnelles dans
les directions radiale et tangentielle à trois niveaux croissants d’humidité relative (57,6, 84,2 et 90,2 %) ont été mesurés avant et après traitement.
Pour un accroissement donné d’humidité relative, un coefficient de vieillissement hygroscopique a été défini par la décroissance relative de reprise
d’humidité, et un coefficient de vieillissement dimensionnel par la différence de gonflement avant et après traitement. Toutes les espèces
exprimaient clairement un effet de vieillissement, plus marqué dans la plage humide que dans la plage sèche. Les calculs de coefficients de
gonflement ont suggéré que dans certains cas la relation entre déformation de gonflement et taux d’humidité n’est plus linéaire dans le bois ayant
subi un vieillissement en sorption.
bois / sorption / hygroscopicité / gonflement / vieillissement
1. INTRODUCTION
If dry wood, whether in an anhydrous state or not, is exposed
to hygrothermal conditions corresponding to an equilibrium
moisture content greater than that initially present, the wood
will start to admit water molecules from the surrounding envi-
ronment. The vast number of dynamic hygroscopic states of
equilibrium through which wood passes means that if the tem-
perature is kept constant, the resulting sorption isotherm exhib-
its a sigmoid shape as shown in Figure 1. If the relative humidity
is increasing, the trajectory formed is termed sorption isotherm
[2, 4, 5]. On the other hand, if it is decreasing, it is termed des-
orption isotherm. The two sigmoids do not coincide, so that
humidity cycles produce hysteresis loops [14, 23, 24] (Fig. 2);
the quotient between the sorption and desorption moisture con-
tents, for a single hygrothermal state, has been given the name
of hysteresis coefficient [7].
Practice in the field has led experienced carpenters and
woodworkers in general to state that the longer the wood is in
place on site, the better it is. This is demonstrated by the fact
that pieces of wood obtained from structural elements of old
buildings have lower contraction coefficients. Physically this
phenomenon does not only correspond to an increase in the hys-
teresis coefficient, getting close to 1, but also to a combined
* Corresponding author:
Article published by EDP Sciences and available at or />276 L. García Esteban et al.
mechanism which has been termed hygroscopic fatigue of
wood by some authors [8–10]. However, the concept of
“fatigue” is commonly used in materials science to designate
a negative evolution of material properties, associated with the
development of some microscopic damage. For that reason, we
will prefer the term of “ageing”, which is more neutral and can
also suggest an improvement caused by irreversible changes in
the microstructure, essentially of chemical origin. In essence,
the phenomenon of hygroscopic ageing will be defined as the
loss of hygroscopic response on the part of the wood after a
process of extenuation of the cell wall polarity [17, 19]. It most
likely corresponds to a partial saturation among the polar
groups of the cell wall, leaving them unavailable for water
vapour fixing. Transferred to a sorption or desorption curve,
this results into lower slopes of the sigmoid (Fig. 3). Similar
observations could be made if the dimension of specimens had
been considered, instead of their weight, so that this phenom-
enon can be seen at two levels, hygroscopic and dimensional.
Hygroscopic and dimensional ageing of wood will be defined
here as the loss of response of wood in relation to hygrothermal
changes. This type of ageing is probably irreversible, which
makes it in principle different from the reversible “physical
ageing” [22], suspected to occur in wood also as a consequence
of humidity changes [12].
To evaluate this phenomenon, we based the study on the
sorption isotherms corresponding to 25 °C for each of the
woods used, considering the occurrence of ageing to be shown
when the slope of the isotherms decreased in comparison with
non-aged wood. This implies that the aged wood will respond
with a smaller difference in moisture content (or dimensional
change) for a given variation of relative humidity. This is illus-
trated in Figure 4 where due to the hygroscopic ageing the wood
responds with a lower amplitude to a given step of relative
humidity, resulting in a lower slope of the isotherm. A similar
approach will be taken for characterizing the dimensional ageing.
2. MATERIALS AND METHODS
2.1. Materials
The species used were: 3 gymnosperms, Pinus sylvestris L. (Ps),
Pinus pinaster Ait. (Pp), Pinus insignis Dougl. (Pi); 4 angiosperms, Pop-
ulus spp. (pop); Quercus pyrenaica Willd. (Qp); Entandrophragma
cylindricum Sprague (Ec); Chlorophora excelsa Benth. & Hook f. (Ce).
From a total of ten trunks of each species, with an average length of
2.25 m, and an average diameter from 0.35 m to 0.65 m, ten slices of
50 mm thick were obtained from each. A first cut was made on the
sections or slices with a band saw, dividing them into two halves fol-
lowing a radial direction, with this being the surface area to be used
for obtaining radial test pieces. A second cut was then made on one
of the halves, parallel to the previous cut. This was a tangential cut,
to be used for obtaining tangential test pieces. The surface areas
obtained in this way were laminated while green following the radial
and tangential cuts to a thickness of 1 mm using a laboratory roller.
Finally, the veneers thus obtained were shorn to attain the final meas-
urements of the test pieces (50 × 10 × 1 mm). The test pieces chosen
were all from heartwood (Fig. 5).
For all the woods employed in this study, a prerequisite was estab-
lished that they should all come from a specimen of green lumber in
order to guarantee that the recently cut wood had not undergone any
natural ageing cycle which may have distorted the study of the physical
phenomenon. The justification for drying the wood naturally is based
Figure 1. Isotherm of dynamic hygroscopic states of equilibrium.
Figure 2. Sorption and desorption isotherms.
Figure 3. Hygroscopic ageing of wood.
Figure 4. Characterisation of hygroscopic ageing.
Article published by EDP Sciences and available at or />Reduction of wood hygroscopicity 277
on a number of factors [9, 15, 16, 18]: to avoid checking defects; to
avoid warping or internal stresses produced by a poor choice of kiln-
drying schedule or through its defective conduction; to eliminate the
drying parameter, thereby preventing it from distorting the quantifi-
cation of the phenomenon.
Moreover, lowering the moisture content of the wood below the
fibre saturation point corresponds to the fact that the phenomenon must
be demonstrated below this point and above 12% so that the results
obtained can be transferred to the normal values in use.
2.2. Equipment
To evaluate the process of hygroscopic ageing, thermostatic baths
with water were used, with a regulation of ± 0.1 ºC, equipped with an
agitator allowing the temperature to be homogenised throughout the
recipient. The flasks on which the test pieces were placed had a Petri
dish 3 cm from the free surface area of the saturated solution. To facil-
itate the conditioning of the baths, the entire process was carried out
inside a hygrothermal chamber, as this allowed correct atmospheric
homogeneity around the test pieces. It is recommended that the tem-
perature fluctuations be very slight (≤ ± 0.2 ºC). To diminish the times
required for equilibrium, the process was carried out in a low vacuum
(130 mb). To determine the points of hygroscopic equilibrium, a bal-
ance with a precision of 0.0001 g was used.
The dimensional ageing was evaluated using a micrometer with a
precision of 0.01 mm. To avoid unwanted bowing and warping in some
of the test pieces, in particular those originating from very nervous spe-
cies, the samples were placed between two glass slides 4 mm thick,
70 mm long and 8 mm wide, like a sandwich, and all of this was held
together by two clips at the ends so that the test piece extended beyond
the ends of the slides. The micrometer measurement was always made
on the same point by use of a counterpoint on the opposite side of the
measurement being made.
2.3. Construction of the sorption isotherm
In constructing the isotherms, use was made of the recommenda-
tions of the COST’90 Working Group [21]. To determine the sorption
isotherm, the test pieces must be dried to an anhydrous state. This is
achieved by placing the test pieces in a desiccator containing P
2
O
5
for
one month at a temperature of 25 ºC. After the anhydrous state is
reached, ten anhydrous test pieces, each originating from a different
tree, are placed in each desiccator. Hygroscopic equilibrium is reached
when the difference between two consecutive weightings (about
45 days) is not significant (0.0005 g). However, before starting to plot
the sorption curve, a preliminary calibration should be carried out fol-
lowing the recommendations of the COST’90 Working Group.
Of the salts suggested by the Working Group to achieve the equi-
librium points following the isotherm of 25 ºC, those used for the study
of ageing were NaBr; KCl and BaCl
2
, giving a relative air humidity
of 57.6 ± 0.4%, 84.2 ± 0.3% and 90.19 ± 0.02% respectively. Once
the points of equilibrium are reached, the moisture contents are
expressed in g of water per 100 g of dry material.
2.4. Ageing procedure
Once the sorption isotherm has been constructed, the test pieces are
subjected to an accelerated ageing process designed to produce a loss
of hygroscopic response in the wood (forced ageing). To achieve this,
five alternate ageing cycles were carried out using 50 ºC isotherm and
90% relative humidity and desiccation to anhydrous weight over a
period of three days for each one.
A low ageing temperature was used to avoid modifications in the
hygroscopicity of the wood, as high temperatures cause substantial
decreases in the percentage of the hemicelluloses [3, 6, 11] and a
decrease in the degree of crystallisation of the cellulose [1].
After the five consecutive cycles have been completed, the isotherms
are constructed again following the same saturated salts procedure.
The number of cycles chosen is in relation to the follow-up performed
on the chosen woods during their ageing period. This follow-up showed
that all of the woods chosen had experienced a reduction in weight loss
and measurements in respect to variations in humidity and temperature
at the end of the fifth cycle. At the end of this cycle, the moisture values
and lengths in the wood were very similar to those of the fourth cycle.
2.5. Quantification of moisture content variations
and swelling strains
The sigmoid-shaped graph which defines the equilibrium moisture
content points of wood under different conditions of relative air
humidity for a constant temperature (sorption isotherm) suggests to
quantify the variation of the moisture content between two points of
hygroscopic equilibrium through the use of tangents, or slope of the
sorption isotherm (see Fig. 4):
;
(1)
;
where H
1
= 57.6%; H
2
= 84.2%; H
3
= 90.2% are the three levels of rel-
ative humidity applied to the wood, h
1
, h
2
and h
3
the corresponding
moisture contents, the exponent n refers to the non-aged wood and the
exponent f to the aged wood.
The dimensional changes shall be quantified as a swelling strain ε,
difference between the values obtained for two consecutive points of
hygroscopic equilibrium, expressed as a percentage in relation to the
initial dimension of the interval analysed.
Figure 5. Preparation of test pieces.
a
1
n
h
2
n
h
1
n
–
H
2
H
1
–
=a
2
n
h
3
n
h
2
n
–
H
3
H
2
–
=
a
1
f
h
2
f
h
1
f
–
H
2
H
1
–
=a
2
f
h
3
f
h
2
f
–
H
3
H
2
–
=
Article published by EDP Sciences and available at or />278 L. García Esteban et al.
; for non-aged wood
(2)
;
for aged wood
where L is the specimen length, X stands for T (tangential direction)
or R (radial direction), and the upper scripts have the same meaning
as above.
3. RESULTS
3.1. Equilibrium moisture content
Table I gives the equilibrium moisture content values
obtained at the three levels of relative humidity studied, for
non-aged wood and aged wood. Although the hygroscopicity
of radial and tangential specimens is not supposed to be very
different, slight differences could be expected due to internal
stresses resulting from the heterogeneous swelling behaviour
of earlywood and latewood, an effect depending on the speci-
men orientation. As is made evident in Figure 6, the hygro-
scopic behaviour of both types of specimen cannot be considered
as significantly different, both for non-aged and aged wood.
If we consider the behaviour of non-aged wood as opposed
to that of aged wood, it can be seen that in the latter there has
been a considerable loss of response with the changes of rela-
tive humidity when high values are reached (90.2%), but that
this loss of response is lower for lower values of relative humid-
ity (84.2 and 57.6%). However, this fact does not affect the
presence of a lineal tendency for the three equilibrium points
(Fig. 7). In terms of the species, the values obtained in the hard-
woods studied are more homogeneous as a group than those of
the conifers, in which Pinus pinaster presents values that are
quite lower than the values of other pines, although this behav-
iour changes when aged wood is involved. This fact may be due
Table I. Equilibrium moisture content of non-aged and aged wood at the three levels of relative humidity.
Moisture content in % Non-aged wood Aged wood
Species Orientation H
1
H
2
H
3
H
1
H
2
H
3
Pinus sylvestris Ps TG 14.05 19.19 24.67 12.78 16.18 17.74
σ 0.23 0.33 0.66 0.35 0.54 0.59
RD 13.64 18.48 23.63 11.61 14.44 15.79
σ 0.08 0.21 0.42 0.17 0.15 0.15
Pinus pinaster Pp TG 12.52 15.93 22.06 13.41 15.37 18.07
σ 0.50 0.40 0.47 0.28 0.58 0.19
RD 12.03 15.47 21.97 12.96 14.69 17.67
σ 0.37 0.17 0.26 0.46 0.47 0.45
Pinus insignis Pi TG 14.30 18.81 24.00 13.50 16.69 18.08
σ 0.10 0.16 0.39 0.24 0.19 0.11
RD 14.33 19.01 24.09 13.40 16.78 18.21
σ 0.11 0.11 0.30 0.18 0.20 0.06
Populus spp. pop TG 12.53 17.56 23.58 12.21 15.37 16.69
σ 0.08 0.26 0.23 0.29 0.28 0.30
RD 12.55 17.50 23.25 12.39 15.38 16.65
σ 0.08 0.18 0.30 0.25 0.19 0.22
Quercus pyrenaica Qp TG 13.12 17.09 22.90 12.57 14.80 16.01
σ 0.10 0.12 0.29 0.10 0.08 0.13
RD 13.65 17.30 22.33 12.24 14.24 15.20
σ 0.08 0.20 0.28 0.12 0.18 0.24
Entandrophragma cylindricum Ec TG 13.03 17.90 24.78 13.31 16.61 18.23
σ 0.29 0.19 0.15 0.28 0.28 0.43
RD 12.67 17.82 24.62 12.99 16.07 17.52
σ 0.30 0.18 0.30 0.46 0.11 0.11
Chlorophora excelsa Ce TG 12.28 17.42 24.07 13.02 15.84 17.23
σ 0.34 0.41 0.67 0.22 0.43 0.47
RD 11.98 17.28 23.38 12.81 15.11 16.16
σ 0.26 0.46 0.59 0.37 0.35 0.38
TG = tangential specimen; RD = radial specimen; relative humidity: H
1
= 57.6%; H
2
= 84.2%; H
3
= 90.2%.
x
x
x
x
x
x
x
x
x
x
x
x
x
x
ε
x,1
n
L
2
n
L
1
n
–
L
1
n
= ε
x,2
n
L
3
n
L
2
n
–
L
2
n
=
ε
x,1
f
L
2
f
L
1
f
–
L
1
n
= ε
x,2
f
L
3
f
L
2
f
–
L
2
f
=
Article published by EDP Sciences and available at or />Reduction of wood hygroscopicity 279
to an excessive content of impregnation substances with a base
of terpenoids and polyphenols.
A comparison of the sorption isotherm slope, calculated
according to equation (1), for the two directions once again shows
that the behaviour of wood is the same in both cases (Fig. 8). In
addition, as a result of the loss of response that occurs in the aged
wood for high values of relative humidity, a very slight difference
of slope between both RH steps is observed, while in the case of
the non-aged wood it is quite marked. In the following, we will
not distinguish radial and tangential measurements for the hygro-
scopic data. The values of sorption isotherm slopes are detailed
in Table II. The values obtained are very homogeneous for all the
species with the exception of Pinus Pinaster which once again
shows anomalous behaviour in relation to the other woods.
Figure 9 compares the slope of sorption isotherm for aged
wood and non-aged wood, calculated according to equation (1),
reiterating the fact that the wood is more affected by ageing in
the ranges of high humidity than in the ranges of low humidity,
where the values of all the species show a very high degree of
homogeneity. However, in the ranges of high humidity there
is a greater spread of the values obtained, with the differentia-
tion of Pinus Pinaster once again standing out.
3.2. Swelling strain
Tables III and IV give the swelling strains in radial and tan-
gential directions, respectively, calculated using equation (2), for
both non-aged and aged wood. In all cases, the swelling of aged
wood induced by a given RH step is much lower than that of non-
aged wood. This is made evident in Figure 10, where all plots lie
under the diagonal.
Figure 6. Relation between the equilibrium moisture contents of the
test pieces with radial and tangential orientation for the 3 levels of
relative humidity (57.6%; 84.2% and 90.2% RH): (a) non-aged wood;
(b) aged wood.
Figure 7. Relation between equilibrium moisture content for aged
wood and non-aged wood, for the three levels of relative humidity.
Figure 8. Relation between sorption isotherm slope for radial and tan-
gential specimens, for the two steps of relative humidity. Filled sym-
bols: non-aged wood; empty symbols: aged wood.
Figure 9. Relation between slope of sorption isotherm for aged wood
and non-aged wood, for the two RH steps.
Article published by EDP Sciences and available at or />280 L. García Esteban et al.
As shown by Figure 11, swelling anisotropy usually observed
in non-aged wood, is maintained in aged wood: the tangential
swelling is approximately twice the radial swelling, for all the
species studied and for both aged and non-aged wood. As can
be expected, the loss of response in aged wood in terms of mois-
ture content of the wood translates into a loss of dimensional
Table II. Slope of sorption isotherm for the two relative humidity steps and corresponding coefficient of hygroscopic ageing.
Species
Slope of sorption isotherm*
Hygroscopic
ageing coefficient**
Non-aged wood Aged wood
Relative humidity steps
H
1
ÆH
2
H
2
ÆH
3
H
1
ÆH
2
H
2
ÆH
3
H
1
ÆH
2
H
2
ÆH
3
a
1
n
a
2
n
a
1
f
a
2
f
α
1
α
2
Softwood
Ps 0.19 0.89 0.12 0.24 1.62 3.67
σ 0.01 0.06 0.01 0.02 0.16 0.32
Pp 0.13 1.05 0.07 0.47 1.98 2.29
σ 0.01 0.08 0.02 0.08 0.52 0.45
Pi 0.17 0.86 0.12 0.23 1.40 3.70
σ 0.00 0.05 0.01 0.03 0.10 0.50
Hardwood
pop 0.19 0.98 0.12 0.22 1.64 4.56
σ 0.01 0.05 0.01 0.02 0.18 0.35
Qp 0.14 0.90 0.08 0.18 1.82 5.08
σ 0.01 0.07 0.01 0.03 0.20 0.72
Ec 0.19 1.14 0.12 0.26 1.60 4.51
σ 0.01 0.03 0.02 0.03 0.24 0.55
Ce 0.20 1.06 0.10 0.20 2.17 5.36
σ 0.01 0.07 0.02 0.04 0.63 0.75
* Equation (1); ** equation (3).
Table III. Tangential swelling strain for the two relative humidity steps and corresponding coefficient of dimensional ageing.
Species
Tangential swelling strain* Dimensional
ageing coefficient**
Non-aged wood Aged wood
Relative humidity steps
H
1
ÆH
2
H
2
ÆH
3
H
1
ÆH
2
H
2
ÆH
3
H
1
ÆH
2
H
2
ÆH
3
ε
T,1
n
ε
T,2
n
ε
T,1
f
ε
T,2
f
η
T,1
η
T,2
Softwood
Ps 1.60 1.98 0.78 0.61 0.82 1.37
σ 0.15 0.21 0.14 0.15 0.17 0.28
Pp 0.88 1.95 0.15 0.98 0.73 0.98
σ 0.17 0.13 0.07 0.18 0.15 0.19
Pi 1.33 1.76 1.00 0.16 0.33 1.60
σ 0.11 0.11 0.18 0.07 0.23 0.11
Hardwood
pop 1.06 1.93 0.73 0.35 0.32 1.58
σ 0.21 0.21 0.18 0.13 0.14 0.2
Qp 1.60 3.04 1.38 2.01 0.22 1.04
σ 0.20 0.20 0.23 0.24 0.18 0.15
Ec 2.19 3.24 1.61 0.71 0.57 2.53
σ 0.12 0.19 0.25 0.19 0.23 0.16
Ce 2.95 3.99 2.49 2.18 0.46 1.81
σ 0.31 0.36 0.26 0.35 0.20 0.30
* Equation (2); ** equation (4).
x
x
x
x
x
x
x
x
x
x
x
x
x
x
Article published by EDP Sciences and available at or />Reduction of wood hygroscopicity 281
response which once again is more accentuated in the high val-
ues of relative air humidity.
In Figure 12 comparing the swelling strain in both RH inter-
vals, this effect is demonstrated by having the plots correspond-
ing to aged wood close to the diagonal, whereas in non-aged
wood, they lie well above the diagonal.
4. DISCUSSION AND CONCLUSIONS
4.1. Definition of ageing coefficients
The results obtained suggest to quantify both types of ageing
by appropriate coefficients. The coefficient of hygroscopic age-
ing α will be defined as ratio of sorption isotherm slopes:
(3)
where i = 1, 2 for corresponding RH step. According to this def-
inition, the existence of hygroscopic ageing is expressed by a
value of this coefficient different from 1. Values higher or lower
than one will signify positive or negative hygroscopic ageing,
respectively. The coefficient of dimensional ageing will be
defined as a difference of swelling strains:
(4)
Table IV. Radial swelling strain for the two relative humidity steps and corresponding coefficient of dimensional ageing.
Radial swelling strain*
Dimensional
ageing coefficient**
Non-aged wood Aged wood
Species Relative humidity steps
H
1
ÆH
2
H
2
ÆH
3
H
1
ÆH
2
H
2
ÆH
3
H
1
ÆH
2
H
2
ÆH
3
ε
R,1
n
ε
R,2
n
ε
R,1
f
ε
R,2
f
η
R,1
η
R,2
Softwood
Ps 0.79 0.89 0.51 0.36 0.28 0.53
σ 0.10 0.15 0.13 0.12 0.08 0.16
Pp 0.53 1.44 0.27 0.50 0.27 0.94
σ 0.11 0.22 0.17 0.14 0.12 0.20
Pi 0.55 0.66 0.39 0.29 0.17 0.37
σ 0.08 0.08 0.09 0.07 0.05 0.09
Hardwood
pop 0.72 1.59 0.44 0.36 0.29 1.23
σ 0.15 0.33 0.10 0.16 0.16 0.41
Qp 0.61 1.36 0.45 0.37 0.16 1.00
σ 0.14 0.27 0.11 0.07 0.11 0.32
Ec 0.95 1.47 0.54 0.27 0.41 1.20
σ 0.12 0.22 0.16 0.1 0.21 0.21
Ce 1.20 1.40 0.95 1.05 0.24 0.35
σ 0.21 0.17 0.15 0.09 0.15 0.15
* Equation (2); ** equation (4).
x
x
x
x
x
x
x
Figure 10. Relationship between the swelling of aged and non-aged
wood, for the two RH steps and the two orientations.
α
i
a
i
n
a
i
f
=
Figure 11. Relationship between the tangential and the radial swel-
ling, for the two RH steps. Filled symbols: non-aged wood; empty
symbols: aged wood.
η
x,i
ε
i
n
ε
i
f
–=
Article published by EDP Sciences and available at or />282 L. García Esteban et al.
where i = 1, 2 indicates the RH step and X = R, T the orientation.
In this case, positive or negative values of η
X
signify positive or
negative ageing, respectively.
In the right part of Tables II, III and IV, the α or η
X
values
have been given, for both RH intervals. In all cases, we have
α > 1 and η
X
> 0, indicating a positive hygroscopic or dimen-
sional ageing.
4.2. Hygroscopic ageing
Figure 13 shows that hygroscopic ageing is much more pro-
nounced at higher humidity. Moreover, it is stronger in hardwoods
than in softwoods. It is possible that this sorptional behaviour
of the hardwood woods is in response to a greater neutralisation
of the OH groups in their cell wall as a consequence of the larger
amount of hemicellulose in their composition. The existence of
cellulose and hemicellulose implies the presence of H-C-OH
and H-C-CH
2
OH groups in the cell wall. These groups have a
polar nature and as water is a polar compound, it can be retained
by such groups, thereby giving to the cellulose, and therefore
by extension to the wood, a hygroscopic nature. Due to its
hygroscopic nature, a consequence of the presence of OH
groups in the cell walls of the vegetal cells that constitute
xylematic tissue, the wood constantly tends towards a dynamic
equilibrium with the surrounding air. However, this hygro-
scopicity would remain superficial, external or perimetric with
respect to the cell, were it not for the presence of interstices
within the cell wall which allow water molecules to enter. This
internal surface area varies according to the specific weight of
the wood itself and oscillates between 0.2 and 2.8 × 10
6
cm
2
/cm
3
,
which represents a large number of cavities inside the wood
[13]; in this evaluation, the surfaces corresponding to elemen-
tary fibrils, micro-fibrils and lumen were considered. The polar
nature of the actual water molecules which penetrate the cavi-
ties or interstices of the wood causes these molecules to be
retained by the OH groups of the cellulose molecules which
make up the cell wall [20]. The molecules are retained by the
cell wall when the distance between the two is less than 10
–8
cm.
When any of these OH groups become permanently saturated
due to proximity with other groups, the wood begins to lose
hygroscopic and dimensional response. This loss of response
may be due to the progressive decrease in the concentration of
the OH groups during the ageing of the wood, rather than to
the degree of crystallisation of the cellulose, as although it
changes during the first years of growth, it does not change in
a significant way with greater ageing [1].
The retention of water molecules by the OH groups in the
cell wall is not an anarchic or disorderly process, but is gov-
erned by a grouping phenomenon which is a consequence of
the polar nature of the bodies in contact. Fixation of water in
wood occurs in three different phases according to the entry
mechanism: molecular sorption, adsorption and capillary con-
densation. To a large extent it is precisely the phases of sorption
and adsorption which cause the phenomena of hygroscopic and
dimensional ageing, as in both phases the water fixing mecha-
nism occurs because of the presence of OH groups. Molecular
sorption occurs only for reasons of superficial polarity. This
sorption is more accentuated in the amorphous zones of the
micellar framework, due to the enormous quantity of free OH
radicals. At the same time, the water molecules start to position
themselves in the crystalline zone, and although it is not pos-
sible to fix the point at which all the OH groups, both from the
amorphous and crystalline zones, are saturated, it appears that
this critical point contributes to the total moisture content of the
wood at the fibre saturation point about 8% at most. The second
sorption stage is comprised of the adsorption. This stage occurs
as a consequence of the large number of interstices wood has,
or, in other words, the large amount of internal surface area it
possesses. This surface area has the form of an intricate sub-
microscopic system which gives rise to a capillary system capa-
ble of retaining the water molecules sorbed in molecular form,
which are capable of linking to each other by means of hydro-
gen bonds. This stage is exothermic, since it has been shown
to diminish with increasing temperature. The maximum con-
tribution of this stage to the fibre saturation point is situated at
around 12–16%.
4.3. Dimensional ageing
Figure 14 compares the dimensional ageing for the two intervals
of relative humidity and the two directions. Like for hygroscopic
Figure 12. Relationship between the swelling induced by the two RH
steps, according to the orientation and the ageing state.
Figure 13. Relationship between the coefficient of hygroscopic ageing
in the two ranges of relative humidity.
Article published by EDP Sciences and available at or />Reduction of wood hygroscopicity 283
ageing, it is more pronounced at high humidity. The dimen-
sional ageing is greater the closer we are to the fibre saturation
point. This is due to the loss of response in the cell wall, as many
of the OH groups become permanently neutralised, partially
recovering their polarity in a small percentage. Although the
phenomenon of dimensional ageing must be considered as an
ageing process of wood which responds only to a surface area
phenomenon, both inter- and intra- microfibrillar in the cell
wall, the incidence will vary in function of the direction of
observation. For this aspect, the comparison of hardwoods and
softwoods is not so clear: in the radial direction hardwoods
exhibit generally a higher ageing but in the tangential direction,
the dimensional ageing of P. sylvestris and P. pinaster, in the
lower range, is higher than all other species.
4.4. Relation between hygroscopic and dimensional
ageing
Obviously the loss of hygroscopicity, characterised by the
hygroscopic ageing, should be responsible for at least a part of
the loss of dimensional response, characterised by the dimen-
sional ageing. Figure 15 evidences a rather good correlation
between the hygroscopic and dimensional ageing, for both
radial and tangential directions.
For practical purpose, it can be useful to express a dimen-
sional change as a function of the variation of moisture content.
This is usually done by calculating swelling coefficients such as:
; (5)
where the subscripts i = 1, 2 indicate the RH step and X = R,
T the direction, and the upperscript n or f refer to the non-aged
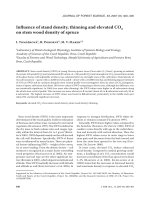
and aged specimens, respectively. Figure 16a shows that in
most cases, the swelling coefficient of aged wood in not very
different from that of aged wood, indicating that the cause of
dimensional ageing is mostly the reduction of hygroscopicity.
There are, however, some exceptions, especially for the higher
RH range, where the swelling coefficient of aged wood is much
higher or much smaller, resulting in a reduced or triggered
dimensional ageing, respectively. Figure 16b suggests that the
linearity between strain and moisture content in the hygro-
scopic range, usually observed in non-aged wood, is no longer
present with aged wood. If it was, the same coefficient should
have been measured in both RH ranges. However, in most cases
it is higher in the wet than in the dry range, and considerably
higher in some cases. This unusual behaviour of the aged wood
suggests further investigation with a full record of its swelling
and shrinkage behaviour.
Figure 14. Relationship between the coefficient of dimensional ageing (a) in the two ranges of relative humidity, and (b) for the two directions.
β
x,1
n
ε
i
n
h
i 1+
n
h
i
n
–
= β
x,1
f
ε
i
f
h
i 1+
f
h
i
f
–
=
Figure 15. Relation between coefficients of hygroscopic and dimen-
sional ageing.
Article published by EDP Sciences and available at or />284 L. García Esteban et al.
REFERENCES
[1] Ali M., Emsley A.M., Herman H., Heywood R.J., Spectroscopic
studies of the ageing of cellulosic paper, Polymer 42 (2001) 2893–
2900.
[2] Borovikov A.M., Rvanina A.M., Unified method of determining
the limit of hygroscopicity of wood, Lesnoi Zhurnal, USSR 16
(1973) 168–169.
[3] Burmester A., Zur Dimensionsstabilisierung von Holz, Holz Roh-
Werkst. 33 (1975) 333–335.
[4] Cudinov B.S., Andreev M.D., Hygroscopicity of wood at tempera-
tures below zero degrees centigrade. 2. The condition of the hygros-
copic moisture and the equilibrium moisture content, Leipzig, VEB
Fachbuchverlag, Holztechnologie 19 (1978) 147–151.
[5] Cudinov B.S., Andreev M.D., Stepanov V.I., Fink el’stein A.V.,
The hygroscopicity of wood at temperatures below 0 °C. I. Sorption
and fibre saturation point, Holztechnologie 19 (1978) 91–94.
[6] Davis W.H., Thompson W.S., Influence of thermal treatments of
short duration on the toughness and chemical composition of wood,
For. Prod. J. 14 (1964) 50–356.
[7] Djolani B., Hystérèse et effets de second ordre de la sorption
d’humidité dans le bois aux températures de 5, 21, 35, 50 °C, Ann.
Sci. For. 29 (1972) 465–474.
[8] D’yakonov K.F., Kur’yanova T.K., Change in the hygroscopicity
of Birch wood after thermal treatment and long-term storage, Les-
noi Zhurnal, USSR 6 (1975) 162–163.
[9] D’yakonov K.F., Shchekin V.A., Change in the hygroscopicity of
Scots pine wood as a result of the temperature effect during cyclic
heating, Lesotekh. Inst., Voronezh, USSR, Lesnoi Zhurnal 1 (1981)
65–67.
[10] Engelhardt F., Investigations on the sorption of water vapour by
beech wood in the temperature range 110 to 170 °C, Inst. fur Holz-
forschung der Univ. Munchen, German Federal Republic, Holz
Roh- Werkst. 37 (1979) 99–112.
[11] Hillis W.E., Rozsa A.N., High temperature and chemical effects on
wood stability. Part 2, The effect of heat on the softening of radiata
pine, Wood Sci. Technol. 19 (1985) 57–66.
[12] Hunt D.G., Gril J., Evidence of a physical ageing phenomenon in
wood, J. Mater. Sci. Lett. 15 (1996) 80–82.
[13] Kollmann F., Tecnología de la Madera y sus aplicaciones. Tomo
primero. Instituto Forestal de Investigaciones y experiencias y ser-
vicio de la madera, Madrid, 1959, pp. 121–195.
[14] Krutul D., Sorption and desorption of the Entandophragma sp.
wood after extraction with selected organic solvents, Zeszyty
naukowe, Technologia drewna, Akademia Rolnicza w. Warszawie
10 (1979) 19–33.
[15] Matejak M., Effect of wood drying on sorption isotherms, Holz-
forschung Holzverwertung 35 (1983) 80–84.
[16] Molinski W., Deformations of wood stretched across the grain
during simultaneous moistening and re-drying in humid air, Fac.
Wood Tech., Agric. Univ. Poznan, Poland 39 (1987) 116–118.
[17] Rowell R.M., Youngs R.L., Dimensional stabilization of wood in
use, USDA Forest Service research note FPL, United States, Forest
Products Laboratory, Jan. 1981, No. 0243, 1981.
[18] Rozsa A.N., Hillis W.E., High temperature and chemical effects on
wood stability. Part 4. Testing for the stability of dried pine wood,
CSIRO Div. Chem. Wood Technol. Australia 41 (1987) 115–118.
[19] Shukla K.S., Jain V.k., Bhalla H.K.L., Kumar S., Physical and
mechanical properties of wood-wool boards. I. Hygroscopicity and
dimensional stability, J. Timber Dev. Assoc. India 27 (1981) 41–45.
[20] Simpson W., Sorption theories applied to wood, Wood and fibre,
1980.
[21] Spiess W.E.L., Wolf W.R., The results of the COST 90 project on
water activity. Physical properties of foods, Ed. R. Jowitt, London,
1983.
[22] Struik L.C.E., Physical ageing in amorphous polymers and other
materials, Elsevier, Amsterdam, Oxford, New York, 1978.
[23] Victor V.J., Capillary hysteresis in wood, Indian Acad. Wood Sci.
J. 2 (1971) 73–83.
[24] Volchanova M.N., Sorption hystereris of comminuted wood, Les-
noi Zhurnal, USSR 1 (1976) 118–121.
Figure 16. Effect of the ageing treatment on the swelling coefficient of wood in both radial (Rd) and tangential (Tg) directions: (a) aged versus
non-aged wood; (b) wet range versus dry range of relative humidity.
Article published by EDP Sciences and available at or />