Báo cáo lâm nghiệp: " Influence of environmental conditions on radial patterns of sap flux density of a 70-year Fagus crenata trees in the Naeba Mountains, Japan" ppsx
Bạn đang xem bản rút gọn của tài liệu. Xem và tải ngay bản đầy đủ của tài liệu tại đây (1.53 MB, 8 trang )
289
Ann. For. Sci. 62 (2005) 289–296
© INRA, EDP Sciences, 2005
DOI: 10.1051/forest:2005023
Original article
Influence of environmental conditions on radial patterns of sap flux
density of a 70-year Fagus crenata trees in the Naeba Mountains,
Japan
Mitsumasa KUBOTA
a
*, John TENHUNEN
b
, Reiner ZIMMERMANN
c
, Markus SCHMIDT
b
,
Yoshitaka KAKUBARI
a
a
Institute of Silviculture of Forest Resources, Faculty of Agriculture, University of Shizuoka, Ohya 836, Shizuoka 422-8529, Japan
b
Department of Plant Ecology, University of Bayreuth, 95440 Bayreuth, Germany
c
Max Planck Institute for Biogeochemistry, PO Box 100164, 07743 Jena, Germany
(Received 27 May 2004; accepted 18 October 2004)
Abstract – Sap flux density (SFD) was measured continuously during 1999 with the heat dissipation method in natural Fagus crenata Blume
(Japanese beech) forests growing at 900 m on the northern slope of the Kagura Peak of the Naeba Mountains near the Sea of Japan. Radial
variations in xylem daily SFD (SFD
day
) on three trees were investigated during the growing season. The radial pattern of SFD
day
that reached
a maximum just behind of the cambium layer and then decreased exponentially was described by applying the Weibull function based on sensor
measurements at 20 mm intervals. SFD
day
ratio of 20–40 mm depth (the value of 0–20 mm depth was 100%) increased by 10–32% because of
soil drying. The peak value of the Weibull function shifted to 2–10% interior by those changes in the relative xylem depth. The variation of the
radial pattern of SFD
day
under different environmental conditions was expressible as the shift of the peak position of the Weibull function.
diffuse-porous / Granier sensor / soil moisture / drought / Weibull function
Résumé – Influences des conditions environnementales sur les patrons radiaux de densités de flux de sève de Fagus crenata âgés de
70 ans dans les montagnes de Naeba au Japon. La densité de flux de sève (SFD) a été mesurée en continu pendant l’année 1999 avec la
méthode de dissipation de chaleur dans une forêt naturelle de Fagus crenata Blume (hêtre du Japon) située à 900 m d’altitude sur un versant
nord prés de la mer du Japon. Les variations radiales journalières de SFD (SFD
jour
) de trois arbres ont été étudiées pendant la saison de
croissance. Le patron radial de SFD
jour
atteint un maximum juste derrière la couche du cambium et puis décroît de façon exponentielle et est
décrit par la fonction Weibull sur la base des mesures des capteurs à des intervalles de temps de 20 mm. Le rapport de 20 à 40 mm (la valeur
de 0 à 20 mm était égale à 100 %) s’est accru de 10 à 32 % à cause du dessèchement du sol. Le pic de la valeur de la fonction Weibull passe de
2 à 10 % par ces changements de valeur relative de l’épaisseur du xylème. La variation du patron radial de SFD
jour
sous différentes conditions
environnementales était exprimable par le déplacement de la position du pic de la fonction Weibull.
poreux diffus / capteurs de Granier / humidité du sol / sécheresse / fonction Weibull
1. INTRODUCTION
Estimation of water balance in mountain catchments of
Japan depends critically on the methods used to quantify water
use by forest stands on the slopes. Forest stand evapotranspi-
ration is impossible to measure directly, for example to measure
via eddy covariance, due to complex mountain topography in
which trees grow up to several tens of meters. Sap flux measure-
ments by heat dispersion [4, 5], on the other hand, allow estimation
of the transpiration component of ET in non-homogeneous ter-
rain [8, 21]. To obtain estimates of total water use by individual
trees, it is necessary to integrate sap flux density across the
sapwood area when sapwood radial width is greater than the
usual 2 cm length of the Granier sensor [17, 26]. In conifer and
ring-porous trees, sapwood depth can be determined from fresh
cores exhibiting differences in color in response to dye appli-
cation [2] or in density due to differences in water content
(sapwood versus heartwood; Köstner et al. [17]). In addition,
computer tomography [11] and thermal IR-imaging [6] have
been used to quantify sapwood area. Furthermore, the sharp
boundary between sapwood and heartwood can be observed via
associated decreases in sap flux density by inserting the Granier
sensor to different radial depths [8, 16, 23].
In contrast, the boundary between the sapwood and heartwood
is indistinct and cannot be visually determined for the diffuse-
porous beech trees investigated in this study. It is necessary
to measure sap flux density as a function of depth in the xylem
in order to estimate tree total water use. Granier et al. [9, 10],
Köstner et al. [17] and Schafer et al. [30] reported that sap flux
* Corresponding author:
Article published by EDP Sciences and available at or />290 M. Kubota et al.
density decreases exponentially from the outer to the inner sap-
wood in Fagus sylvatica. Especially clear, exponentially
decreasing functions were measured in the small diameter trees
by Schafer et al. [30] with the average measurement tree diam-
eter = 26 cm, and by Granier et al. [9] with the diameter of the
measurement trees = 10 to 21 cm. Nadezhdina et al. [20] and
Ford et al. [3] recently reported that the sap flux density reaches
a maximum value in the interior of the cambium layer and was
shown to decrease exponentially along the radial axis of the
xylem. We assumed a regular transition in the sap flux density
along the radial axis in the xylem by fitting the Weibull function
to three measurements (0–20- and 20–40- and 40–60-mm
xylem depth) with 20-mm long sensors.
We assumed that radial patterns in sap flux density may be
more complex, particularly exhibiting a time dependence as
habitat conditions change on the measurement period. Thus,
shifts in the Weibull function fit to the data may occur. To cla-
rify the radial patterns in sap flux density along radial sections
of the xylem, we have examined how variations in radiation
input (PPFD), vapour pressure deficit (VPD) and soil moisture
are related to changes in sap flux density measured at different
depths in the trees. The study was conducted on trees growing
at 900 m in a natural Fagus crenata forested mountain region
of Japan.
2. MATERIALS AND METHODS
2.1. Site description
The study area is located in the Naeba Mountains ca. 50 km north-
east of Nagano. The sites were established in 1970 for long-term eco-
logical monitoring along an altitudinal gradient within the framework
of IBP [13]. On the northern slope of Kagura Peak, natural Japanese
beech forests (Fagus crenata Blume) grow at elevations of 550 m to
1600 m.
The study site (36° 53’ N and 138° 46’ E) is located on a northeast
facing mountain slope at an elevation of 900 m. Stand biomass distri-
bution, leaf area index and other structural parameters, as well as
growth have been documented through continued observations over
a period of more than 30 years [14]. Stand density is ca.1200 stems
per ha, the mean stand canopy height is 19.1 m, the mean diameter at
breast height (DBH) is 20.9 cm, and the age of trees is 70-year. LAI
of the canopy is 5.2, and radiation penetrating the canopy is quite low.
The basal area (more than DBH 4.5 cm) is 49.1 m
2
ha
–1
. The dominant
tree of this site (plot size 600 m
2
) is Fagus crenata the relative basal
area (DBH: more than 4.5 cm) occupied by the Fagus crenata is
92.3%. The upper canopies of the forest stands are dominated by
Fagus crenata, with occasional occurrence of Quercus mongolica var.
grosseserrata, Magnolia obovata and Acanthopanax. A diverse
understory of shrubs occurs with Viburnum furcatum, Lindera umbel-
lata, Acer rufinerve, Clethra barbinervis, Acanthopanax sciadophyl-
loides, Daphniphyllum humile and Sasa kurilensis.
The bedrock in the study area is predominantly andesite and basalt,
on which moderately moist brown forest soil has formed. Climatically,
this region along the Japan Sea coast is characterized by a high pre-
cipitation of ca. 2100 mm year
–1
, with large quantities of precipitation
falling as snow in winter, leading to snow cover of three to four meters.
A strong seasonal pattern in summer precipitation, however, often
reduces water availability during August. The amount of precipitation
during the growing season was 1070 mm at study sites in 1999. Mean
annual air temperature was 9.3 °C at study sites in 1999. Snow remained
until the beginning of May, and beech leaves begin to flush in late April
or early May, while autumn leaf coloring starts in late October.
2.2. Micrometeorology and soil moisture content
Meteorological conditions were monitored from scaffolding towers
that extended above the forest canopy. Soil variables were monitored
in the immediate tower vicinity, while precipitation was measured in
large clearings at the forest edge with tipping bucket rain gauges (RG1,
Delta-T Devices, England). PPFD was measured with LI-190 sensors
(LI-COR, USA), and solar irradiance with LI-200 pyranometers (LI-
COR, USA) above the canopy on the towers. Wind speed was meas-
ured with cup anemometers similarly installed above the canopy
(AN1, Delta-T Devices, England). Soil volumetric water content was
measured via time-domain reflectometry (ML2 Theta Probe, Delta-T
Devices, England) at a depth of 0.25 m. TDR sensors were calibrated
by gravimetric determinations of water content in multiple cores of
100 cm
3
that were extracted in the neighborhood of the sensors. Light
sensors were scanned at 10-s intervals; the other sensors at 30-s inter-
vals. All variables were averaged over 30 min and logged (DL2e with
LAC1, Delta-T Devices, England). Additionally, air temperature and
relative humidity were measured with thermistor and capacitor sensors
installed at the heights of 15 m within the tree crowns. The observa-
tions were logged at 30-min intervals (RS-11, TABAI-ESPEC, Japan)
and subsequently used to calculate vapor pressure deficit [33].
2.3. Sap flux density (SFD) measurements
Xylem sap flux density (SFD) was monitored continuously
throughout the growing season using the heat dissipation method
according to Granier [4, 5]. Heating of the upper probe was carried
out along a 20 mm long winding in all cases. The paired needles, how-
ever, were of different lengths in order to allow observation of SFD
at different depths: 0 to 20 mm, 20 to 40 mm and 40 to 60 mm from
the cambium. The heated probes were positioned on the trunk circum-
ferentially as close to one another as possible.
The sensors were installed between the end of April before the
leaves flushed. The sensors were removed in November after leaves
had fallen to avoid damage by heavy winter snow. Healthy individual
beech trees contributing to the main layer of the canopy were selected
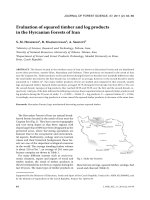
as summarized in Table I. The situation of the three measurement trees
within the stand is illustrated in Figure 1. The DBH of measurement
trees were 26 cm to 35 cm, while the range in stem diameter at breast-
height in the stand was 19 cm to 41 cm.
All sensor installations were made on the north-facing side of the
trees and covered with a radiation shield to reduce thermal load on the
sensors. Power was provided by lead-acid batteries that were
recharged with solar panels (SP75, SIEMENS, USA) via a charge con-
troller (ProStar-30, Morningstar-Co, USA). The output value was
monitored every 30 s, and a 30-min mean value was logged (DL2e with
LAC1 in double ended mode, Delta-T Devices, England) for each sensor.
2.4. Aggregation to daily values
This study utilized data of sap flux density and environmental fac-
tors measured from April 20 to November 15, 1999 (cf. Fig. 2). The
duration of the growing period was from May 6 to October 29 during
this year. The growth period was divided into four periods: (i) the leaf
expansion stage (from 20 April to May 31), (ii) the first half of the
mature stage (June and July), (iii) the latter half of the mature stage
(August and September), and (iv) the leaf senescence period (from first
October to November 10).
Since the main interest is in seasonal and long-term trends, driving
variables and the tree physiological property SFD were aggregated to
daily values. This is particularly useful, since the measured short-term
values of SFD exhibit time lags diurnally in response to environmental
variables [7, 15, 23, 29, 31, 34], while aggregated data demonstrate
the dependencies of overall water use with respect to environmental
trends (see also Phillips and Oren [27]). Furthermore, meteorological
Radial patterns of SFD of Fagus crenata 291
data is often available on a daily basis at many sites [35]. Thus, the
temporal upscaling of our results permits comparisons and use of the
data in a broader context for study of Japanese forests.
PPFD and precipitation measurements were converted to daily (24-h)
sums (PPFD
day
and P
day
), and vapor pressure deficit was converted
to the daytime mean (VPD
day
). Soil moisture was expressed as a daily
(24-h) mean of the volumetric water content (θ
day
). SFD measured
with each sensor was integrated over the day (SFD
day
), providing a
water flux density at daily (24-h) scale appropriate for the particular
sensor location.
2.5. Estimate of radial patterns of SFD
day
using
Weibull function in the xylem
Results for clear days with high water availability (PPFD
day
= 35–
45 mol m
–2
day
–1
, θ
day
> 50%) are illustrated in Figure 3. We used rel-
ative depth for the radial depth in the xylem [18] expressed as 0 at the
cambium and 100% at the center of the trunk. White bars indicate
actual measured values of SFD
day
. The width of each bar represents
the span of an individual sensor. The SFD
day
is calculated as a mean
radial value of the xylem over a depth of 20 mm because that is the
length of the Granier sensors employed.
We assumed a regular transition in the radial value of the SFD
day
according to the Weibull function fit to three data points (0–20 and
20–40- and 40–60-mm xylem depth) measured with 20-mm sensors.
The Weibull function takes the following form:
(1)
where “y” indicates SFD
day
, the coefficient “a” determines the peak
value of SFD
day
, the coefficients “b” and “c” determine curvature, the
Figure 1. Map of projected canopy areas of the investigated Fagus crenata trees in the Naeba Mountains, Japan. The shaded canopies indicate
the measurement trees.
Table I. General characteristics of the investigated Fagus crenata trees at 900-m elevation in the Naeba Mountains, Japan.
Tree No.
Tree diameter at breast
height (cm)
Tree height
(m)
Tree diameter at
measurement (cm)
Height of sensor
(m)
Canopy project area
(m
2
)
A 25.6 21.7 22.7 3.5 11.2
B 31.7 19.8 29.0 3.5 13.4
C 35.1 19.6 31.5 3.5 18.5
ya
c 1–
c
1 c–
c
xd–
b
c 1–
c
1
c
+
c 1–
e
xd–
b
c 1–
c
1
c
+
c
–
c 1–
c
+=
292 M. Kubota et al.
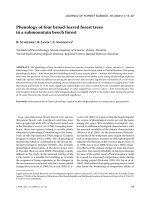
Figure 2. Above canopy daily (24-h) sum of photosynthetic photon flux density (PPFD
day
), within canopy daily (24-h) mean air temperature
(AT
day
) and daytime mean vapor pressure deficit (VPD
day
), daily (24-h) mean soil volumetric water content at a 0.25 m depth (θ
day
), daily
(24-h) sum of precipitation (P
day
), and daily (24-h) sum of sap flux density (SFD
day
) in 1999 (from April 20 to November 10) at 900-m site in
the Naeba Mountains, Japan. SFD
day
was measured at three depths; 0-20mm (open square ), 20-40mm (closed circle ●) and 40–60 mm (open
triangle U).
Radial patterns of SFD of Fagus crenata 293
coefficient “d” is a depth that the curve becomes the peak, and “x”
represents the radial depth in the xylem.
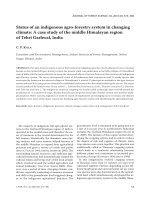
The area below the fitted Weibull function is equal to the summed
area of the bars for each depth (0–20 mm, 20–40 mm and 40–60 mm).
According to this analysis, the SFD
day
reaches a maximum just behind
of the cambium layer and then decreases exponentially as suggested
by Nadezhdina et al. [20] and Ford et al. [3]. Furthermore, the Weibull
function enables estimation of SFD
day
deeper than deepest sensor
insertion (60 mm).
3. RESULTS AND DISCUSSION
3.1. Forest microclimate and variations in soil moisture
content
Daily rainfall (P
day
) in late summer was extremely low with
no measured rainfall between July 25 and August 12 as shown
in Figure 2E. In contrast, rainfall during the remaining period
of study was more evenly distributed. The seasonal trend in θ
day
at 0.25 m depth can be explained by the differences in rainfall
input and potential water extraction by transpiration. Due to the
prolonged dry period, θ
day
exhibited a decline until August 11
but a recovery period was seen after the rainfall of August 12
(Fig. 2D). In contrast, θ
day
showed little variation during the
remaining period of study. The PPFD
day
and VPD
day
peaked
on the summer solstice, and decreased gradually thereafter with
transition to winter (Figs. 2A and 2C).
The relation between PPFD
day
and θ
day
and the relation
between PPFD
day
and VPD
day
were examined for each period
(the leaf expansion stage, the first half of the mature stage, the
latter half of the mature stage, and the leaf senescence period).
The θ
day
was independent of changes in PPFD
day
, although low
values occurred in θ
day
during the third period. VPD
day
was
dependent on PPFD
day
but the relationship changed according
to the period of year examined. Variations in VPD
day
were high
during the first half of the mature stage, although a clear depen-
dence on PPFD
day
may be recognized. We considered that the
variation in VPD
day
occurred due to the inflow of drier or wetter
air (including rainfall events) with changing weather systems
as well as the influence of these on evapotranspiration.
3.2. Radial patterns of SFD
day
with different
environmental condition
Figures 2F–2H express the seasonal change of SFD
day
in each
depth in each tree. The strongest influences on SFD
day
are first
PPFD
day
and in correlation with this VPD
day
. The influence of
θ
day
is recognizable in the slow decrease in maximum SFD
day
between July 30 and August 15.
We continued analysis of variation in SFD
day
with trunk
depth in each tree by selecting very different environmental
conditions during the mature stage (the second and the third
period). Three typical environmental conditions were selected:
(i) Fine & Wet (PPFD
day
was 35–45 mol m
–2
day
–1
and the θ
day
was above 50%), (ii) Cloud & Wet (PPFD
day
was 15–
25 mol m
–2
day
–1
and the θ
day
was above 50%), and, (iii) Fine
& Dry (PPFD
day
was 35–45 mol m
–2
day
–1
and the θ
day
was
below 50%). The SFD
day
rate of 20–40 and 40–60 mm depth
was expressed based on the value of 0–20 mm depth as shown
in Figure 4. Henceforth, this percentage is referred to as the
SFD
day
ratio, if the depth profile of the SFD
day
ratio is constant
over a long period of time, measurement of SFD
day
at 0–20 mm
can be extrapolated to the whole profile, as proposed by Lu
et al. [19]. This is important, because measurements of SFD at
greater depths in the trunk are difficult, expensive and time-
consuming.
Values of SFD
day
decreased gradually from 0–20 mm toward
the center of the trunk in tree A and B in the suitable environ-
mental condition (Fine & Wet), as reported by Köstner et al.
[17] for Fagus sylvatica. However, values of SFD
day
increased
from 0–20 mm to 20–40 mm and then decreased toward the
center of the trunk in Tree C. This is a possible explanation for
the results reported by Phillips et al. [26] and Lu et al. [19].
During a prolonged period without rain, sap flux decreased
as the soil dried as has been observed by other authors [22, 24,
25, 28, 31, 32, 36]. The relative change in response of SFD
day
under drought conditions was essentially similar in all trees as
shown in Table II. However, the SFD
day
ratio of 20–40 mm
depth increased respectively 32%, 12% and 10% in Tree A,
Figure 3. Radial patterns of SFD
day
using Weibull function in the xylem. The radial depth is expressed as 0 at the cambium and 100% at the
center of the trunk. Width of each bar depends on the sensor length. The white bars graph shows measured values SFD
day
shown is a mean
value during fine weather conditions (PPFD
day
= 35–45 mol m
–2
day
–1
) and with abundant soil moisture. Dark bars are estimated values approxi-
mated by the Weibull function (solid curve in the figure).
294 M. Kubota et al.
B and C though changed the environmental condition (differ-
ences between Fine & Wet and Fine & Dry conditions) as shown
in Table II. This pattern is consistent with patterns found in
other diffuse-porous species [19]. In contrast, Phillips et al. [26]
found that as soil dried, the SFD ratio (20–40 mm/0–20 mm)
decreased about 20% in Pinus taeda L. from 44% to 36%. Thus,
although for a given tree a particular depth profile may remain
constant over a period of time, there is no universal profile for
all trees.
3.3. Potential generalization of radial patterns using
the Weibull function
As shown in bar charts of Figure 3, the relative sap flux den-
sity in a sequence of measurements with increasing depth in the
trunk are dependent on the exact location of each sensor and
individual tree characteristics, i.e., the pattern is different with
every tree. Assuming a general pattern according to the Weibull
function, the observations for all three trees are similarly
described. The Weibull function of response is compatible with
the reports of Nadezhdina et al. [20], Ford et al. [3] and Hunt
and Beadle [12] who measured the radial variation in flow
within the xylem in detail in several different tree species. Alto-
gether, the peak of the Weibull function and the peak of SFD
day
at intervals of 20 mm occurred in a different xylem depth.
Based on assumption that sap flow varies with depth according
to the Weibull function, the apparent conflicting results
obtained with diffuse-porous trees by Köstner [17] and Phillips
et al. [26] that propose different types of response with depth
in the trunk are resolved. Considering that the theoretical
response with depth described by the Weibull function permits
a changing position of the peak value in flow, the relationship
in flow between two sensors in the outer xylem may either show
a large difference or none at all.
Use of three sensors as in this study, demonstrates clearly
the decrease in flow in the inner xylem of beech and provides
adequate information for fitting of the Weibull response curve.
Table II. Mean of SFD
day
for each sensor insertion depth on typical environmental condition. SFD
day
ratio (%) (SFD
day
at 0–20 mm depth =
100%). Coefficients of Weibull function with different environmental condition.
Means of SFDday on typical condition
SFDday ratio (%)
(0–20 mm = 100%)
Coefficients of Weibull function
0–20 mm 20–40 mm 40–60 mm 20–40 mm 40–60 mm abcd
S.D. S.D. S.D.
Tree A Fin & Wet 2119 143 1661 157 757 121 78.4 35.7 2161 90.2 3.7 9.0
Cloud & Wet 1336 278 1080 204 455 116 80.8 34.1 1380 68.0 3.2 11.8
Fine & Dry 1461 34 1513 25 512 42 103.6 35.0 1761 61.2 3.8 19.0
Tree B Fin & Wet 2501 440 1368 280 293 84 54.7 11.7 2653 58.0 3.8 3.2
Cloud & Wet 1704 405 1028 240 134 68 60.3 7.9 1786 69.4 5.5 8.3
Fine & Dry 1283 34 791 17 208 4 61.7 16.2 1377 21.2 1.8 7.5
Tree C Fin & Wet 2057 260 2091 216 1174 278 101.7 57.1 2257 94.2 5.6 13.8
Cloud & Wet 1217 263 1402 323 807 247 115.2 66.3 1472 76.0 5.1 16.4
Fine & Dry 1519 42 1697 116 1169 48 111.7 76.9 1764 50.0 2.9 15.9
Figure 4. Depth profiles of SFD
day
ratio (%) (SFD
day
at 0–20 mm
depth = 100%) under three different sets of environmental conditions
(using data from June to September); (i) fine weather (PPFD
day
= 35–
45 mol m
–2
day
–1
) and abundant θ
day
(soil moisture content above
50%), (ii) cloudiness (PPFD
day
= 15–25 mol m
–2
day
–1
) and abundant
θ
day
, and (iii) fine weather (PPFD
day
= 35–45 mol m
–2
day
–1
) and
low θ
day
(soil moisture content below 50%).
Radial patterns of SFD of Fagus crenata 295
3.4. Radial patterns of SFD
day
using Weibull function
with different environmental condition
We continued our analysis of SFD
day
patterns in the same
trees by selecting very different environmental conditions as
well as the preceding clause. Results are shown in Figure 5 for
the fitted Weibull function obtained when: (i) Fine & Wet, (ii)
Cloud & Wet, and, (iii) Fine & Dry. As seen in the left panel
of the figure, the peak value of SFD
day
by Weibull function
decreased with all trees by ca. 35% because of the decrease in
the PPFD
day
(Fine & Wet versus Cloud & Wet). However, the
decrease of the peak value of SFD
day
under dry conditions (Fine
& Dry) was different in each tree, e.g. that for trees A and C
was ca. 20% that for tree B was ca.50%, indicating a large sen-
sitivity to soil drying. The degree of response probably has to
do with the rooting of individual trees and competition for water
with neighboring trees and understory shrubs.
Finally, the radial patterns obtained with different environ-
mental conditions were converted into relative values in which
the peak value of the Weibull function was assumed to be 100%
as shown in Figures 5D–5F. A shift in the Weibull relationship
effectively describes changes in SFD
day
with both differing
PPFD input and water availability. In particular, the radial pat-
terns differed when θ
day
availability changed at high PPFD
day
.
The peak value of the Weibull function shifted inner 10%, 4%
and 2% in the relative xylem depth in the Tree A, B and C,
respectively. At least, the increase of SFD
day
ratio of 20–
40 mm depth takes part in shifting the peak of the Weibull func-
tion. However, this point is not conclusive because there were
no observations deeper than 60 mm.
The SFD
day
peak value may have moved toward the interior
as observed for all trees when the soil water dries. Becker [1]
and Nadezhdina et al. [20] reported that the decrease in sap flux
caused by dry soil differed between the inside and outside of
Figure 5. Radial patterns of SFD
day
using Weibull function under the three different sets of environmental conditions (the same environmental
condition as Fig. 4) The radial pattern variation of SFD
day
(as shown in D-F) was converted to a relative value in which the peak value of
SFD
day
was assumed to be 100%.
296 M. Kubota et al.
the xylem. On the other hand, Kubota et al. [18] did observe a
differential recovery in flow in the inner and outer xylem after
drought. Thus, further study with greater spatial resolution is
needed. Nevertheless, even with drying, the shift in the fitted
function was small, supporting the use of the Weibull function
as a means for integration of what first appears as relatively het-
erogeneous data and, therefore, for scaling up of individual tree
responses to stand level.
Acknowledgments: We thank Mr. Burkhard Stumpf, Dr. M. Naramoto,
Mr. A. Iio and the members of the Institute of Silviculture, University
of Shizuoka for field support, especially by sensor installations. This
research was supported by the Ministries of Agriculture, Forestry and
Fisheries of Japan, by a Grant-in-Aid for Scientific Research
(No. B13460067) from the Special Coordination Funds of the Minis-
try of Education, Culture, Sports, Science and Technology of Japan,
by the German Ministry for Education, Science, Research and Tech-
nology support to the Bayreuth Institute for Terrestrial Ecosystem
Research (BMBF, PT BEO – 0339476 C), and by the University of
Bayreuth Educational Association.
REFERENCES
[1] Becker P., Sap flow in Bornean heath and dipterocarp forest trees
during wet and dry periods, Tree Physiol. 16 (1996) 295–299.
[2] Cermák J., Cienciala E., Kucera J., Lindroth A., Hallgren J E.,
Radial velocity profiles of water flow in stems of spruce and oak
and response of spruce tree to severing, Tree Physiol. 10 (1992)
367–380.
[3] Ford C.R., McGuire M.A., Mitchell R.J., Teskey R.O., Assessing
variation in the radial profile of sap flux density in Pinus species
and its effect on daily water use, Tree Physiol. 24 (2004) 241–249.
[4] Granier A., Une nouvelle méthode pour la mesure de flux de sève
brute dans le tronc des arbres, Ann. Sci. For. 42 (1985) 193–200.
[5] Granier A., Evaluation of transpiration in a Douglas fir stand by
means of sap flow measurements, Tree Physiol. 3 (1987) 309–320.
[6] Granier A., Anfodillo T., Sabatti M., Cochard H., Tomasi M.,
Valentini R., Bréda N., Axial and radial water flow in the trunk of
oak trees: a quantitative and qualitative analysis, Tree Physiol. 14
(1994) 1383–1396.
[7] Granier A., Loustau D., Measuring and modelling the transpiration
of a maritime pine canopy from sap-flow data, Agric. For. Meteo-
rol. 71 (1994) 61–81.
[8] Granier A., Biron P., Bréda N., Pontailler J.Y., Saugier B., Trans-
piration of trees and forest stands: short and long-term monitoring
using sapflow methods, Glob. Change Biol. 2 (1996) 265–274.
[9] Granier A., Biron P., Lemoine D., Water balance, transpiration and
canopy conductance in two beech stands, Agric. For. Meteorol. 100
(2000) 291–308.
[10] Granier A., Aubinet M., Epron D., Falge E., Umundsson J., Jensen
N.O., Köstner B., Matteucci G., Pilegaard K., Schmidt M., Tenhunen
J., Fluxes of carbon, water and energy of European forests, in: Eco-
logical Studies, Vol. 163, Springer-Verlag, Berlin, Heidelberg,
2003, pp. 55–70.
[11] Habermehl A., Hüttermann A., Lovas G., Ridder H W., Computer
Tomographie von Bäumen, Biologie in unserer Zeit 4 (1990) 193–
200.
[12] Hunt M.A., Beadle C.L., Whole-tree transpiration and water-use
partitioning between Eucalyptus nitens and Acacia dealbata weeds
in a short-rotation plantation in northeastern Tasmania, Tree Phy-
siol. 18 (1998) 557–563.
[13] Kakubari Y., Beech forests in the Naeba Mountains: Distribution of
primary productivity along the altitudinal gradient, in: Shidei J.,
Kira T. (Eds.), Primary productivity of Japanese forest, JIBP Syn-
thesis, Vol. 16, Univ. Tokyo Press, 1977, pp. 201–212.
[14] Kakubari Y., Primary productivity changes for a fifteen-year period
in a natural beech (Fagus crenata) forest in the Naeba mountains,
J. Jpn. For. Soc. 73 (1991) 370–374.
[15] Knights D.H., Fahey T.J., Running S.W., Harrison A.T., Wallace
L.L., Transpiration from 100-yr-old lodge pole pine forests estima-
ted with whole-tree porometers, Ecology 62 (1981) 717–726.
[16] Köstner B., Biron P., Siegwolf R., Granier A., Estimates of water
vapor flux and canopy conduce of Scots pine at the tree level utili-
zing different xylem sap flow methods, Theor. Appl. Climatol. 53
(1996) 105–113.
[17] Köstner B., Granier A., Cermák J., Sap flow measurements in forest
stands: methods and uncertainties, Ann. Sci. For. 55 (1998) 13–27.
[18] Kubota M., Tenhunen J., Zimmermann R., Schmidt M., Adiku S.,
Kakubari Y., Influences of environmental factors on the radial pro-
file of sap flux density in Fagus crenata growing at different elevations
in the Naeba Mountains, Japan, Tree Physiol. 25 (2005) 537–548.
[19] Lu P., Muller W.J., Chacko E.K., Spatial variations in xylem sap
flux density in the trunk of orchard-grown, mature mango trees
under changing soil water conditions, Tree Physiol. 20 (2000) 683–
692.
[20] Nadezhdina N., Cermák J., Ceulemans R., Radial patterns of sap
flow in woody stems of dominant and understory species: scaling
errors associated with positioning of sensors, Tree Physiol. 22
(2002) 907–918.
[21] Oliveras I., Llorens P., Medium-term sap flux monitoring in a Scots
pine stand: analysis of the operability of the heat dissipation method
for hydrological purposes, Tree Physiol. 21 (2001) 473–480.
[22] Oren R., Zimmermann R., Terborgh J., Transpiration in upper
Amazonia floodplain and upland forests in response to drought
breaking rains, Ecology 77 (1996) 968–973.
[23] Oren R., Phillips N., Katul G., Ewers B.E., Pataki D.E., Scaling
xylem sap flux and soil water balance, and calculating variance: a
method for partitioning water flux in forests, Ann. Sci. For. 55
(1998) 191–216.
[24] Oren R., Pataki D.E., Transpiration in response to variation in
microclimate and soil moisture in southeastern deciduous forests,
Oecologia 127 (2001) 549–559.
[25] Pataki D.E., Oren R., Smith W.K., Sap flux of co-occurring species
in a western subalpine forest during seasonal soil drought, Ecology
81 (2000) 2557–2566.
[26] Phillips N., Oren R., Zimmermann R., Radial patterns of xylem sap
flow in non-, diffuse- and ring-porous tree species, Plant Cell Envi-
ron. 19 (1996) 983–990.
[27] Phillips N., Oren R., A comparison of daily representations of
canopy conductance based on two conditional time-averaging
methods and the dependence of daily conductance on environmen-
tal factors, Ann. Sci. For. 55 (1998) 217–235.
[28] Phillips N., Bond B.J., McDowell N.G., Ryan M.G., Canopy and
hydraulic conductance in young, mature and old Douglas-fir trees,
Tree Physiol. 22 (2002) 205–211.
[29] Roberts J., The use of tree-cutting techniques in the study of the
water relations of mature Pinus sylvestris L., J. Exp. Bot. 28 (1977)
751–767.
[30] Schafer V.R.K., Oren R., Tenhunen J., The effect of tree height on
crown level stomatal conductance, Plant Cell Environ. 23 (2000)
365–375.
[31] Schulze E D., Cermák J., Matyssek R., Penka M., Zimmermann
R., Vasicek F., Gries W., Kucera J., Canopy transpiration and water
fluxes in the xylem of the trunk of Larix and Picea trees – a com-
parison of xylem flow, porometer and cuvette measurements,
Oecologia 66 (1985) 475–483.
[32] Schulze E D., Flux Control in Biological System, Academic Press,
New York, 1994, pp. 203–235.
[33] Tetens O., Uber einige meteorologische Begriffe, Z. Geophys. 6
(1930) 297–309.
[34] Whitehead D., Teskey R.O., Dynamic response of stomata to chan-
ging irradiance in loblolly pine (Pinus taeda L.), Tree Physiol. 15
(1995) 245–251.
[35] Zhang L., Dawes W.R., Hatton T.J., Modelling hydrologic proces-
ses using a biophysically based model - application of WAVES to
FIFE and HAPEX-MOBILHY, J. Hydrol. 185 (1996) 147–169.
[36] Zimmermann R., Schulze E D., Wirth C., Schulze E E., McDonald
K.C., Vygodskaya N.N., Ziegler W., Canopy transpiration in a
chronosequence of Central Siberian pine forests, Glob. Change
Biol. 6 (2000) 25–37.