Báo cáo lâm nghiệp: "Sessile oak (Quercus petraea Liebl.) site index variations in relation to climate, topography and soil in even-aged high-forest stands in northern France" doc
Bạn đang xem bản rút gọn của tài liệu. Xem và tải ngay bản đầy đủ của tài liệu tại đây (867.2 KB, 12 trang )
391
Ann. For. Sci. 62 (2005) 391–402
© INRA, EDP Sciences, 2005
DOI: 10.1051/forest:2005035
Original article
Sessile oak (Quercus petraea Liebl.) site index variations in relation
to climate, topography and soil in even-aged high-forest stands
in northern France
Laurent BERGÈS
a
*, Richard CHEVALIER
a
, Yann DUMAS
a
, Alain FRANC
b
, Jean-Michel GILBERT
c
a
Cemagref, Forest Ecosystems Research Unit, Domaine des Barres, 45290 Nogent-sur-Vernisson, France
b
INRA, Département Ecologie des Forêts, Prairies et Milieux Aquatiques, CDA UMR Biodiversité, Gènes et Écosystèmes,
69 route d’Arcachon, Pierroton, 33612 Cestas Cedex, France
c
Ministère de l’Agriculture, de l’Alimentation, de la Pêche et de la Ruralité, Direction Générale de la Forêt et des Affaires Rurales,
19 avenue du Maine, 75732 Paris Cedex 1507 SP, France
(Received 5 April 2004; accepted 2 March 2005)
Abstract – The relationships between Q. petraea site index and site variables were studied using data from 99 even-aged high-forest stands
located in north-western and north-eastern France. Stepwise multiple regressions using climate, topography and soil factors were adjusted and
explain 49 to 60% of the variance in site index. This clearly demonstrates that an autecological study can be successfully performed over a large
geographical area if an appropriate sampling strategy is applied. Moreover, the autecology of sessile oak was specified: (1) the role of soil water
capacity, topographic position, log(Mg), log(S), K/P
2
O
5
, Mg/K and humus form was emphasized; (2) no regional differences in site index were
observed, which was corroborated by few climatic effects; (3) models adjusted to each region were consistent; (4) nutrient factors explained a
higher portion of variance of Q. petraea site index compared to climate/water-related factors, however the confounding effect was significant.
site index / ecological factors / soil analyses / Quercus petraea (Mattus) Liebl.
Résumé – Variations de l'indice de fertilité du chêne sessile (Quercus petraea Liebl.) en fonction du climat, de la topographie et du sol
dans des futaies régulières adultes du nord de la France. Les relations entre l’indice de fertilité de Q. petraea et le milieu ont été étudiées
dans 99 peuplements de futaies régulières adultes du centre-ouest et nord-est de la France. Des régressions multiples pas à pas basées sur le
climat, la topographie et le sol expliquent de 49 à 60 % de la variance de l’indice de fertilité. Ce résultat indique clairement qu’une étude
autécologique peut être menée avec succès sur un grand secteur géographique si une stratégie d’échantillonnage adaptée est appliquée. De plus,
l’autécologie du chêne sessile est précisée : (1) nous soulignons le rôle de la réserve utile en eau du sol, de la position topographique, de log(Mg),
log(S), K/P
2
O
5
, Mg/K et du type d’humus sur l’indice de fertilité ; (2) aucune différence inter-régionale n’est observée sur l’indice de fertilité,
ce qui est corroboré par le faible effet du climat sur la croissance ; (3) les modèles prédictifs ajustés au niveau de chaque région sont très
proches ; (4) la part de variance de l’indice de fertilité expliquée par le niveau trophique est plus élevée que celle liée aux facteurs hydriques et
climatiques, mais la part commune expliquée par ces trois facteurs est importante.
indice de fertilité / facteurs écologiques / analyses de sol / Quercus petraea (Mattus) Liebl.
1. INTRODUCTION
The potential productivity in various site conditions is one
of the most important criteria for decision making in forest
management [49]; it allows the forester to select the most sui-
table crop species, to precisely forecast stand production and
to make species-specific and site-specific silvicultural pres-
criptions (rotation age, intensity and frequency of thinnings)
[48]. Knowledge of the species response to site conditions
could help identify particular sites on which the species is or
may become unsuitable, especially in the context of climate
warming and/or nitrogen deposition.
Potential productivity for a given species has been widely
assessed by site index measurement, defined as the top height
of dominant trees at a reference age for forest stands which are
regular, even-aged, pure and closed [34].
Systems for evaluating site quality and predicting forest pro-
ductivity based on site-growth relationships have received con-
siderable attention over the past 50 years [64]. Numerous
studies, known as soil-site studies, have focused on predicting
site index in various ecological conditions and forest species
[22, 25].
In France, most of these studies are being criticised because
they have not provided enough precise results in spite of their
relatively high cost. The main drawback is that a large varia-
bility can persist within forest site types in a study which relates
site index to a pre-established forest site type classification
* Corresponding author:
Article published by EDP Sciences and available at or />392 L. Bergès et al.
(= synoptic approach). This variability may be related to the
heterogeneity of the soil water capacity within the site types
[29]. But when sampling data are stratified according to soil water
capacity, the precision of the results delivered with a synoptic
approach can be as good as with an analytical approach that
directly links ecological descriptors to site index [29].
The quality of the results mainly depends on 4 factors: (1) the
species’ ecological range, which determines the magnitude of
the response to site variations; (2) the sampling strategy applied
(an extended range of forest site types, equal sampling in each
forest site type or regular distribution along the ecological gra-
dients is recommended), (3) the stand selection (stands must
follow Eichhorn’s rule) [34] and (4) the quality of the collected
data.
The problem of spatial scale has also been widely discussed
[21]. Most of the studies on tree species in lowland forests have
been restricted to small regions where climatic variability is
reduced. Only a few studies cover large regions [29, 38, 51].
More accurate results are expected if studies are restricted to
small areas with little climatic and geomorphologic variability
and understory vegetation is used to diagnose site quality.
However, restricting the study to a small, climatically uniform
region is questionable when site diagnosis is not based on
understory layer [35] or when the study is located in mountai-
nous regions where altitude, aspect and topography are the
main ecological gradients [10, 29]. Indeed, most of the studies
have limited success in accounting for site index variation over
large areas [23, 66]. In addition, only a few test the hypothesis
that enlargement of the study area could cause a decrease in site
index prediction quality [23, 29].
Sessile oak (Quercus petraea Liebl.) is the most widespread
and important deciduous timber species in France; together
with pedunculate oak (Q. robur L.), it represents 30.5% of the
forest surface and 28% of the standing volume [44]. Sessile oak
has adapted to a large range of ecological conditions. It displays
a different, larger ecological amplitude compared to peduncu-
late oak: it is less nutrient-demanding, more tolerant to drought
but less tolerant to the presence of calcium carbonate in soils
[8, 17, 26, 42, 65]. Young sessile oaks are less tolerant to water-
logging in the soil than pedunculate oaks; however, adult ses-
sile oaks show a better growth in waterlogged soils that are
frequently exposed to summer drought, because drought is a
more limiting factor than watterlogging for pedunculate oaks
[58]. Recent studies have been restricted to particular forests
or small natural regions [20, 46], except for one in north-wes-
tern France which focused on radial growth [56]. Most of them
have been carried out by students from the French Forest Engi-
neering School (ENITEF) but have not been published in
French or international journals. An extrapolation of the results
to a large area, a clarification of the role of the climate, soil
water regime and nutrient richness in predicting sessile oak
growth and an estimate of the magnitude of their effects [41]
are necessary.
The objectives of this study are: (1) to test the feasibility of
a study on the relationships between site index and ecological
factors over a large territory (550 by 250 km), i.e., 9 “départe-
ments” and 12 “régions IFN” and (2) to quantify the respective
effects of radiation, water and nutrient budgets on sessile oak
site index.
Our hypothesis is that accurate site index predictions can be
made even if the study area is large if the following rules are
respected: (1) to cross soil water content and nutrient status in
a balanced sampling design, (2) to sample regularly along these
ecological gradients and especially in edges and (3) to collect
high-quality ecological indices.
2. MATERIALS AND METHODS
2.1. Sampling strategy and study area
In order to accurately analyse the relationships between ecological
parameters and growth variables, we chose to use an analytical
approach [40] and to precisely assess the three main budgets for wood
production: radiation, water and nutrients [28]. However, this does not
mean that these budgets are easy to estimate (for example, numerous
input parameters – climatic, topographic and soil – are required to esti-
mate water budget). As recommended by Franc and Houllier [34], a
sampling strategy was defined to: (1) explore the largest site variations
possible regarding soil water capacity and mineral nutrient conditions;
(2) respect an orthogonal sampling plan, i.e., a complete, balanced two-
factor plan for soil water and mineral richness which would allow a
proper estimation of the main effects and their interaction and (3) limit
the effects of other factors, especially those related to silvicultural
practises; we only sampled adult (> 60 years), nearly pure, even-aged,
closed, high-forest stands of oaks grown from seedlings. Stands were
selected according to official information on the origin of the stand
(seedling or sprout) in the forest management plan (if available) and/
or by observing stem form (absence of twin stems within the stand).
However, in order to find site conditions that were infrequent but nec-
essary for statistical analyses, some variation in purity and even-age
characteristics of the oak stands was accepted. In this case, at least 60%
of the dominant trees were either sessile or pedunculate oaks (the nor-
mal criterion was 80%) and the age variation of the dominant trees was
less than 10% of the mean age [31]. Height plots did not meet this last
condition but were retained because of particular site conditions.
The general study area partly covers the South-east of the Paris
Basin and the North-east of France. Within this area, a previous cli-
matic analysis published by Gilbert and Franc [39] helped us to define
two distinct, climatically homogeneous regions using relative annual
water budgets (see Fig. 1): the eastern region where the annual water
deficit was under 15% (“Lorraine” and “Alsace” administrative
“Régions”, “Alsace Plain” excluded), and the western region where
the annual water deficit was over 15% (“Centre” and “Pays-de-Loire”
Régions). Despite this climatic stratification, moderate climatic vari-
ations remained within the study area. The calculation for the annual
water deficit is detailed in Gilbert and Franc [39] who used climatic
means for the 1961–1990 period from the French meteorological sta-
tions network. The water balance model is based on the following algo-
rithm where PET: potential evapotranspiration, AET: actual
evapotranspiration, P: precipitation and SWC: soil water capacity.
Monthly potential evapotranspiration (PETm) is calculated using
Thornthwaite or Turc’s formula. If Pm ≥ PETm then AETm = PETm.
If Pm < PETm then soil water reserve is used and the amount of water col-
lected is a function of the water deficit accumulated over the previous
months: in this case, AETm = Pm + P
SWC
m, where P
SWC
is the portion
of the soil water capacity that is collected. When the period of water
deficit is finished, the extra-water not transpired by the plant is used
first to reconstitute the soil water reserve, then is flown out of the sys-
tem. Finally, the annual soil water deficit is computed as follows:
.
AETm PETm–()
PETm
-
m 1=
12
∑
Sessile oak site index variations to soil and climate 393
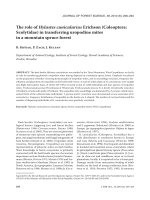
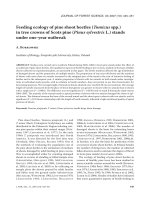
Figure 1. Geographical location of the 99 plots sampled in the two regions (East and West). The number of plots sampled by forest or group of forests is provided.
394 L. Bergès et al.
The following site factors were fixed or controlled during field
operations: the upper altitudinal limit was fixed at 500 m (the northern
“Vosges” mountains were the highest points); waterlogged conditions
were controlled and we only selected stands where (1) temporary
waterlogging below 50 cm was present whatever the intensity of the
gleyed layer discoloration or (2) temporary waterlogging above 50 cm
was present but with very moderate gleyed layer discoloration. Other
ecological factors (topographic position, aspect, parent material, soil
texture and type) were not stratified but only measured; this allowed
us to test their effect on tree growth.
Though the final sampling design was composed of 99 plots, it was
incomplete and unbalanced. More precise measurements were done
on these 99 plots.
2.2. Site index measurement
Twenty-meter-radius circular plots (0.126 ha) were set up within
homogeneous site conditions following Brêthes’ recommendations
[21]. When site conditions were not sufficiently homogeneous, the
sample plot area was reduced to 0.07 ha (a 15-m-radius circular plot
or rectangle).
Dominant height (H
0
) was measured using a variant of Duplat’s
protocol [31] that is normally based on the measurement of the 1st,
3rd and 5th biggest trees on a 0.06-ha plot to estimate the mean height
of the 100 biggest trees per ha. We identified the 6 biggest trees in the
circular plot and randomly chose 3 oaks among the following 3 cou-
ples: 1st and 2nd, 3rd and 4th and 5th and 6th. This provided an esti-
mate of the mean height of the population which approached the
50 biggest trees per ha. We chose one tree in each couple as a com-
promise between systematic selection and to avoid coring very high-
quality trees. The total height of each tree was estimated from two
opposite sides at a variable distance from the tree by measuring angular
characteristics with a clinometer. Tree height measurement error was
less than 0.7 m. Each tree was cored twice to the pith with a 5-mm
Pressler corer at a height of 1 and 1.10 m. Cores were made in the same
direction to ensure a very short distance from the pith. Following
Duplat and Tran-Ha’s recommendations [30], 4 years were added to
the age counted on the best increment core to obtain a tree age at 0.30 m
height. The height and age of the 3 measured trees were averaged to
assess plot dominant height (H
0
) and mean age. Site index was com-
puted with a reference age of 100 years (called SI
100
below) using
height-age curves (model B) from Duplat and Tran-Ha [30] (Fig. 2).
2.3. Climate and soil data collection
Monthly median precipitation and mean temperature for the 1961–
1990 period were provided by Meteo France and came from two data-
bases: (1) for 36 eastern plots, digitised data from thematic maps
(AURELHY method) with a resolution of 1 km
2
; (2) for the remaining
16 eastern plots, data came from 5 stations for precipitation and 2 sta-
tions for temperature and for the 47 western plots, data came from
5 stations for temperature and from 13 stations for precipitation. Sev-
eral climatic indices were computed (see Tab. I).
Topographic characteristics, elevation, slope, aspect, topographic
position and parent material were measured in the field or collected
on suitable maps. Humus form was described in three different loca-
tions according to the Pedological Reference frame classification [45].
According to Llyod et Lemmon [60] aspect was transformed into a
continuous variable for plots where aspect was over 4% using the fol-
lowing formula: Aspect = cos(RA–A), where A is the plot azimuth and
RA is a given reference azimuth (in grades); Aspect = 1 if A = RA and
–1 if A = RA ± 200; a value of 0 for Aspect was assigned to plots
where slope was less than 4%. The RA is known to be between north
and east [6, 60] and was optimised for our data by calculating the max-
imum correlation between SI
100
and Aspect: it was 75 gr.
A soil pit, 2 m in depth, was excavated with a mechanical shovel
at a distance of 3 m from one of the cored trees. Digging was continued
until an R-horizon (bedrock) was reached. Two plots were dug man-
ually because access for the shovel was impossible: these two plots
had very shallow soil. Soil profile was described using a standard pro-
tocol, which included observations on the intensity and location of an
HCl effervescence (localised or generalised effervescence of the fine
soil fraction), size and percentage of coarse elements, soil drainage
assessed by hydromorphic mottling using Baize and Jabiol’s classifi-
cation [2].
In order to carry out complementary physical and chemical analy-
ses, A-horizon soil samples were collected in 5 locations within the
plot. Soil samples were air-dried, then sieved at 2 mm. Soil particle
size distribution was determined on mineral horizons using the
hydrometer method. The following chemical analyses were performed
according to recommendations from Gégout and Jabiol [37]: pH-H
2
O,
pH-KCl 1 N, cationic exchangeable capacity at soil pH, exchangeable
Ca, Mg, K, Al and H
+
, total organic carbon C, total organic nitrogen
N and potentially available phosphorous. Analytical results were
expressed as concentrations over dry-mass (cmol
+
/kg for cations and
g/kg for C, N and P
2
O
5
). Saturation rate of the absorbing complex,
C/N ratio and several mineral element content ratios identified as
important for tree nutrition were also calculated [15].
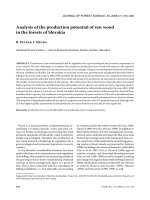
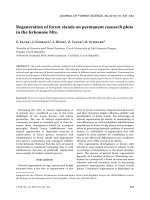
Figure 2. Modelisation of sessile oak dominant height as a function
of stand age according to model B of Duplat and Tran-Ha [30]. Sim-
ulation of H
0
as a function of age for 5 site indices at the reference
age of 100 years (15, 20, 25, 30 and 35 m) and data observed (East
and West samples).
Sessile oak site index variations to soil and climate 395
Soil water capacity, i.e., plant-available water between field capac-
ity and the permanent wilting point, was calculated using Jamagne’s
coefficients [47] and the classic formula given by Lévy [59]. C, M, R
and D-horizons also contain a small quantity of water that was taken
into account only if fine roots were observed in the horizons. We used
specific, arbitrary coefficients for the C-horizon of granite arenas
(0.6 mm/cm), Mn-horizons of marl (0.5 mm/cm) and R-horizon of soft
sandstone (0.2 mm/cm).
2.4. Data analysis methods
The effect of SWC, climate and soil nutrients on site index were
first analysed using ANOVA, linear or polynomial regressions. This
allowed us to detect the nature of the relationship between site index
and explanatory variables. Then, stepwise multiple regressions were
used to test the additive effects of these factors. Models were adjusted
to each regional sample then to the whole sample. Specific two-way
Table I. Elementary statistics of forest mensuration and ecological data (see text for further explanation for variable description and computa-
tion). Ecological data are separated into climatic and soil data. Chemical data were measured in the A-horizon. The different classes used are
provided and the number of plots per class are mentioned between brackets.
Total Eastern region Western region
Variable name and unit Code Min Mean ± SD Max Mean ± SD Mean (± SD)
Number of plots n = 99 n = 52 n = 47
Stand characteristics
Age (at 0.30 m) Age 56 110.7 ± 26.6 187 114.8 ± 30.0 106.2 ± 21.8
Site index at 100 years (m) SI
100
12.1 25.3 ± 4.6 34.8 24.9 ± 4.9 25.8 ± 4.2
Basal area at 1.30 m (m
2
/ha) G 13.1 27.2 ± 6.3 53.3 27.4 ± 6.8 27.1 ± 5.8
Climatic data
Mean annual temperature (°C) MAT 8.4 10.0 ± 1.0 11.1 9.1 ± 0.4 11.1 ± 0.1
Median annual precipitation (mm) MAP 644 793 ± 114 1008 881 ± 80 695 ± 40
PET-P from April to October (mm) PET-P 53.0 115.0 ± 42.1 199.0 81.7 ± 25.8 152 ± 20
Soil water deficit (mm) SWD 11.4 68.3 ± 45.8 181.5 30.8 ± 17.4 109.7 ± 28.2
Altitude (m) Altitude 85 224 ± 109 476 314 ± 68 124 ± 32
Aspect (after cos transformation) Aspect –1.00 –0.02 ± 0.53 1.00 –0.02 ± 0.59 –0.02 ± 0.46
Topographic position (3 classes with
L: lateral loss; G: lateral gain)
Topo L > G (n = 13); G = L (n = 75);
G > L (n = 11)
L > G (n = 10); G = L (n = 34);
G > L (n = 8)
L > G (n = 3); G = L
(n = 41); G > L (n = 3)
Physical and chemical soil properties
Soil depth (cm) SD 35 159 ± 38 200 156 ± 48 162 ± 25
Stone content (%) SC 0-150 0 28.6 ± 24.5 91.0 21.3 ± 24.3 36.7 ± 22.3
Soil water capacity on 150 cm (mm) SWC 0-150 5 153 ± 69.7 275 156 ± 81 149 ± 56
pH-H
2
OpH-H
2
O 3.94 4.69 ± 0.66 7.13 4.76 ± 0.58 4.60 ± 0.74
pH-KCl 1N pH-KCl 2.80 3.72 ± 0.75 6.28 3.77 ± 0.68 3.66 ± 0.82
Exchangeable calcium (cmol
+
/kg) Ca 0.07 4.86 ± 8.36 47.00 4.95 ± 8.12 4.76 ± 8.71
Exchangeable magnesium (cmol
+
/kg) Mg 0.05 0.92 ± 0.91 5.44 0.85 ± 1.04 1.00 ± 0.75
Exchangeable potassium (cmol
+
/kg) K 0.07 0.35 ± 0.23 1.08 0.37 ± 0.27 0.32 ± 0.16
Exchangeable base sum (cmol
+
/kg) S 0.20 6.13 ± 9.08 49.83 6.17 ± 9.00 6.08 ± 9.27
Exchangeable proton (cmol
+
/kg) H
+
0.05 1.08 ± 1.01 5.28 0.74 ± 0.50 1.47 ± 1.28
Exchangeable aluminium (cmol
+
/kg) Al 0.05 1.54 ± 1.37 7.68 1.58 ± 1.29 1.50 ± 1.47
Cationic exchange capacity (cmol
+
/kg) CEC 2.22 10.20 ± 9.71 57.62 9.99 ± 9.60 10.43 ± 9.93
Saturation rate (%) S/T 4.7 50.4 ± 32.8 100 47.7 ± 34.6 53.5 ± 31.1
Organic carbon (g/kg) C 17.1 58.4 ± 37.5 236.9 42.6 ± 14.8 75.8 ± 46.6
Nitrogen (g/kg) N 0.91 3.30 ± 1.67 10.25 2.78 ± 1.09 3.88 ± 2.00
C/N C/N 8.52 17.47 ± 4.61 37.55 16.05 ± 3.96 19.06 ± 4.80
Phosphorous (g/kg) P
2
O
5
0.02 0.13 ± 0.11 0.82 0.16 ± 0.15 0.10 ± 0.04
Humus form (5 classes) Humus 1- Dysmoder-Mor (n = 25); 2- Eumoder
(n = 16); 3- Oligomull to Hemimoder
(n = 22); 4- Mesomull (n = 13);
5- Eumull (n = 23)
1 (n = 7); 2 (n = 6); 3 (n = 15);
4 (n = 4); 5 (n = 20)
1 (n = 18); 2 (n = 10);
3 (n = 7); 4 (n = 9);
5 (n = 3)
396 L. Bergès et al.
ANOVA were also adjusted to test the interaction between soil water
and nutrient-related factors. Variance homogeneity and distribution of
residuals were visually checked.
Multiple regression fitting was followed by variance partition using
Type I sum of squares, which allows the respective parts of the 3 basic
budgets (climate, water and nutrients) and the confounding part of
these factors to be quantified. The variables were clustered into
2 groups: climate/water-related and nutrient-related factors. The mod-
els were successively fitted (1) with first the climate/water group and
second the nutrients group entered into the model (2) then the contrary.
ANOVA, simple and multiple stepwise regressions were per-
formed using S-plus version 6.2
®
.
3. RESULTS
3.1. Sampling characteristics
Elementary statistics for forest mensuration, climate and soil
variables are presented in Table I. The 8 basic humus forms
were grouped into 5 simplified classes for analysis purposes.
Plot age distribution was dispersed but 84% of the plots were
80 to 130 years old (Fig. 2). Site index was more variable com-
pared to Duplat and Tran-Ha’s observations [30]: these authors
indicated that site index at 100 years varied between 15.1 and
30.7 m and plot age varied between 102 and 216 years. The
comparison of the two samples was not rigorous because age
ranges were not similar in both data sets. However, minimum
SI
100
corresponded to the same ages. After eliminating the
youngest plots (the maximum SI
100
was 34.8 m for a 56-year-
old plot), maximum site index was higher compared to Duplat
and Tran-Ha’s sample [30] because a 135-year-old plot with
SI
100
= 33.9 m was included. The lowest SI
100
in our sample
corresponded to extremely poor site conditions not sampled by
Duplat et Tran-Ha [30].
3.2. Relationships between site index and ecological
variables
3.2.1. Role of soil water capacity and topographic
position
SI
100
was correlated with SWC (Tab. II). Complementary
analyses not presented here allowed us to keep the SWC com-
puted to a depth of 150 cm (called below SWC 0-150) as the
SWC reference value in the next analyses. SI
100
increased by
3.2 m when SWC 0-150 increased by 100 mm.
SI
100
was correlated with topography (Tab. II): compared to
neutral positions (gain = loss), site index was reduced (–3.8 m)
in deficit positions (loss > gain) whereas it increased (+2.7 m)
in favourable positions (gain > loss).
3.2.2. Role of climatic factors, water balance and soil
water deficit
Aspect had an effect on site index, but the effect is more sig-
nificant if only plots where slope was over or equal to 4% were
kept (Tab. II): site index was reduced (–2.9 m) when aspect was
275 gr and it increased (+2.9 m) when aspect was 75 gr, com-
pared to neutral aspects (175 or 375 gr). However, precipita-
tion, temperature, altitude, PET-P or SWD had no significant
effect on SI
100
.
3.2.3. Role of nutrient richness
Humus form had a strong effect on SI
100
(31% of the vari-
ance explained): growth was low on extreme humus forms
(eumull and dysmoder-mor) and high on oligomull-to-hemi-
moder, but no significant differences were found between meso-
mull, eumoder and oligomull-to-hemimoder (Fig. 3).
Simple or polynomial regressions were fitted after graphical
observation of SI
100
= f(X) and after log transformation for
exchangeable cations (Tab. II). The relationship between SI
100
and S/T, pH-KCl or pH-H
2
O was parabolic, with an optimum
value around 50% for S/T.
According to the threshold values provided by Bonneau
[15], the proportion of plots low in K and Ca was large but this
was less important for Mg. More than 50% of the eastern plots
and about 75% of the western plots were K-deficient. But the
percentage of plots where Ca and Mg were deficient or in excess
was similar in both regions. The comparison to threshold values
that correspond to analysis at pH = 7 was correct because soil
measurement at pH = 7 does not overestimate real exchangea-
ble Mg and Ca contents for acidic soils. However, this is not
the case for CEC [24]. The relationships between exchangeable
cation contents and site index were more often significant com-
pared to the synoptic variables mentioned above (Tab. II). The
variables log(Ca), log(Mg) and log(S) were the best predictors
of SI
100
, providing parabolic models with flat convexity.
Growth reduction was more pronounced for high values than
for low ones because residuals were less spread for high values.
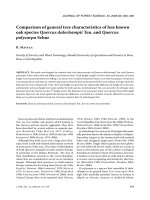
Figure 3. Boxplot of site index (SI
100
) according to humus form: the
thick horizontal line within the box corresponds to the median and the
cross corresponds to the mean; the letter above each class indicates
the result of pairwise multiple comparisons (Tukey method).
Sessile oak site index variations to soil and climate 397
Lastly, SI
100
was not correlated with C/N ratio, decreased
with increasing K/P
2
O
5
and displayed a parabolic, convex res-
ponse to Mg/K.
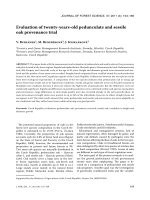
Regressions for each soil type (with and without a carbon-
ated horizon) between SI
100
and several nutrient descriptors
(Tab. II and Fig. 4) showed that soil types could be distin-
guished on the graph representing SI
100
as a function of
log(Ca). SI
100
decreased with increasing log(Ca) on soils with
a carbonated horizon. However, the other soil types still
showed a curvilinear relationship between SI
100
and log(Ca).
SI
100
decreased with increasing Ca/Mg and Mg/K only on soils
with a carbonated horizon (Tab. II). In contrast, SI
100
decreased with increasing K/P
2
O
5
only on soils without any
carbonated horizon.
3.3. Additive effects of ecological variables on site index
3.3.1. East region (E1 à E4)
The models contained either 2 or 3 predictors (Tab. III). Cli-
matic water balance (PET-P) had a negative effect and SWC
0-150 had a positive effect on SI
100
(E1). Topographic position
had an additive effect on SI
100
which increased by 5.2 m from
a deficit position to a neutral position and increases further by
1.1 m in a favourable position. SI
100
was optimum when S was
between 1.08 and 1.35 cmol
+
/kg (E2-E3) or when Mg was
0.41 cmol
+
/kg (E4). SI
100
was optimum when humus form was
mesomull (E3-E4) and higher on eumull compared to eumoder.
The best models in this region explained 74% of site index var-
iance (E3 and E4).
Table II. Results of the simple or polynomial regressions between SI
100
and different soil, climate and topography variables for the whole
sample and for soils with or without a carbonated horizon. Chemical soil variables were measured on A-horizon. The variables for the whole
sample are given in ascending order of R
2
.
Variable Model equation R
2
p > F SE (m)
Whole sample (n = 99)
Aspect SI
100
= 25.4 + 2.65 (Aspect) 0.056 0.018 4.46
Plots where slope ≥ 4% (n = 47): SI
100
= 26.6 + 2.88 (Aspect) 0.157 0.0059 4.04
pH-H
2
OSI
100
= –8.5 + 14.49 (pH-H
2
O) – 1.52 (pH-H
2
O)
2
0.068 0.034 4.45
log(K) SI
100
= 20.9 – 19.93 (log(K)) – 16.82 (log(K))
2
0.110 0.0034 4.35
Mg/K SI
100
= 23.1 + 2.30 (Mg/K) – 0.415 (Mg/K)
2
0.126 0.0015 4.31
Topo SI
100
= 21.7 + 0 (G < L) + 3.81 (G = L) + 6.51 (G > L) 0.129 0.0013 4.30
S/T SI
100
= 20.9 + 25.25 (S/T) – 23.0 (S/T)
2
0.134 0.001 4.30
pH-KCl SI
100
= –13.8 + 19.90 (pH-KCl) – 2.42 (pH-KCl)
2
0.150 0.0003 4.25
K/P
2
O
5
SI
100
= 29.9 – 1.52 (K/P
2
O
5
) 0.160 < 0.0001 4.21
log(S) SI
100
= 26.4 + 4.14 (log(S)) – 5.34 (log(S))
2
0.210 < 0.0001 4.10
log(Mg) SI
100
= 26.3 – 6.42 (log(Mg)) – 8.32 (log(Mg))
2
0.213 < 0.0001 4.09
log(Ca) SI
100
= 27.3 + 1.37 (log(Ca)) – 3.99 (log(Ca))
2
0.220 < 0.0001 4.07
SWC 0-150 SI
100
= 20.3 + 0.032 (SWC 0-150) 0.247 < 0.0001 3.98
Humus form SI
100
= 22.1 + 0 (Dysmoder-Mor) + 4.86 (Eumoder) + 6.29 (Oligomull to hemimoder)
+ 5.29 (Mesomull) + 1.44 (Eumull)
0.312 < 0.0001 3.87
Soils with a carbonated horizon (n = 30)
log(Ca) SI
100
= 28.5 – 4.86 (log(Ca)) 0.260 0.004 3.35
K/P
2
O
5
– –––
Ca/Mg SI
100
= 26.1 – 0.27 (Ca/Mg) 0.157 0.029 3.58
Mg/K SI
100
= 29.9 – 0.85 (Mg/K) 0.143 0.039 3.61
SI
100
= 30.4 – 0.34 (Ca/Mg) – 1.09 (Mg/K) 0.381 0.0015 3.12
Soils without any carbonated horizon (n = 69)
log(Ca) SI
100
= 27.6 – 3.88 (log(Ca)) + 1.99 (log(Ca))
2
0.186 0.0011 4.46
K/P
2
O
5
SI
100
= 31.8 – 2.15 (K/P
2
O
5
) 0.225 < 0.0001 4.22
Ca/Mg – –––
Mg/K – –––
398 L. Bergès et al.
3.3.2. West region (W1 to W3)
The models had less predictive power than in the East region
and contained 3 or 4 predictors. The predictors were almost the
same: SWC 0-150, K/P
2
O
5
, log(Mg), humus form. Log(S) had
no significant effect in this region. No climatic or topographic
parameters were better predictors than SWC 0-150 and none
could be significantly added to SWC 0-150. SI
100
was optimum
when Mg was 0.86 cmol
+
/kg (W2). The effect of humus form
varied according to the model: eumull was the worst class in
model W1 whereas it was one of the best in model W2; the order
was the same in the two models for the other humus classes.
3.3.3. Global models (T1 to T3)
Models had 3 or 4 predictors and R
2
values were interme-
diate compared to regional models. Models based on (PET-
P) + (SWC 0-150) were no better than models based on SWC
0-150 only and SWD gave no better models than the ones based
on SWC 0-150. Topographic position was the only parameter
that explained a significant part of variance in addition to SWC
0-150. SI
100
was optimum when S was 1.60 cmol
+
/kg (T3) or
when Mg was about 0.64 cmol
+
/kg (T1 or T2). The most favourable
humus forms for SI
100
were mesomull and oligomull-to-hemi-
moder and the most unfavourable humus forms were dysmoder-
mor and eumull. Moreover, no significant regional effect was
detected in these three models.
We also tested for an interaction between SWC and nutrient
factors. A two-way ANOVA of SI
100
according to SWC class
(3 balanced classes) and the presence or absence of a carbona-
ted horizon in the soil profile (whatever the depth of the reaction
to HCl) indicated that only the SWC class was significant. A two-
way ANOVA testing the additive effect of the SWC class
(3 classes) and humus form showed that only the main factors
were significant.
3.4. Respective part of water and nutrient budgets
in predicting site index variations
The climate/water-related factors and nutrient-related fac-
tors explained 0 to 25% and 9 to 74% of the variance in site
index, respectively (Tab. IV). For global models (T1 to T3), the
climate/water-related factors and nutrient-related factors
explained 6 to 16% and 20 to 35% of the variance in site index,
respectively. The confounding effect accounted for 13% to
19% of the variance.
Table III. Results of the stepwise multiple regressions of SI
100
according to site variables. Models are adjusted for Eastern (n = 52), Western
(n = 47) and both regions (n = 99). The table gives model number, equation, R
2
and standard error (SE).
Code Model equation R
2
SE (m)
E1 SI
100
= 27.0 + 0.037 (SWC 0-150) – 0.059 (PET-P) – 1.10 (K/P
2
O
5
) 0.457 3.71
E2 SI
100
= 23.1 + 0 (G < L) + 5.2 (G = L) + 6.3 (G > L) + 4.03 (log(S)) – 6.65 (log(S))
2
0.542 3.43
E3 SI
100
= 18.9 + 0.71 (log(S)) – 4.48 (log(S))
2
+ 0 (Dysmoder-Mor) + 5.95 (Eumoder) + 10.84 (Oligomull to Hemimoder)
+ 11.18 (Mesomull) + 9.61 (Eumull)
0.744 2.63
E4 SI
100
= 13.61 + 0.022 (SWC 0-150) – 7.15 (log(Mg)) – 4.00 (log(Mg))
2
+ 0 (Dysmoder-Mor) + 4.12 (Eumoder)
+ 9.10 (Oligomull to Hemimoder) + 10.31 (Mesomull) + 7.92 (Eumull)
0.744 2.66
W1 SI
100
= 25.0 + 0.025 (SWC 0-150) –1.62 (K/P
2
O
5
) + 0 (Dysmoder-Mor) + 3.31 (Eumoder)
+ 3.37 (Oligomull to Hemimoder) + 3.54 (Mesomull) – 1.62 (Eumull)
0.506 3.17
W2 SI
100
= 24.4 + 0.031 (SWC 0-150) – 3.06 (log(Mg)) – 10.10 (log(Mg))
2
– 1.65 (Mg/K) + 0 (Dysmoder-Mor)
+ 3.39 (Eumoder) + 3.87 (Oligomull to Hemimoder) + 4.95 (Mesomull) + 5.81 (Eumull)
0.625 2.83
T1 SI
100
= 23.0 + 0.022 (SWC 0-150) + 0 (G < L) + 1.8 (G = L) + 3.9 (G > L) – 5.76 (log(Mg)) – 6.59 (log(Mg))
2
– 0.764 (K/P
2
O
5
)
0.491 3.36
T2 SI
100
= 19.2 + 0.026 (SWC 0-150) – 5.39 (log(Mg)) – 6.13 (log(Mg))
2
+ 0 (Dysmoder-Mor) + 3.82 (Eumoder)
+ 4.82 (Oligomull to Hemimoder) + 4.86 (Mésomull) + 1.40 (Eumull)
0.600 3.00
T3 SI
100
= 21.7 + 0.019 (SWC 0-150) + 3.70 (log(S)) – 3.96 (log(S))
2
– 0.70 (Mg/K) + 0 (Dysmoder-Mor)
+ 4.16 (Eumoder) + 5.31 (Oligomull to Hemimoder) + 5.45 (Mésomull) + 1.72 (Eumull)
0.596 3.03
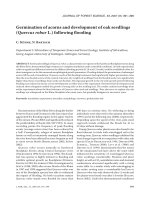
Figure 4. Relationships between SI
100
and exchangeable Ca
in the
A-horizon according to soil type (with and without a carbonated hori-
zon) and corresponding regression lines.
Sessile oak site index variations to soil and climate 399
4. DISCUSSION
4.1. Feasibility of a large-scale autecological study:
the role of the sampling strategy
The different multiple regression models explained between
49 and 60% of site index variance in the global models
(Tab. III). Predictions were better in the Eastern region but pre-
dictors in regional models remained largely consistent with glo-
bal models and only differed for climatic and topographic
variables and quantitative response to nutrient gradient. These
values were consistent with R
2
obtained for sessile oak in the
Tronçais National Forest (50–61% of variance in site index, see
[46]), even if our spatial scale was larger. Consequently, our
results do not support the hypothesis that increasing spatial
scale will decrease site index prediction quality [23, 29]. Our
conclusion is that autecological studies on broadleaved species
in lowland forests could be viable on an inter-regional scale,
which would considerably reduce the costs. However, we
emphasize the need for well-designed sampling: it is necessary
to achieve a complete, balanced sampling design stratified
according to the main ecological gradients (or to sample regu-
larly along these gradients), and to select pure, even-aged and
closed high-forest stands as far as possible. Common as well
as marginal site conditions must be sampled with the same
intensity and, since marginal site conditions are sparse, sam-
pling efforts must be largely devoted to finding those sites.
4.2. Autecology of sessile oak
4.2.1. Role of soil water capacity and topographic position
Maximum soil water capacity played an important role; it
was necessary to apply a costly, original protocol to test its
effect. The influence of soil water capacity on sessile oak height
and radial growth had already been frequently demonstrated
but more often for radial growth [19, 32, 54, 57]. Nieminen [61]
mentioned a correlation of 0.40 between sessile oak height
growth and soil water capacity on silt and marl soils. Jacquemin
et al. [46] indicated that site index at 100 years increases by 2 m
with a 100 mm increase in soil water capacity. This is close to
our estimate, even if their result was obtained with a more sim-
ple sampling protocol than the one in our study.
The effect of topography on site index was consistent with
the effect of soil water capacity: the difference between favou-
rable and unfavourable positions (3.9 m, model T1) correspon-
ded to a difference of 175 mm in SWC 0-150, which is very
important. Our results were consistent with Jacquemin et al.
[46] who mentioned a 2-m decrease in site index for unfavou-
rable topography compared to other positions, but samples for
opposite positions are missing in their data.
4.2.2. Role of climatic factors and soil water deficit
Site index was influenced by aspect but only in simple mod-
els (Tab. II). This result was surprising for such a moderate
relief; however, it confirms the role of aspect on sessile oak
height growth [46].
Other climatic factors (PET-P, SWD) had a very limited
influence on sessile oak height growth that was restricted to
eastern models (E1) and was not significant in global models
(T1 to T3). We found that soil water deficit was a worse pre-
dictor compared to soil water capacity. Our results were not
consistent with other findings that are generally established on
radial growth using a dendroclimatic analysis [19, 53]. Indeed,
different studies have shown that sessile oak annual radial
increment is positively influenced by warm temperatures dur-
ing the growing season or at the beginning of the summer [11,
56, 63] and also by precipitation accumulated over the growing
season [9, 11, 52, 63]. Water balance has been found to be a
limiting factor for radial growth in sessile oak [19, 53]. How-
ever, these studies have concerned radial growth and not height
growth and do not analyse the role of climate at the same level:
dendroclimatic studies test the effect of climate on year-to-year
growth variations (using growth data averaged over 100 to
200 trees) whereas autecological studies test the influence of
regional climate on plot-to-plot growth variations (using cli-
matic data averaged over 30 years). Bréda and Pieffer [19] have
provided an example of the decrease in the correlation between
growth and soil water deficit from temporal to spatial scale for
the same sample: the plot-to-plot correlation between soil water
deficit and radial growth averaged over the 1964–1994 period
is lower than year-to-year correlation between soil water deficit
and radial growth averaged over all plots. A significant annual
climatic effect on ring width is also observed on the data used
in the present article by Bergès [14]. The difference between
temporal and spatial growth responses to climate could be
explained by the lower local climate variability compared to the
annual climatic variability, but this was not the case in our data:
the between-years standard deviation of mean annual temper-
ature was 0.6 °C over the 1961–1990 period for Nancy, but the
between-plots standard deviation was higher (1.0 °C, see
Tab. I); the between-years standard deviation of annual precip-
itation was 136 mm over the 1961–1990 period for Nancy and the
between-plots standard deviation was slightly lower (114 mm).
The difference between temporal and spatial growth responses
Table IV. Partition of total variance of models E1 to T3 according to: (1) sums of squares (SS) of climate/water-related factors; (2) SS (nutri-
ent-related factors); (3) SS (confounding effect of (1) and (2)); (4) residual variance.
Sums of squares E1E2E3E4W1W2T1T2T3
Climate/water-related factors 25% 18% 0% 7% 19% 13% 16% 12% 6%
Nutrient-related factors 9% 31% 74% 45% 19% 43% 20% 35% 35%
Confounding effect of factors 12% 5% 0% 23% 0.2% 7% 13% 13% 19%
Residual variance 54% 46% 26% 26% 61% 37% 51% 40% 40%
400 L. Bergès et al.
to climate should be clarified because no difference between
the range of two ecological gradients was detected.
4.2.3. Role of nutrient richness
The flat, parabolic response of sessile oak height growth to
soil acidity was consistent with the results of Jacquemin et al.
[46] but we explored a larger nutrient gradient. These authors
only considered mor to oligomull humus forms and observed
that sessile oak site index is much lower on mor and dysmoder
compared to eumoder, hemimoder and oligomull humus forms
(–9 and –6 m respectively). Different authors have also obser-
ved a lower site index on very acidic sites and near-surface cal-
careous soils compared to intermediate conditions [32, 43, 62].
We found, as did Jacquemin et al. [46], that site index can be
high on acidic-to-neutral soils (eumoder to mesomull), whereas
the studies cited above observed an optimum restricted to sli-
ghtly acidic sites with dysmull humus [27, 32] or more neutral
sites with mesomull humus [1]. Regional differences might
explain this variation since both Dupouey and Cuiller and
Mériaux [27, 32] worked in Alsace (north-eastern France) and
Abt [1] in the Orléans National Forest (western France). Howe-
ver, we observed a different trend with an optimum site index
close to acidic sites in the West and close to neutral sites in the
East.
In our study, site index response to specific chemical soil
variables was consistent with previous results, and the role of
potassium and phosphorous nutrition in tree growth was highli-
ghted. Indeed, K/P
2
O
5
for soils without any carbonated horizon
had already been cited as a good indicator of soil mineral fer-
tility for sessile oak stands in 3 forests in the “ligérien” geogra-
phic sector (Allogny, Blois, Bercé) [55]. An immediate
increase in the radial growth of sessile oak of 40% (one year
after CaO fertilisation by gypsum or lime) in a 40- to 50-year-
old sessile oak coppice on poor acidic soil is mentioned by
Bakker et al. [4]. Liming in moderate doses on sites showing
nutrient deficiencies can stimulate the absorption capacity of
the sessile oak root system by enlarging fine roots and thereby
improving uptake of mineral nutrients and stand growth [4].
No effect of C/N ratio on site index was detected, despite its
classical use as an indicator of nitrogen availability for plants
[3]. This ratio is probably not an accurate variable for nitrogen
supply because it is not very well correlated to humus form
(R
2
= 0.35). Fertilisation experiments on adult and young trees
have also stressed the importance of soil nitrogen, phosphorous
and calcium supplies for sessile oak radial and height growth
and foliar nutrient composition [4, 9, 16, 36]. However, most
of the experiments are carried out on nutrient-deficient soils
where soil acidification is known to be detrimental to root
growth and nutrient uptake [5]. It has also been shown that the
application of liming on oak stands has an indirect, positive
influence on nitrogen and carbon dynamics [12].
Nutritional problems on calcareous soils are not very well-
documented for sessile oak [13]. Oak seedling response to
nitrogen fertilisation is positive for acidic soils and calcareous
soils but more pronounced on a substrate with low nutrient sup-
ply. Moreover, N input can cause N-induced nutritional imba-
lance for base cations on substrates with high nutrient supply
[13]. The presence of calcium carbonate in the soil is known
to negatively affect tree growth because it can reduce nitrogen
and phosphorous nutrition quality [3]; it can also lead to impai-
red nutrient uptake for Mg and K as the adsorption complex is
saturated by Ca in calcareous soils [15]. The last effect may be
more important for sessile oak growth because Mg/K and Ca/
Mg had an additive, negative effect on soils with a carbonated
horizon: the balance between Ca and Mg is critical but so is the
balance between Mg and K.
4.2.4. Interaction between climate, soil water
and nutrient factors and respective portion
of variance in site index explained by the different
ecological factors
We tested the hypothesis that deeper soil horizons with cal-
cium carbonate could not be prospected by the root system and
so the water they contain could not be used by the tree. To do
this, we explored site index response to soil water capacity on
soils with a carbonated horizon. Our result did not confirm the
hypothesis that calcium carbonate was more limiting for a large
SWC than for a small SWC.
Most site index variance was related to local soil factors and
corroborated the hypothesis that sessile oak growth was regu-
lated by the combined influence of soil water and nutrient bud-
gets. Most of the autecological studies already mentioned adopt
a synoptic approach based on a pre-established forest site clas-
sification, and the effects of SWC and nutrient status on site
index are difficult to separate (the most acidic or calcareous
sites tend to have the shallowest soils). The additive effect of
soil water capacity and nutrient status is observed when the
authors compare dry with fresh sites for a given nutrient supply
[32, 33, 50]. For example, Lainez [50] mentioned that the mean
height of dominant trees in coppice-with-standards stands is
lower on meso-acidic sites where mean soil water capacity is
108 mm compared to sites where soil water capacity is 158 mm
(21.2 m versus 25.8 m). Our results clearly indicated that
nutrient-related factors accounted for a higher portion of
variance than climate/water-related ones. However, the relati-
vely high proportion of variance that corresponded to the con-
founding climate/water/nutrient-related factors effects highlights
the difficulty we had in completely separating the two main gra-
dients, in spite of the sampling effort.
4.2.5. Management implications
These results can be translated into practical recommenda-
tions to forest managers for selecting suitable site conditions
for sessile oak and forecasting accurate timber yield. This spe-
cies should not be planted or naturally regenerated on sites with
a very low mineral supply and/or a low soil water capacity,
especially when these conditions are exacerbated by a deficit
topographic position (water lateral loss > gain). Although a dry
climate and a south-western aspect are likely to limit site index,
these two factors have a limited effect. This is consistent with
the results of Lévy et al. on radial growth [56]. However, regu-
lar thinning can help to minimize water competition between
trees and reduce the duration and intensity of droughts [18].
Additional work should investigate the effect of regional cli-
mate and waterlogging on sessile oak growth and validate the
results obtained in previous studies [7, 56, 58].
Sessile oak site index variations to soil and climate 401
Acknowledgements: This work was supported by a Convention link-
ing the French Ministry of Agriculture (DERF) and the Cemagref enti-
tled “Relationships between site, growth and wood quality of indige-
nous oaks” No. 01.40.07/95. We are sincerely grateful to G. Grandjean
for his precious help during the sampling of various forest site condi-
tions, J.C. Gégout for collecting floristic data, B. Jabiol for suggestions
concerning soil descriptions and chemical analyses, A. Perrin and J.C.
Rat for their technical help during increment core collection. We
would also like to thank the French National Forest Office (ONF) for
its technical help during this project, especially P. Duplat (ONF) for
his invaluable comments during the study. We are grateful to the pri-
vate owners and the ONF who gave us permission to work inside their
forests and to core the trees. Special thanks to Victoria Moore for revis-
ing the English of the manuscript. The authors also wish to thank the
two anonymous reviewers for helpful comments and suggestions on
the manuscript.
REFERENCES
[1] Abt D., Contribution à l’étude des stations en Forêt d’Orléans,
ENITEF, 1983.
[2] Baize D., Jabiol B., Guide pour la description des sols, INRA, Paris,
1995.
[3] Baize D., Guide des analyses courantes en pédologie, INRA, Paris,
1988.
[4] Bakker M.R., Nys C., Picard J.F., The effects of liming and gypsum
applications on a sessile oak (Quercus petraea (M.) Liebl.) stand at
La Croix-Scaille (French Ardennes) I. Site characteristics, soil che-
mistry and aerial biomass, Plant Soil 206 (1999) 99–108.
[5] Bakker M.R., Nys C., Effect of liming on fine root cation exchange
sites of oak, J. Plant Nutr. 22 (1999) 1567–1575.
[6] Bary-Lenger A., Boinon M., Guns A., Comment prédire la produc-
tivité de l’épicéa commun (Picea abies Karst.) dans les forêts
ardennaises, Silva Belgica 102 (1995) 9–16.
[7] Becker M., Levy G., Lefevre Y., Radial growth of mature peduncu-
late and sessile oaks in response to drainage, fertilization and wee-
ding on acid pseudogley soils, Ann. For. Sci. 53 (1996) 585–594.
[8] Becker M., Lévy G., Le point sur l’écologie comparée du chêne ses-
sile et pédonculé, Rev. For. Fr. 42 (1990) 148–154.
[9] Becker M., Nieminen T.M., Gérémia F., Short-term variations and
long-term changes in oak productivity in northeastern France. The
role of climate and atmospheric CO
2
, Ann. For. Sci. 51 (1994) 477–
492.
[10] Becker M., Influence relative du climat et du sol sur les potentialités
forestières en moyenne montagne. Exemple des sapinières à fétu-
que (Festuca silvatica Vill.) dans les Vosges alsaciennes, Ann. Sci.
For. 39 (1982) 1–31.
[11] Bednarz Z., The influence of temperature and precipitation on ring
widths of oak (Quercus robur L.) in the Niepolomice forest near
Cracow, southern Poland, Tree Ring Bull. 50 (1990) 1–10.
[12] Belkacem S., Nys C., Consequences of liming and gypsum top-
dressing on nitrogen and carbon dynamics in acid forest soils with
different humus forms, Plant Soil 173 (1995) 79–88.
[13] Berger T.W., Glatzel G., Response of Quercus petraea seedlings to
nitrogen fertilization, For. Ecol. Manage. 149 (2001) 1–14.
[14] Bergès L., Variabilités individuelle et collective de la croissance et
de la densité du bois de Quercus petraea (Matt.) Liebl. en relation
avec les facteurs écologiques, ENGREF, Nancy, 1998.
[15] Bonneau M., Fertilisation des forêts dans les pays tempérés, École
Nationale du Génie Rural, des Eaux et des Forêts (ENGREF),
Nancy, France, 1995.
[16] Bonneau M., Sessile oak seedling fertilization and leaf mineral
composition in western France, Ann. For. Sci. 53 (1996) 605–613.
[17] Bréda N., Cochard H., Dreyer E., Granier A., Field comparison of
transpiration, stomatal conductance and vulnerability to cavitation
of Quercus petraea and Quercus robur under water stress, Ann.
For. Sci. 50 (1993) 571–582.
[18] Bréda N., Granier A., Aussenac G., Effects of thinning on soil and
tree water relations, transpiration and growth in an oak forest
(Quercus petraea (Matt) Liebl.), Tree Physiol. 15 (1995) 295–306.
[19] Bréda N., Pieffer M., Étude du bilan hydrique des chênaies de la
Forêt Domaniale de la Harth (Haut-Rhin) et impact des épisodes de
sécheresse sur la croissance radiale des chênes, Rapport de Conven-
tion, INRA Unité d’Écophysiologie Forestière – Équipe Phytoéco-
logie – ONF, Nancy, 1999.
[20] Bréda N., Analyse rétrospective de la croissance radiale des chênes
de la Forêt Domaniale de La Harth (Haut-Rhin), Rapport de Con-
vention, INRA Unité d’Écophysiologie Forestière – Équipe Phy-
toécologie, Nancy, 1998.
[21] Brêthes A., La typologie des stations forestières. Recommandations
méthodologiques, Rev. For. Fr. 41 (1989) 7–27.
[22] Chen H.Y.H., Klinka K., Kabzems R.D., Site index, site quality,
and foliar nutrients of trembling aspen: relationships and predic-
tions, Can. J. For. Res. 28 (1998) 1743–1755.
[23] Chen H.Y., Krestov P.V., Klinka K., Trembling aspen site index in
relation to environmental measures of site quality at two spatial sca-
les, Can. J. For. Res. 32 (2002) 112–119.
[24] Ciesielski H., Sterckeman T., A comparison between three methods
for the determination of cation exchange capacity and exchangea-
ble cations in soils, Agronomie 17 (1997) 9–16.
[25] Claessens H., Pauwels D., Thibaut A., Rondeux J., Site index cur-
ves and autecology of ash, sycamore and cherry in Wallonia
(Southern Belgium), Forestry 72 (1999) 171–182.
[26] Cochard H., Bréda N., Granier A., Aussenac G., Vulnerability to air
embolism of three European oak species (Quercus petraea (Matt)
Liebl, Q. pubescens Willd, Q. robur L.), Ann. For. Sci. 49 (1992)
225–233.
[27] Cuiller B., Mériaux P., Définition des stations forestières du Centre
de Mulhouse, ENITEF, 1980.
[28] Curt T., Dole S., Marmeys G., Alimentation en eau et production
forestière. Application d’indicateurs simples pour les résineux dans
le Massif Central, Étude et Gestion des Sols 3 (1996) 81–96.
[29] D’Epenoux F., Influence du milieu sur la production forestière.
Efficacité comparée de deux méthodes, Informations Techniques
du Cemagref 95 (1994) 8.
[30] Duplat P., Tran-Ha M., Modelling the dominant height growth of
sessile oak (Quercus petraea Liebl.) in France – Inter-regional
variability and effect of the recent period (1959–1993), Ann. Sci.
For. 54 (1997) 611–634.
[31] Duplat P., Indice de fertilité basé sur un modèle de croissance en
hauteur, in: Buffet M., Girault D. (Eds.), Station forestière, produc-
tion et qualité du bois : éléments méthodologiques, Cemagref,
Nogent sur Vernisson, 1989, pp. 51–78.
[32] Dupouey J.L., Étude phytosociologique et écologique du massif de
Haguenau (Bas-Rhin). Apports méthodologiques. Potentialités syl-
vicoles, INA Paris-Grignon, 1983.
[33] Farinotti S., Larousse J.F., Production et qualité des chênes en Solo-
gne Bourbonnaise : vers une optimisation de la gestion des peuple-
ments irréguliers, ENITEF, 1991.
[34] Franc A., Houllier F., Étude des relations entre milieu et production :
quelques critères de choix de méthodes, in: Buffet M., Girault D.
(Eds.), Station forestière, production et qualité des bois : éléments
méthodologiques, Cemagref, Nogent-sur-Vernisson, 1989, pp. 13–49.
[35] Franc A., Le Massif Central cristallin. Analyse du milieu. Choix
des essences, Cemagref, Clermont-Ferrand, 1989.
[36] Garbaye J., Bonneau M., Premiers résultats d’un essai de fertilisa-
tion sur plantation de chêne rouvre (Quercus sessiliflora), Ann. Sci.
For. 32 (1975) 175–183.
402 L. Bergès et al.
[37] Gégout J.C., Jabiol B., Analyses de sol en forêt : les choix du phy-
toécologue dans le cadre des typologies de stations ou des études
scientifiques, Rev. For. Fr. 53 (2001) 568–580.
[38] Gilbert J.M., Chevalier R., Dumas Y., Autécologie du pin laricio de
Corse dans le secteur ligérien, Rev. For. Fr. 48 (1996) 201–216.
[39] Gilbert J.M., Franc A., Typologie et cartographie du climat dans la
moitié nord de la France. Perspectives d’utilisation en relations
milieu-production forestière, Ingénieries EAT 12 (1997) 35–47.
[40] Gilbert J.M., Relier milieu et production des essences forestières :
comparaison de deux approches, Ingénieries EAT 8 (1996) 31–39.
[41] Graham M.H., Edwards M.S., Statistical significance versus fit:
estimating the importance of individual factors in ecological analy-
sis of variance, Oikos 93 (2001) 505–513.
[42] Grandjean G., Sigaud P., Contribution à la taxonomie et à l’écolo-
gie des chênes du Berry, Ann. Sci. For. 44 (1987) 35–66.
[43] Grandjean G., Chorologie et exigences écologiques de quelques
espèces ligneuses forestières indigènes et introduites en France,
ENGREF, 1991.
[44] Inventaire Forestier National, site web : />2004.
[45] Jabiol B., Baize D., Un nouveau langage en pédologie : le référen-
tiel pédologique, Rev. For. Fr. 45 (1993) 141–152.
[46] Jacquemin B., Lacroix R., Démarcq P., Duplat P., Relation entre
station et fertilité du chêne sessile (Quercus petraea Liebl.) en forêt
de Tronçais, Bulletin Technique de l’ONF 39 (2000) 33–44.
[47] Jamagne M., Bétremieux R., Begon J.C., Morin A., Quelques don-
nées sur la variabilité dans le milieu naturel de la réserve en eau des
sols, Bulletin Technique d’Information, 1977, pp. 324–325.
[48] Jarret P., Sylviculture du Chêne sessile, Bulletin Technique de
l’ONF 31 (1996) 21–28.
[49] Kayahara G.J., Klinka K., Marshall P.L., Testing site index site-
factor relationships for predicting Pinus contorta and Picea engel-
mannii × P. glauca productivity in central British Columbia,
Canada, For. Ecol. Manage. 110 (1998) 141–150.
[50] Lainez D., Études préalables à l’aménagement des forêts commu-
nales du Massif de la Serre. Définition des stations forestières,
ENITEF, 1981.
[51] Le Goff N., Lévy G., Productivité du frêne (Fraxinus excelsior L.)
en région Nord-Picardie, Ann. Sci. For. 41 (1984) 135–170.
[52] Lebourgeois F., Cousseau G., Ducos Y., Étude d’une chênaie ses-
siliflore exceptionnelle : la futaie des Clos (Sarthe), Rev. For. Fr. 4
(2003) 333–346.
[53] Lebourgeois F., Cousseau G., Ducos Y., Climate-tree-growth rela-
tionships of Quercus petraea Mill. stand in the Forest of Bercé
(“Futaie des Clos”, Sarthe, France), Ann. For. Sci. 61 (2004) 361–
372.
[54] Lebourgeois F., Les Chênes sessile et pédonculé (Quercus petraea
Liebl. et Quercus robur L.) dans le réseau RENECOFOR : rythme
de croissance radiale, anatomie du bois, de l’aubier et de l’écorce,
Rev. For. Fr. 51 (1999) 522–536.
[55] Leroy P., Étude de nutrition-production sur le chêne. Perspectives
de fertilisation, Rev. For. Fr. 20 (1968) 323–340.
[56] Lévy G., Becker M., Duhamel D., A comparison of the ecology of
pedunculate and sessile oaks: radial growth in the centre and nor-
thwest France, For. Ecol. Manage. 55 (1992) 51–63.
[57] Lévy G., Delatour C., Becker M., Le dépérissement du chêne des
années 1980 dans le Centre de la France, point de départ d’une
meilleure compréhension de l’équilibre et de la productivité de la
chênaie, Rev. For. Fr. 46 (1994) 495–503.
[58] Lévy G., Lefèvre Y., La forêt et sa culture sur sol à nappe tempo-
raire, École Nationale du Génie Rural, des Eaux et des Forêts,
Nancy, 2001.
[59] Lévy G., Appréciation de la fertilité du sol, Ann. Sci. For. 40 (1988)
11–18.
[60] Lloyd W.L., Lemmon P.E., Rectifying azimuth (of aspect) in stu-
dies of soil-site index relationships, in: Youngberg C.T., Davey
C.B. (Eds.), Tree growth and forest soils, Oregon State University
Press, Corvallis, 1970, pp. 435–448.
[61] Nieminen T.M., Étude dendrochronologique du chêne (pédonculé
et sessile) et du hêtre dans une forêt de la plaine lorraine, Faculté
des Sciences, Nancy, 1988.
[62] Picard J.F., Les types de station de la forêt domaniale de Bellême
(Orne), Rev. For. Fr. 30 (1978) 425–431.
[63] Pilcher J.R., Gray B., The relationships between oak tree growth
and climate in Britain, J. Ecol. 70 (1982) 297–304.
[64] Pritchett W.L., Fisher R.F., Properties and management of forest
soils, 2nd ed., John Wiley and Sons, New York, 1987.
[65] Timbal J., Aussenac G., An overview of ecology and silviculture of
indigenous oaks in France, Ann. Sci. For. 53 (1996) 649–661.
[66] Wang G.G., White spruce site index in relation to soil, understory
vegetation, and foliar nutrients, Can. J. For. Res. 25 (1995) 29–38.
To access this journal online:
www.edpsciences.org