Báo cáo lâm nghiệp: " Variation of the photosynthetic capacity across a chronosequence of maritime pine correlates with needle phosphorus concentration" pptx
Bạn đang xem bản rút gọn của tài liệu. Xem và tải ngay bản đầy đủ của tài liệu tại đây (149.05 KB, 7 trang )
537
Ann. For. Sci. 62 (2005) 537–543
© INRA, EDP Sciences, 2005
DOI: 10.1051/forest:2005046
Original article
Variation of the photosynthetic capacity across a chronosequence
of maritime pine correlates with needle phosphorus concentration
Sylvain DELZON
a,b
*, Alexandre BOSC
a
, Lisa CANTET
a
, Denis LOUSTAU
a
a
Unité de Recherche EPHYSE, INRA-Bordeaux, 69 route d’Arcachon, 33610 Gazinet, France
b
Present address: UMR INRA 1202 BIOGECO, Équipe Écologie des Communautés, Université Bordeaux 1,
Bât. B8, avenue des Facultés, 33405 Talence, France
(Received 2 August 2004; accepted 20 April 2005)
Abstract – Changes in needle photosynthetic capacity has been studied across a chronosequence of four maritime pine stands aged 10-, 32-,
54- and 91-yr. We determined photosynthetic parameters from response curves of assimilation rate to air CO
2
concentration (A-C
i
) and radiation
(A-Q) using gas exchange measurements on branches in the laboratory. Our data showed no shift in photosynthetic parameters (V
cmax
, J
max
,
α and R
d
) with increasing stand age. This result means that the decline in productivity observed throughout our maritime pine chronosequence
cannot be explained by a decrease in photosynthetic capacity but by a decline in stomatal conductance evidenced in a previous paper [7].
However, V
cmax
was higher in the 32-yr-old stand compared to the other stands and theses between-stand differences were explained by leaf
phosphorus concentration. Moreover, additional data of V
cmax
suggest that the photosynthetic capacity may be higher at younger stages due to
initial fertilisation. Therefore the P nutrition may contribute to productivity decline over the duration of the management cycle.
Pinus pinaster Ait. / forest aging / NPP decline / maximum carboxylation rate / nutrient limitation
Résumé – Les variations de la capacité de la photosynthèse des aiguilles de pin maritime dans une chronoséquence sont corrélées à celles
des teneurs en phosphore. Nous avons étudié l’évolution des capacités photosynthétiques foliaires dans une chronoséquence constituée de
quatre peuplements équiennes de Pin maritime âgés de 10, 32, 54 et 91 ans. Les paramètres photosynthétiques ont été estimés sur des courbes
de réponse du taux d’assimilation à la concentration en CO
2
(A-C
i
) et à la lumière (A-Q) obtenues à partir de mesures d’échange gazeux foliaire.
Dans la chronoséquence étudiée, aucune tendance n’a été mise en évidence entre les paramètres photosynthétiques (V
cmax
, J
max
, α et R
d
) et l’âge
du peuplement. Ce résultat démontre que le déclin de productivité foliaire observée dans la chronoséquence ne peut être expliqué par les
capacités photosynthétiques, mais bien par une diminution de la conductance stomatique mise en évidence dans un précédent article [7].
Toutefois, des valeurs de V
cmax
plus élevées ont été observées dans le peuplement de 32 ans. Ces variations de capacités photosynthétiques
entre peuplements sont bien expliquées par la teneur foliaire en phosphore. L’ajout de données antérieures suggère cependant des taux
supérieurs de capacités photosynthétiques chez les jeunes peuplements sans doute en lien avec une fertilisation lors de la plantation. La nutrition
en phosphore pourrait ainsi contribuer au déclin de productivité dans le contexte sylvicole des Landes de Gascogne.
Pinus pinaster Ait. / vieillissement / déclin de productivité / vitesse maximale de carboxylation
1. INTRODUCTION
In even-aged forests, growth and biomass accumulation
decline after reaching a peak relatively early in a stand’s life
[10, 28, 29]. The primary reason for a decrease in forest net pri-
mary production with increasing stand age is the decline in pho-
tosynthesis [3, 30, 37]. This decline could be due to both
reduced leaf area and reduced leaf photosynthesis. Reduced
leaf assimilation may be caused by changes in (i) diffusive lim-
itation via a decrease in stomatal conductance and internal CO
2
concentration, (ii) an increased in mesophyll resistance, and
(iii) a biochemical and photochemical limitation via the RubisCO
activity and photochemistry respectively. The former has been
increasingly demonstrated to be linked to the decline in hydrau-
lic transfer capacity accompanying the increase in height and
architectural complexity with tree development [4, 11, 30].
Both photosynthesis and stomatal conductance are reduced
with tree age [11, 12, 37]. Indeed, when trees grow taller, height
may reduce the ability of tall trees to transport water to the top
of the canopy due to combination of factors including gravity
and a longer and more ramified water path-length. Stomatal
adjustment must occur therefore to maintain homeostasis of
minimum needle water potential [31, 33] and keep the water
transport away from cavitation threshold. On the other hand,
* Corresponding author:
Article published by EDP Sciences and available at or />538 S. Delzon et al.
changes in mesophyll resistance with tree age have never been
studied in our knowledge and the rational behind an age-related
decrease of photosynthetic capacities are not fully understood.
In the literature, few studies of woody plants have investigated
rigorously the variations in photosynthetic capacity with age.
Few, if any studies were designed to isolate variation caused
by age from all other sources of variation, e.g. size and envi-
ronment. Thus, the present study was focused on quantifying
the possible change in photosynthetic capacity with increasing
tree age.
Declining nutrient availability during stand development
adversely affects tree leaf area and leaf photosynthesis [10].
Thus, foliar nutrient concentration might be lower in older and
taller trees [21, 34] and might limit the activity of photosyn-
thetic enzymes but see e.g. Mencuccini and Grace [19]. This
hypothesis has been rarely investigated in detail in literature
and most often, only nitrogen was considered as a potential lim-
itation of tree photosynthesis (especially in the temperate zone
[26]) whereas other nutrients such as phosphorus may limit tree
growth and forest productivity depending on the type of soil.
To examine the possible changes in photosynthetic capacity
independently of diffusive limitations, we characterized the
parameters controlling the photosynthetic capacity of maritime
pine needles across a chronosequence composed of four stands
aged of 10-, 32-, 54- and 91-yr respectively. Maximal carbox-
ylation capacity, maximal electron transport rate and apparent
quantum use efficiency were determined from gas exchange
measurements in the laboratory and this was complemented by
foliar nutrient concentration analyses. This study was part of
the French contribution to the European CARBO-AGE project
where the hydraulic and stomatal conductance limitations on
tree growth were investigated in details as reported by Delzon
et al. [7].
2. MATERIALS AND METHODS
2.1. Chronosequence description
Studies were carried out in four pure, even-aged maritime pine
stands located 20 km southwest of Bordeaux in the “Landes de Gas-
cogne” forest in south-western France. Trees were grown as even aged
stands aged 10, 32, 54 and 91 year-old in 2002, from seeds originating
from the same geographical provenance (Tab. I). Stands were located
in a 20 km wide area and exhibited similar environmental conditions
(altitude, climate and soil characteristics) and management practices.
The climate is temperate maritime with cool wet winters and warm
dry summers. Mean annual temperature (1950–2000) was 13 °C, and
mean annual precipitations (1970–2000) were 977 mm. The soil was
a sandy hydromorphic humic podzol with a cemented B
h
horizon lim-
iting the root zone depth to –0.8 m, low soil phosphorus and nitrogen
levels and mean pH of 4.0. Soil texture analysis showed the soil is 90%
sand, 5% silt and 5% clay. In each stand, aboveground biomass incre-
ment per unit of leaf area (i.e. growth efficiency) was estimated from
an allometric relationship between tree biomass, diameter at 1.3 m and
tree age [7]. Mean values of growth efficiency (1996–2001) dramat-
ically declined with stand age from 121 gC m
–2
leaf
yr
–1
for the 10-yr-
old stand to 38 gC m
–2
leaf
yr
–1
for the 91 yr-old stand (Tab. I).
2.2. Gas exchange measurements
Measurements were carried out during May–June 2003 on a total
of 24 branches, i.e. two branches per tree and three trees per stand.
Characteristics of the sampled trees as measured in December 2002
are presented in Table II. Six series of measurements were carried out
where each series, a randomised block, included one branch taken
from each stand. Each branch was cut in the early morning wrapped
within a wet cloth and brought back to the laboratory, then re-cut under
water. Branches were chosen within the 3 year-old whorl among
branches exposed South. This corresponded to the upper third of the
tree canopy which was made accessible by a scaffolding. Measure-
ments were carried out using three one-year-old fascicles (six needles)
positioned across the minicuvette and kept hydraulically connected to
the branch during gas exchange measurements. The branch was kept
covered with a humid cloth during the measurements.
Gas exchange measurements were made in the laboratory inside an
air-conditioned room, using an open gas exchange system, with a con-
trolled environment minicuvette (Compact Minicuvette System CMS
400, Walz, Effeltrich, Germany). The protocol used was similar to
Porté and Loustau [25] and Medlyn et al. [18] except for the following
points. Air temperature (T
a
) was set at 25 °C as controlled with a
Peltier element, dewpoint (T
dp
) fixed at 19 °C with a dew-point gen-
erator and air composition (O
2
, CO
2
, N
2
) was controlled by mass flow
meters (Gas Mixing Unit GMA-2, Walz). The upper and lower sides
of the cuvette were illuminated each by a bundle of 200 optic fibres
arranged uniformly and connected to a metal halide lamp (Fiber Illuminator
FL-440, Special Fiberoptics 400-F, Walz, Effeltrich, Germany). The
Table I. Characteristics of the four stands of the chronosequence. Values are mean ± standard error.
Stand age 10 yr 32 yr 54 yr 91 yr
Latitude 44° 44’ N 44° 44’ N 44° 44’ N 44° 37’ N
Longitude 0° 46’ W 0° 46’ W 0° 46’ W 0° 34’ W
Mean height (m) 8.46 ± 0.08 20.21 ± 0.11 26.65 ± 0.11 28.36 ± 0.26
Diameter at 1.3 m (mm) 142.5 ± 0.1 298.8 ± 0.1 436.7 ± 0.3 513.2 ± 0.4
Basal area (m
2
ha
–1
) 19.23 ± 0.21 36.00 ± 0.26 38.22 ± 0.50 32.96 ± 0.52
Tree number (trees ha
–1
) 1180 500 250 155
Biometric measurements (trees) 637 1921 485 463
Plant area index (PAI, m
2
m
–2
) 3.41 3.04 2.51 1.85
Leaf area index (LAI, m
2
m
–2
) 2.86 2.26 1.78 1.76
Growth efficiency (gC m
–2
leaf
yr
–1
) 121.3 (12.1) 76.2 (3.9) 51.7 (7.0) 37.8 (4.2)
Photosynthetic capacity across a chronosequence 539
required range of irradiances was obtained by an electronic regulator
and neutral filters controlling light intensity sent to the two upper and
lower sides of the cuvette through a bundle of 200 optic fibres. Incident
PAR onto the needles surface was mapped in the cuvette with a PAR
sensor (LI-190, LI-Cor, Inc., Lincoln, NE) and needles were posi-
tioned so that the illumination received by the upper and lower surfaces
did not show spatial variation exceeding ±5% of the average illumination
received. Differential (CO
2
) and (H
2
O) concentrations between the
measuring and reference circuits were measured by a Binos 100 IRGA
differential analyser calibrated with gas standards and cross-checked
against a Licor 6262. Environmental parameters that were continu-
ously measured in the chamber included air temperature (T
a
), relative
humidity (RH), and absolute CO
2
concentration (C
a
) (Analyser IRGA
Li-800, Li-Cor, Lincoln Nebraska, U.S.A.). The needle temperature
was not measured with the constructor thermocouple because of prob-
lems with direct heating of the thermocouple by incident light and the
spherical shape of the thermocouple which forbids a close contact
between needle surface and the thermocouple. Instead, the needle tem-
perature was estimated from light intensity and cuvette temperature
using an energy balance calculation parameterised using a heated nee-
dle replicas, aluminium 2 mm diameter half-cylinder of known emis-
sivity whose temperature was measured with an internal Cu-Cn
thermocouple embedded in resin. The average aerodynamic conduct-
ance of the needle replica over a range of locations in the cuvette was
estimated to 3000 mmol H
2
O m
–2
s
–1
. It is worth noting that the dif-
ference between needle and air temperature during subsequent measure-
ments attained +0.8 °C on average. Assimilation (A, µmol CO
2
m
–2
s
–1
), transpiration (E, mmol H
2
O m
–2
s
–1
), stomatal conductance (g
s
,
mmol CO
2
m
–2
s
–1
) and the internal CO
2
concentration (C
i
, µmol CO
2
mol
–1
) were calculated according to Farquhar and von Caemmerer [9].
To determine the photosynthetic parameters, the response curves
of assimilation rate to air CO
2
concentration (A–C
i
) and radiation (A–
Q) were operated as follows. Before measurements, needles were
acclimated in the chamber for 90 mn at a CO
2
concentration of
360 µmol CO
2
mol
–1
and incident photosynthetic flux density (PPFD)
of 900 µmol photons m
–2
s
–1
. The branch xylem water potential was
measured using needles outside of the chamber of which transpiration
were prevented by a wet cloth each 30 min all along the measurements.
The branch was eventually recut to keep the water potential above
–0.3 MPa. First measurement was made at CO
2
concentration of
350 µmol mol
–1
and PPFD of 1500 µmol m
–2
s
–1
respectively fol-
lowed by a full A–C
i
response curve and a light response curve. The
air CO
2
concentrations used to generate A–C
i
curves were decreased
from 1500 to 800, 350, 200, 100, 50 and 0 µmol mol
–1
while O
2
con-
centration was switched between 2% and 21% at each CO
2
value
except for the first four series where the 2% concentration was applied
only from 0 to 350 µmol CO
2
mol
–1
. For the A-Q curves, the air CO
2
concentration was kept constant at 1100 µmol mol
–1
and Q was
sequentially lowered from 1500 to 900, 490, 270, 150, 100, 50 and
30 µmol m
–2
s
–1
. To make respiration measurements, needles were
kept in the dark with a T
dp
of 5 °C and values were recorded at the
end of the night.
Photosynthetic capacities, V
cmax
the maximum rate of carboxyla-
tion (µmol CO
2
m
–2
s
–1
), J
max
the maximum rate of electron transport
(µmol e
–
m
–2
s
–1
), the quantum use efficiency (µmol e
–
mol
–1
photons)
and TPU, the rate of triose phosphate utilisation were estimated alto-
gether from the data observed by minimizing the sum of squares
between the predicted values and observed values according to the
Farquhar model of leaf photosynthesis [8], including the phosphate
utilisation rate as proposed by von Caemmerer [35]. Needle temper-
ature fluctuations observed during measurements were accounted for
using the equations of activation energy, values published by Medlyn
et al. [18] so that the photosynthetic parameters fitted were given at a
reference leaf temperature of 25 °C.
2.3. Nutrient content analysis
Immediately after the gas exchange measurements, needle length
(l), diameter (d) and thickness (t) were measured with an electronic
calliper on the six needles sampled in order to estimate the total pho-
tosynthetic surface area, calculated as ((2t + d)/4 × π + d)×l. Needles
were dried subsequently at 65 °C for 72 h, weighted and specific leaf
area (SLA, m
2
kg
–1
) was calculated as the ratio of needle area to dry
weight. Needles were re-dried at 70 °C, mineralised with hot sulphuric
acid and assayed colorimetrically for concentrations of nitrogen and
phosphorus using the Technicon auto-analyser [23]. Nitrogen and
phosphorus concentrations are expressed either on a mass basis (%;
N
m
, P
m
) or on a leaf area basis (g m
–2
; N
a
, P
a
).
2.4. Statistical analysis
To determine whether the variation in photosynthetic parameters
(V
cmax
, J
max
, α, R
d
), nutrient concentrations (N
m
, P
m
, N
a
, P
a
) and spe-
cific leaf area (SLA) were related to stand age, data were analysed by
simple linear regression. Regressions were performed using SAS soft-
ware package (SAS 8.01, SAS Institute Inc., Cary, NC) with the REG
procedure. The effect of the series of measurements was analysed
using ANOVA and Student-Newman-Keuls’s test for eventual mean
comparison.
3. RESULTS
3.1. Photosynthetic parameters
No significant relationship was found between needle pho-
tosynthetic capacities and stand age (Tab. III). However, V
cmax
(J
max
) showed differences between stands, reaching its maxi-
mum value of 50.4 µmol CO
2
m
–2
s
–1
(147.2 µmol e
–
m
–2
s
–1
)
in the 32-yr-old stand. No significant interaction with date of
measurements (series) was found and the series effect itself was
significant only for R
d
, the respiration rate at 25 °C which the
overall mean decreased from 1.2 to 0.7 µmol CO
2
m
–2
s
–1
throughout the experiment. No large difference appeared
between stands either for the quantum use efficiency (α) or dark
Table II. Characteristics of the sampled trees in each maritime pine
stand. The tree leaf area was calculated using an allometric rela-
tionship from diameter under the live crown (Delzon et al. [7]).
Stand age Diameter (mm) Height (m) Leaf area (m
2
)
10 yr 149 10.2 66
145 10.4 63
131 9.3 54
32 yr 300 20.4 124
259 19.9 94
341 19.9 158
54 yr 455 28.1 172
491 27.0 200
442 27.2 162
91 yr 523 27.7 159
508 27.7 226
556 26.9 214
540 S. Delzon et al.
respiration (R
d
). The rate of triose phosphate utilisation, TPU,
could be estimated only for 5 shoots collected in the 10-, 54-
or 91-yr-old stands. Values were closed from 5.5 µmol TP
m
–2
s
–1
while no major difference emerged among stands. TPU
was never limiting under ambient CO
2
and O
2
concentrations.
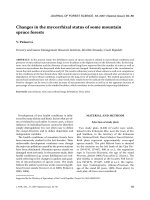
We observed a close linear relationship (r
2
= 0.90) between
J
max
and V
cmax
(Fig. 1) and the ratio J
max
/V
cmax
ratio were
about 2.5 mol e
–
mol
–1
CO
2
at the 10-, 54- and 91-yr-old stands
and reached its highest value of 2.9 at the 32-yr-old stand.
3.2. Specific leaf area and mineral concentrations
Specific leaf area decreased significantly with increasing
age from 6.2 to 5.2 m
2
kg
–1
(Tab. IV). In addition, leaf nitrogen
concentration on an area basis (N
a
) significantly increased with
stand age from 1.70 to 2.51 g m
–2
. This results mainly from the
change in the specific leaf area. By contrast, all other parame-
ters such as leaf nitrogen and phosphorus concentration on a
mass basis (N
m
and P
m
) did not vary across the chronosequence
(Tab. IV). However, the leaf phosphorus concentration on mass
basis (P
m
) was highest in the 32-yr-old stand, following the
same pattern than photosynthetic parameters. This pattern held
true for the phosphorus expressed on an area basis (P
a
). This
trend was confirmed by other independent measurements car-
ried out across the same stands both in January 2002 and 2003
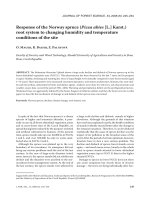
[6]. Figure 2 shows the relationship between V
cmax
and P
a
for
all measurement series pooled by stand. The between-stand
variation in V
cmax
was mostly explained by the phosphorus
concentration expressed on area basis whereas N concentra-
tions showed non relationship with photosynthetic parameters
(data not shown).
4. DISCUSSION
The growth efficiency measured across the four stands com-
posing the chronosequence declined asymptotically from 121
to 38 gC m
–2
leaf
yr
–1
between 10 and 91 years. No variable stud-
ied in the present study follows a similar pattern except the spe-
cific leaf area. However, the carbon isotope discrimination as
studied in a companion paper declined continuously with age [7].
Photosynthetic values reported here were close to those
found in previous studies made on the same species for a 25-yr-
old stand, where V
cmax
value was 49.3 µmol m
–2
s
–1
for one
Table III. Linear regression coefficients for photosynthetic parameters (V
cmax
, J
max
, a and R
d
) versus stand age for data pooled by age (n = 4).
P represents the significance of the slope and non-zero intercept.
Intercept Slope R
2
P
V
cmax
(µmol m
–2
s
–1
) 44.690 –0.032 0.050 0.777
J
max
(µmol m
–2
s
–1
) 119.692 –0.116 0.032 0.820
α 0.215 –0.0004 0.778 0.118
R
d
(µmol m
–2
s
–1
) 0.849 –0.0005 0.0507 0.775
Figure 1. Relationship between maximum electron transport rate,
J
max
, and maximum carboxylation rate, V
cmax
. The linear regression
is J
max
= 4.2871 V
cmax
– 70.811 (R
2
= 0.90). Values were compiled
for the four stands of different age.
Figure 2. Relationship between maximum carboxylation rate, V
cmax
,
and phosphorus concentration on a leaf area basis, P
a
, across the chro-
nosequence. For each stand, value represents the mean and standard
error of 6 measurements. Correlation between V
cmax
and P
a
: intercept
23.43, slope 200.93, n = 4, R
2
= 0.988, P < 0.0064.
Photosynthetic capacity across a chronosequence 541
year old needles sampled in the top of the canopy [25]. Medlyn
et al. [18] reported a range of V
cmax
between 35 and 60 for a
18-yr-old stand throughout the year. In our study, photosyn-
thetic parameters were only measured at the canopy top and we
assumed that they were representative of the whole crown.
Indeed, Porté and Loustau [25] demonstrated that crown height
did not influence V
cmax
and J
max
in maritime pine trees. The
lack of variation in photosynthetic parameters was due to the
weak attenuation of light with canopy depth. The range of LAI
observed in this chronosequence makes therefore unlikely that
the photosynthetic parameters may vary strongly in tree crowns
and the parameters as measured may be considered as spatially
representative of entire crowns. Although Medlyn et al. [18]
showed that the V
cmax
and J
max
values may change by 16 µmol
CO
2
m
–2
s
–1
and 32 µmol e
–
m
–2
s
–1
respectively on a seasonal
basis, we did not detect any time effect over the course of our
experiment.
We did not find any relationship between photosynthetic
parameters (V
cmax
, J
max
, α and R
d
) and stand ages across our
chronosequence (Tab. III). Therefore, the lack of difference in
photosynthetic parameters means that the decline in growth
efficiency (Tab. I) cannot be explained by a decline in photo-
synthetic capacity. This result supports the hypothesis that the
drop in stomatal conductance observed in this stage by Delzon
et al. [7] and confirmed by isotope discrimination could alone
explain the change in growth efficiency throughout our mari-
time pine chronosequence. Maintenance of the photosynthetic
parameters observed in this study has also been observed in
other studies, even though photosynthetic capacity along tree
life cycle have been poorly quantified and just tackled in few
studies. Indeed, the results reported so far support apparently
the idea that V
cmax
and J
max
do not correlate with the age decline
in forest productivity. For instance, Barnard and Ryan [1] found
that Eucalyptus saligna trees of 1- (7 m) and 5-years (26 m) had
V
cmax
values of 76 and 85 µmol m
–2
s
–1
, respectively. Phillips
et al. [24] did not detect any difference in either V
cmax
or J
max
between 10- and 25-m height oak trees. Likewise, no signifi-
cant change was found for Ponderosa pine [11, 37]. However,
Law et al. [14] found different results for 10- and 50-yr-old Pon-
derosa pine stands, where V
cmax
decreased by 35% from the
young to the older stand. On the other hand, for Douglas-fir,
McDowell et al. [17] reported V
cmax
values reaching a maximal
value at intermediate age, i.e. 27.5, 47.9 and 38.9 µmol m
–2
s
–1
for the 15-, 32- and 60-m trees, respectively. However, it must
be mentioned that at large with present and past results obtained
on maritime pine, none of these V
cmax
determinations were
made under constant temperature and humidity conditions and
saturating light. Discrepancies in the measurement protocol
might cause large bias when comparing data from different
authors.
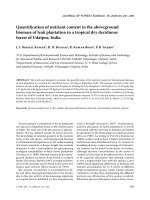
Our data show no trend in photosynthetic capacity (V
cmax
,
J
max
, α and R
d
) with stand age despite the fact that maximum
rate of carboxylation was higher in the 32-yr-old stand. This
higher value at age 32-yr is confirmed by data measured pre-
viously in three stands among which two do not belong to the
chronosequence [18, 25] (Fig. 3). In agreement with the obser-
vation that V
cmax
is affected at this level of P concentrations in
maritime pine [2, 15], the between-stand difference in V
cmax
is
well correlated to the needle P concentration measured across
sites (R
2
= 0.99, n = 4). This conclusion holds true for the addi-
tional data issued from Porté and Loustau [25] and Medlyn
et al. [18] where needle P
a
is in the range 0.11 – 0.13 g P m
–2
(data not shown). We may suspect an impact of the fertilisation
provided shortly after planting to the trees of the 32-yr-old
stand; indeed, the other stands of our chronosequence never
received any fertilisation.
The ∆ of annual ring cellulose decreased significantly with
increasing stand ages (intercept 18.466 slope –0.008 R
2
= 0.769,
P < 0.0096) independently of the year from 18.5 to 17.68‰ [7].
There was no relationship between ∆ and maximum carboxy-
lation rates or electron transport rates. On the other hand, the
photosynthetic parameters results conformed to the concurrent
decline in stomatal conductance and carbon discrimination
Table IV. Regression coefficients for leaf structural parameters (N
m
, P
m
, SLA, N
a
and P
a
) versus stand age for data pooled by age n = 4 (linear
regressions for all parameters except specific leaf area (SLA); log-linear regression for SLA).
Intercept Slope R
2
P
N
m
(%) 1.03 0.003 0.836 0.086
P
m
(%) 0.061 –0.0001 0.109 0.671
SLA (m
2
kg
–1
) 1.807 –0.002 0.908* 0.047
N
a
(g m
–2
) 1.689 0.009 0.948* 0.026
P
a
(g m
–2
) 0.103 –0.0001 0.021 0.856
Figure 3. Mean values of maximum carboxylation rate, V
cmax
, versus
stand age. Full circles, mean values measured across our chronose-
quence in this study. Open circles, mean values from previous studies
(Porté and Loustau [28] and Medlyn et al. [20]) measured using the
same gas exchange system in three stands among which two do not
belong to our chronosequence; bars are standard errors.
542 S. Delzon et al.
observed across the chronosequence studied. Indeed, our data
suggested that at a given photosynthesis performance lower
stomatal conductance occurred, inducing lower C
i
, and
decreasing ∆. Moreover, the lower value of ∆ in the 32-yr-old
stand can be explained by the higher values of photosynthetic
capacity and intermediate level of stomatal conductance meas-
ured in the trees of this stand.
Leaf nitrogen concentration on an area basis appeared to
increase slightly throughout the chronosequence and did not
play a role in the photosynthesis decline in maritime pine trees.
We found that most of the variations in N
a
across the chron-
osequence were a result of thicker needles (SLA) rather than
difference in nitrogen concentration (N
m
). Because leaf nitrogen
concentration of leaves is usually correlated with photosyn-
thetic capacity and its measurement was less time-consuming
than A-C
i
curves, a lot of studies have investigated age-related
change in N
a
. Leaf N on a mass basis did not present a general
trend in response to tree height or age [22]; in some studies, it
was lower in older trees [10, 21, 34] while it remained constant
with increasing tree age in others [11, 19, 37]. The leaf mass
to area ratio is known to increase as trees become older and
taller [22] which increases the nitrogen concentration on an area
basis [27, 34], as observed in our study.
The data presented in Figure 3 suggest that the photosyn-
thetic capacity may decrease with increasing stand age after
canopy closure (LAI max observed between 15 and 25 years).
Since the 18- and 32-yr-old stands had received a larger initial
fertilisation in P than the other stands, we cannot disentangle
unambiguously the effects of P nutrition from the eventual age
effect. The change in phosphorus concentration in needle cor-
relates well with the variation in V
cmax
observed between
stands consistently with previous studies on the impact of phos-
phorus starvation on the photosynthesis in this species [15].
Therefore, P nutrition is likely the main cause of the changes
in photosynthetic capacity observed among maritime pine
stands. Having acknowledged that the differential fertilisation
of the stands composing the chronosequence studied may
explain the pattern observed, we cannot exclude that the
sequestration of P under unavailable forms in soil, soil organic
matter and biomass may play a role in photosynthesis, growth
and productivity decline [10, 20, 36]. Moreover, deficiency in
P can also affect total leaf area [5] and not only nutrient con-
centration per unit of leaf area or photosynthesis. Results from
fertilisation experiments in this area have shown that a 42-yr-
old stand responds positively to a late fertilisation in phospho-
rus, which demonstrates that nutrient is still limiting at this age
even for stands having received as much as 250 kg P ha
–1
dur-
ing site preparation (Trichet, unpublished results). A positive
response of tree growth to thinning in old growth stands of
Douglas-fir and Ponderosa pine provides an additional support
to the hypothesis that the availability of resources, not an inher-
ent decadency with age, limits tree growth in old stands [13,
16, 32].
5. CONCLUSION
In our chronosequence, we observed no trend in photosyn-
thetic capacity (V
cmax
, J
max
, α and R
d
) with increasing stand
age. Elsewhere, in a previous paper [7], we related a marked
decrease in both stomatal conductance and wood ∆ with
increasing tree height across stand development, reducing CO
2
diffusion into the leaf. Together with the results presented in
this study, our results demonstrated that the decrease in foliar
assimilation, inducing the growth efficiency decline observed
in the studied chronosequence, could be explained only by sto-
matal closure in response to greater hydraulic constraints as
trees grow taller. However, additional data from previous stud-
ies showed that V
cmax
might be higher in young stands due to
initial fertiliser application with respect to forest management
in south-western France. So, we cannot exclude the idea that
P nutrition as a limiting factor of tree growth might play a role
in productivity decline throughout the rotation cycle of mari-
time pine stands.
Acknowledgments: We thank Michel Sartore and Catherine Lambrot
for their technical assistance. This research was jointly supported by
the European CARBO-AGE project (contract ENV4-CT97-0577) and
the French project CARBOFOR (Ministère de l‘Écologie et du Dével-
opppement Durable, Ministère de l’Agriculture, de l’Alimentation, de
la Pêche et des Affaires Rurales, programs GICC and GIP-Ecofor).
During his Ph.D. thesis work the senior author fellowship was sup-
ported by INRA and ADEME.
REFERENCES
[1] Barnard H.R., Ryan M.G., A test of the hydraulic limitation hypo-
thesis in fast-growing Eucalyptus saligna, Plant Cell Environ. 26
(2003) 1–11.
[2] Ben Brahim M., Loustau D., Gaudillere J.P., Saur E., Effects of
phosphate deficiency on photosynthesis and accumulation of starch
and soluble sugars in 1-year-old seedlings of maritime pine (Pinus
pinaster Ait.), Ann. For. Sci. 53 (1996) 801–810.
[3] Bond B.J., Age-related changes in photosynthesis of woody plants,
Trends Plant Sci. 5 (2000) 349–353.
[4] Bond B.J., Ryan M.G., Comment on “Hydraulic limitation of tree
height: a critique” by Becker, Meinzer & Wullschleger, Funct.
Ecol. 14 (2000) 137–140.
[5] Cheaïb A., Mollier A., Thunot S., Lambrot C., Pellerin S., Loustau
D., Interactive effects of phosphorus and light availability on early
growth of maritime pine seedlings, Ann. For. Sci. 62 (2005).
[6] Delzon S., Causes fonctionnelles et structurales du déclin de producti-
vité des forêts avec l’âge : Analyse expérimentale d’une chronosé-
quence de peuplements de pin maritime, Ph.D. Thesis, University
of Bordeaux I, France, 2004.
[7] Delzon S., Sartore M., Burlett R., Dewar R., Loustau D., Hydraulic
responses to height growth in maritime pine trees, Plant Cell Envi-
ron. 27 (2004) 1077–1087.
[8] Farquhar G.D., von Caemmerer S., Berry J.A., A biochemical
model of photosynthetic CO
2
assimilation in leaves of C3 species,
Planta 149 (1980) 78–90.
[9] Farquhar G.D., von Caemmerer S., Modelling of photosynthetic
response to environmental conditions, in: Lange O.L., Nobel P.S.,
Osmond C.B., Ziegler H. (Eds.), Encyclopedia of plant physiology.
Physiological plant ecology. II. Water relations and carbon assimi-
lation, Springer-Verlag, Berlin Germany, 1982, pp. 549–587.
[10] Gower S.T., McMurtrie R.E., Murty D., Aboveground net primary
production decline with stand age: potential causes, Trends Ecol.
Evol. 11 (1996) 378–382.
[11] Hubbard R.M., Bond B.J., Ryan M.G., Evidence that hydraulic
conductance limits photosynthesis in old Pinus ponderosa trees,
Tree Physiol. 19 (1999) 165–172.
Photosynthetic capacity across a chronosequence 543
[12] Kull O., Koppel A., Net photosynthetic response to light intensity
of shoots from different crown positions and age in Picea abies (L.)
Karst, Scand. J. For. Res. 2 (1987) 157–166.
[13] Latham P., Tappeiner J., Response of old-growth conifers to reduc-
tion in stand density in western Oregon forests, Tree Physiol. 22
(2002) 137–146.
[14] Law B.E., Sun O.J., Campbell J., van Tuyl S., Thornton P.E., Chan-
ges in carbon storage and fluxes in a chronosequence of ponderosa
pine, Glob. Change Biol. 9 (2003) 510–524.
[15] Loustau D., Ben-Brahim M., Gaudillere J.P., Dreyer E., Photosyn-
thetic responses to phosphorus nutrition in two-year-old maritime
pine seedlings, Tree Physiol. 19 (1999) 707–715.
[16] Martin T.A., Jokela E.J., Stand development and production dyna-
mics of loblolly pine under a range of cultural treatments in north-
central Florida USA, For. Ecol. Manage. 192 (2004) 39–58.
[17] McDowell N.G., Phillips N., Lunch C., Bond B.J., Ryan M.G., An
investigation of hydraulic limitation and compensation in large, old
Douglas-fir trees, Tree Physiol. 22 (2002) 763–774.
[18] Medlyn B.E., Loustau D., Delzon S., Temperature response of
parameters of a biochemically based model of photosynthesis. I.
Seasonal changes in mature maritime pine (Pinus pinaster Ait.),
Plant Cell Environ. 25 (2002) 1155–1165.
[19] Mencuccini M., Grace J., Hydraulic conductance, light interception
and needle nutrient concentration in Scots pine stands and their
relations with net primary productivity, Tree Physiol. 16 (1996)
459–468.
[20] Murty D., McMurtrie R.E., Ryan M.G., Declining forest producti-
vity in aging forest stands: a modeling analysis of alternative hypo-
theses, Tree Physiol. 16 (1996) 187–200.
[21] Niinemets U., Distribution patterns of foliar carbon and nitrogen as
affected by tree dimensions and relative light conditions in the
canopy of Picea abies, Trees, 11 (1997) 144–154.
[22] Niinemets U., Stomatal conductance alone does not explain the
decline in foliar photosynthetic rates with increasing tree age and
size in Picea abies and Pinus sylvestris, Tree Physiol. 22 (2002)
515–535.
[23] O’Neill J.V., Webb R.A., Simultaneous determination of nitrogen,
phosphorus and potassium in plant material by automatic methods,
J. Sci. Food Agr. 21 (1970) 217–219.
[24] Phillips N., Bond B.J., McDowell N.G., Ryan M.G., Schauer A.J.,
Leaf area compounds height-related hydraulic costs of water trans-
port in Oregon White Oak trees, Funct. Ecol. 17 (2003) 832–840.
[25] Porté A., Loustau D., Variability of the photosynthetic characteris-
tics of mature needles within the crown of a 25-year-old Pinus
pinaster, Tree Physiol. 18 (1998) 223–232.
[26] Rees M., Condit R., Crawley M., Pacala S., Tilman D., Long-term
studies of vegetation dynamics, Science 293 (2001) 650–655.
[27] Rijkers T., Pons T.L., Bongers F., The effect of tree height and light
availability on photosynthetic leaf traits of four neotropical species
differing in shade tolerance, Funct. Ecol. 14 (2000) 77–86.
[28] Ryan M.G., Binkley D., Fownes J.H., Age-related decline in forest
productivity: pattern and process, Adv. Ecol. Res. 27 (1997)
213–262.
[29] Ryan M.G., Binkley D., Fownes J.H., Giardina C.P., Senock R.S.,
An experimental test of the causes of forest growth decline with
stand age, Ecol. Monogr. 74 (2004) 393–414.
[30] Ryan M.G., Yoder B.J., Hydraulic limits to tree height and tree
growth: what keeps trees from growing beyond a certain height,
Bioscience 47 (1997) 235–242.
[31] Saliendra N.Z., Sperry J.S., Comstock J.P., Influence of leaf water
status on stomatal response to humidity, hydraulic conductance,
and soil drought in Betula occidentalis, Planta 196 (1995) 357–366.
[32] Sayer M.A.S., Goelz J.C.G., Chambers J.L., Tang Z., Dean T.J.,
Haywood J.D., Leduc D.J., Long-term trends in loblolly pine pro-
ductivity and stand characteristics in response to thinning and ferti-
lization in the West Gulf region, For. Ecol. Manage. 192 (2004) 71–96.
[33] Schafer K.V.R., Oren R., Tenhunen J.D., The effect of tree height
on crown level stomatal conductance, Plant Cell Environ. 23 (2000)
365–375.
[34] Schoettle A.W., Influence of tree size on shoot structure and phy-
siology of Pinus contorta and Pinus aristata, Tree Physiol. 14
(1994) 1055–1068.
[35] Von Caemmerer S., Biochemical Models of Leaf Photosynthesis,
in: Techniques in Plant Sciences Series No. 2, Csiro Publishing,
Australia, 2000.
[36] Wardle D.A., Walker L.R., Bardgett R.D., Ecosystem properties
and forest decline in contrasting long-term chronosequences,
Science 305 (2004) 509–513.
[37] Yoder B.J., Ryan M.G., Waring R.H., Schoettle A.W., Kaufmann
M.R., Evidence of reduced photosynthetic rates in old trees, For.
Sci. 40 (1994) 513–527.
To access this journal online:
www.edpsciences.org