Báo cáo lâm nghiệp: "Predicting the environmental thresholds for cambial and secondary vascular tissue development in stems of hybrid aspen" pptx
Bạn đang xem bản rút gọn của tài liệu. Xem và tải ngay bản đầy đủ của tài liệu tại đây (893.09 KB, 9 trang )
565
Ann. For. Sci. 62 (2005) 565–573
© INRA, EDP Sciences, 2005
DOI: 10.1051/forest:2005049
Original article
Predicting the environmental thresholds for cambial and secondary
vascular tissue development in stems of hybrid aspen
Peter W. BARLOW
a
*, Stephen J. POWERS
b
a
School of Biological Sciences, University of Bristol, Woodland Road, Bristol BS8 1UG, UK
b
Biomathematics and Bioinformatics Division, Bawden Building, Rothamsted Research, Harpenden, Hertfordshire AL5 2JQ, UK
(Received 19 May 2004; accepted 9 March 2005)
Abstract – The interaction between environmental conditions and the developing secondary vascular tissue in young stems of hybrid aspen,
Populus tremula × P. tremuloides, was studied with the aid of a differential equation regression model. Two data sets were combined. The first
set consisted of the accumulated numbers of cells, such as xylem fibres, vessels, phloem and parenchymatous ray cells, in the radial cell files
of stems sampled at intervals over a period of 16 months. Also counted were the numbers of fusiform cambial cells accumulated within the
radial files and upon the cambial perimeter (initial cells). The second data set pertained to the external environment, and values were gathered
at close time-intervals during the same stem-sampling period. The environmental variables were temperature and illuminance; from the latter,
an estimate of day-length was made. These variables were used to construct developmental-time units, values of which were regressed against
the accumulated numbers of the various cell types in the secondary vascular tissues. Regression analyses led to estimates not only of rates of
cell production but also to the basal threshold values of the environmental parameters, above or below which the various cell productions were
initiated or terminated in relation to seasonal conditions. In this way, the critical conditions for the production of each of the various cell types
could be identified.
cambium / developmental-time units / hybrid aspen / modelling / secondary vascular tissues
Résumé – Détection de seuils de température et de durée du jour pour le développement cambial et la formation de tissus vasculaires
dans des troncs de peupliers hybrides. Les interactions entre conditions environnementales et développement des tissus vasculaires
secondaires ont été étudiées au cours du développement de jeunes pousses de tremble hybride (Populus tremula × P. tremuloïdes) à l’aide d’un
modèle de régression associé à des équations différentielles. Deux séries de données ont été combinées. La première concernait le nombre de
cellules accumulées de différents types – fibres xylémiennes, vaisseaux, cellules de phloème, rayons parenchymateux – dans les files radiales
de cellules de tiges échantillonnées à intervalles de temps réguliers sur une période de 16 mois. Étaient aussi pris en compte le nombre de
cellules cambiales fusiformes accumulées dans les files radiales et dans le périmètre cambial (cellules initiales). La seconde série de données
concernait des variables environnementales externes, dont les valeurs ont été relevées à intervalles de temps rapprochés, tout au long de la
période d’échantillonnage des pousses. Les variables environnementales prises en compte sont la température et l’éclairement, donnée à partir
de laquelle est estimée la durée du jour. Elles ont été utilisées pour définir des unités de « temps de développement », à partir desquelles se font
les régressions contre le nombre de cellules des différents types accumulées dans les tissus vasculaires secondaires. Les analyses de régression
permettent d’estimer non seulement le taux de production de cellules, mais aussi les valeurs seuils des paramètres environnementaux au dessus
et en dessous desquelles les différents types de productions cellulaires sont initiés ou arrêtés en fonction des conditions saisonnières. De cette
manière on a pu identifier les conditions critiques pour la production de chacun de chacun de ces différents types de cellules.
cambium / unité de temps de développement / tremble hybride / modélisation / tissus vasculaires secondaires
1. INTRODUCTION
Living organisms are subject to certain “Laws of Develop-
ment” [22] which, in turn, are governed by the Laws of Chem-
istry and Physics. Temperature, for example, is an important
regulator of biological growth and development, the rates of
these processes ultimately being determined by the rates of
molecular collisions. The growth of plants is responsive to
many abiotic environmental regulators, either alone or in com-
bination [26]. Their effects can be quite subtle: for example,
cycles of light and dark can combine with cycles of varying
temperature to evoke patterns of development not expressed in
response to any one of these variable alone [9].
The seasonal cycles of growth and development of temper-
ate tree species are responses to variations in the ambient, abi-
otic environment [6, 11]. One cycle is visible in the rhythm of
shoot bud burst, flowering, leaf fall and dormancy [27], as well
as in the rhythmic activity of the root system [20]. Another
* Corresponding author:
Article published by EDP Sciences and available at or />566 P.W. Barlow, S.J. Powers
cycle is internal and relates to patterns of cellular development,
such as the annual increment of the secondary vascular tissues,
phloem and xylem. However, growth and development occur
only within part of the range of parameter values tolerable for
the life of a given species. Above or below some environmen-
tally determined threshold value trees enter a dormant state, and
growth activity recommences only when the threshold is
crossed once more as the season of the year changes.
In the context of the inter-relationship between the tree and
its environment, it is of interest to discover which of the many
potentially informative signals originating in the ambient envi-
ronment actually regulate the developmental cycles mentioned
above. Three further questions then arise. The first is: can phys-
ical threshold values be established for the perception of envi-
ronmental signals? Second, what is the impact on growth of
each of the environmental parameters once the threshold has
been crossed? Third, is it possible to answer the first two ques-
tions simply by measuring aspects of tree growth in conjunction
with a complementary recording of the environmental varia-
bility? Thus, environmental variability itself might be used to
extract information about which of the variable parameters are
critical for an effect upon growth. A recent model [16] for the
statistical analysis of growth of hybrid aspen (Populus tremula
× tremuloides) in relation to a changing environment suggests
that it is indeed possible to establish certain of the environmen-
tal thresholds as they relate to various aspects of tree develop-
ment. It was also found possible to assess the relative
contribution of these variables to the subsequent rate of growth
once the thresholds had been overcome. This paper summarises
aspects of this model and presents new results that have been
gained from the hybrid aspen material.
2. MATERIALS AND METHODS
2.1. Biological material
Stem cuttings of hybrid aspen, Populus tremula L. × P. tremuloides
Michx. (clone T89) were potted up and grown in a greenhouse, with
no supplementary lighting or heating, located in Long Ashton (51° 25'
N, 2
° 40' W), Bristol, UK. Stem segments were excised 10 cm above
ground level, cut into quarters, and fixed in 2.6% glutaraldehyde in
0.1 M phosphate buffer, pH 7.2. After dehydration, the stem sectors
were embedded in methacrylate resin. Cross-sections of stems were
cut on a microtome, stained in an aqueous mixture of 0.1% acriflavine,
3% safranin, 0.1% auramine and 2% methylene blue [17], and pre-
pared for light microscopy. Samples were taken at three- or four-week
intervals (except during the winter months when the trees were dor-
mant) over a 16 month period from April 1999 until July 2000. Three
or four trees were sacrificed on each occasion.
Radial files of cells traversing the cambium, xylem and phloem
were identified in the cross-sections. The numbers of cells of various
types were counted along the files within the current year’s growth
increment. Cells in each file of xylem could be further categorised as
either fibres, vessels, or latewood. No distinctions between cell types
could be made in the developing phloem. The number of parenchyma
cells along the radial files of the uniseriate rays were also counted. Esti-
mates were made of the number of cambial cells in a single complete
cell row around the cambial circumference: that is, the number of cam-
bial initials from which each radial cell file is descended.
Data pertaining to three abiotic environmental variables surround-
ing the experimental set of trees were recorded at three-minute inter-
vals over the entire growth period and stored for later retrieval and
translation into a format [Excel (MicroSoft Corp.) files] compatible
with other computer programs [GenStat (Lawes’ Agricultural Trust)
and SigmaPlot (SPSS Inc.)] for statistical analysis and graphical rep-
resentation. The recorded variables were ambient temperature (
°C)
and the illuminance (W m
–2
) impinging upon the canopy of the trees.
From the illuminance data, estimates were automatically made of the
third variable, the duration (h) of each successive daylight period. This
period of daylength was taken as the time during which illuminance
was > 2 W m
–2
. Soil moisture and nutrient levels are two additional
variables which can affect secondary vascular tissue development [10,
11]. However, in the present experiment, the soil in which the trees
were grown was watered to holding capacity every other day, and once
a week the trees were fed with 100 mg nitrogen per litre (as dissolved
NH
4
NO
3
). These two variables were therefore considered as being
constant and hence their impacts on development were not assessed
further.
2.2. Units for assessing development – thermal time
Studies of development that are based on an accumulation of cell
numbers are commonly related to the passage of chronological time.
Other possible regulatory variables (e.g., temperature) are then usually
kept constant so that they can be ignored. The time-scale of observa-
tion in such studies is often relatively short, perhaps one or two days.
In the case of secondary vascular development in trees, this simplistic
approach is not feasible for two reasons: long periods of time (weeks
or months, as opposed to days) are required for significant develop-
ment to be completed and, in an uncontrolled environment, ambient
conditions are continually changing throughout the growth period.
Given a suitable analytical (differential equation) model in terms
of the rates of change in cell numbers, such as that developed by Powers
et al. [16], daily variations of temperature and illuminance, and also
the sinusoidal change of day-length throughout the year, can be used
to assess the contributions made by these environmental variables to
the process of secondary vascular development. This is because these
variations provide information for establishing (a) which of them are
of critical importance, and (b) the respective threshold values above
or below which development proceeds.
A commonly used measure is the “degree-day”, a unit first
employed by R A. de Réaumur. Réaumur postulated (in 1735; cited
in [3]) that not only was temperature, in the form of accumulated ther-
mal time, a critical variable in regulating plant development, but that
there was also a base temperature below which development did not
proceed. This base temperature represents one of the developmental
thresholds.
In its simplest form, the sum of day-degrees, S, over n days may
be expressed as
(1)
where is the mean temperature of the entire day for all days on
which its value exceeds the base temperature, t
b
. In the present exper-
iments, temperature measurements were sufficiently close together in
time so as to form a near-continuous record. The accumulated thermal
time (up to time t) is then the integral given by equation (1):
where H is the Heaviside function which ensures accumulation of ther-
mal time only for temperatures above t
b
, and u is the dummy variable
of integration. The rate of development is then estimated in terms of
S rather than real time. Both the rate and the base temperature, t
b
, are
estimated directly during the course of an iterated search for the best
fit between the accumulated cell number and thermal time.
S
t
day
t
b
–()
day 1=
n
∑
=
t
day
Stempu() t
b
–()
t
∫
Htempu() t
b
–()du×=
Thresholds for secondary vascular development 567
2.3. More complex units for development −
developmental-time units
Although temperature has a powerful effect on biological devel-
opment, it is by no means the only regulating factor. In order to accom-
modate other environmental variables that can be measured
concurrently and are of biological relevance, the thermal time model
was modified to employ “developmental-time units”. At their most
complex, these units include, in addition to temperature, the other two
previously mentioned variables, illuminance and daylength, thus giv-
ing an accumulation (up to time t) of temperature-daylength-solar illu-
minance units, as expressed by equation (2):
.
(2)
Each of the three environmental variables has its own base value,
and the Heaviside functions ensure that accumulation stops when any
one of them falls below its particular base value. In the present regres-
sion modelling of the numbers of cells of different type, all possible
combinations of the variables were fitted in a hierarchical way in order
to assess their respective strengths in accounting for the total variation of
the data. The critical variables were then identified by means of statistical
significance tests (F-tests), so that a parsimonious model was the resultant.
A full description of the statistical methodology is given in [16].
3. RESULTS
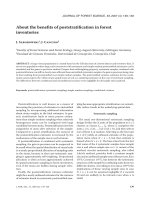
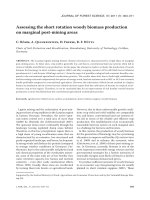
A portion of a cross-section of stem of hybrid aspen is illus-
trated in Figure 1 in which can be seen the major types of cells
whose numerical increases were recorded. A general chronol-
ogy of secondary vascular development for this material is
given in Table I from which it is evident that formation of new
tissues commences and concludes at specific times of the year.
With the aid of the proposed model, however, the temporal
development of the various xylem and phloem cell types was
examined more precisely. The thresholds that determine the
periods of their formation were estimated, the rates of cell pro-
ductions were followed on a day-by-day basis, and the calendar
dates on which productions were maximal were deduced.
When considered in relation to the passage of chronological
time, all secondary cell types – xylem, phloem, cambium –
accumulated in a rhythmic sigmoidal fashion. However, regres-
sion analyses were performed upon the accumulated numbers
of cells of various types using a developmental-time unit as the
dependent variable. Which of the three environmental variables
was incorporated into the developmental unit depended upon
the ability of the parameter values to improve the fit of the
model (i.e., enhance the statistical correlation coefficient of the
regression). Where there was a statistically significant
(p < 0.05) enhancement, the environmental variable was con-
cluded to have made a positive contribution to the production
of a given cell type. An example of this approach is shown
below in the results for xylem fibres.
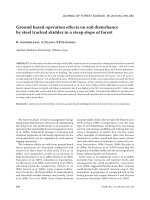
3.1. Xylem fibres
Temperature, in the form of accumulated thermal time, was
used in a first fitting of the data (Fig. 2a). The addition of accu-
mulated daylengths significantly (p < 0.05) improved the
goodness of fit (Fig. 2b), but also resulted in a more complex
temperature–day-length developmental-time unit. Both day-
length and temperature were therefore deemed critical for the
onset of xylem fibre differentiation from fusiform cambial
cells. The basal values (thresholds) of the two environmental
parameters regulating xylem fibre production are given in
Table II.
According to the model, the estimated rate, α, of the number
of xylem fibre cells formed per cambial cell per developmental-
time unit is given in Table II. Because of the completeness of
the record of environmental variables, it is possible to convert
the value of α for any particular cell type into the number of
cells of that type produced within a radial cell file during any
time period. In the present case, the conversion has been made
S temp u() t
b
–()Htempu() t
b
–()dayl u() dayl
b
–()××{
t
∫
=
Hdaylu() dayl
b
–()sol u() sol
b
–()H××× sol u() sol
b
–()}du
Figure 1. Cross-section of a stem of hybrid aspen sampled on 12 June
2000. C – cambium, D – dilatation ray, F – group of phloem fibres
(F2 – F4 indicate the tangential fibre row number), P – phloem and
its various cell types, R – ray parenchyma in xylem (Rx) and phloem
(Rp), V – vessel, X – xylem tissue. Black-and-white arrows point to
the boundary between the current year’s phloem and that of the pre-
vious year (1999). White ++ indicate a small group of phloem fibres
within the zone of tangential row F3 but which were interpolated at
the time when row F4 was differentiated. Row F1 of phloem is not
shown as it lies beyond the upper margin of the photograph in older
phloem tissue derived from the primary phloem. Scale bar = 100 µm.
568 P.W. Barlow, S.J. Powers
for the days when fibre cell production was maximal. The max-
imal rates of cell formation per file, and the dates on which these
occurred, are given in Table III.
3.2. Phloem and ray cells
Cumulative cell numbers within the radial files of phloem,
and also within the uniseriate files of parenchymatous ray cells
which extend from the cambium into both the xylem and
phloem tissues, were assessed throughout the sampling period.
In each case – for phloem and both types of ray cells – day-
length was found to be the determining variable. The threshold
values and maximal cellular production rates per cell file are
given in Tables II and III.
Data gathered from tangential sections through the cambium
of stems sampled in June 1999, and then in November–Decem-
ber 1999, showed that the rays lengthened in the vertical direc-
tion. The modal number of cells increased from four to eight
Table I. Timetable of internal development within the stems of hybrid aspen (Populus tremula × P. tremuloides) during the years 1999 and
2000. Stems were one year old at the start of the observation period (April 1999).
Stage
a
Commencement, continuation, and conclusion of secondary development in young stems of hybrid aspen
b
Anatomical features
A ++ o––––− + + + + – – – Phloem parenchyma storage
material
B –+++++ − ––––+++Cambium cell divisions
C – + + + + + + – – – + + + Xylem cell production
(fibres, vessels,
ray parenchyma)
D –+++++++––+++Phloem cell production
E ––++––––––––o + Ray dilatation
F ––11 22 33––––3 44 55Phloem fibre differentiation
c
G––− +++–––––––o +Phloem sclereid
differentiation
H –––− + + + + + – – – – o Phloem parenchyma
dilatation
I –––––+++–––––Phloem parenchyma
divisions
Month
of year
April
1999
May June July August September October NovemberDecember January−
April 2000
May June July
a
The features displayed at stages A–I conform to an approximate developmental sequence. These features were evident in stem transections prepared
for light microscopy.
b
Presence (+) or absence (–), or no record available (o). Two symbols within a box denote that the feature referred to was recorded (or inferred) in both
the first and also in the second half of a given month. A single symbol indicates that the feature was constant throughout the indicated period.
c
The numerals in row F denote the number of rows of groups of phloem fibres seen in cross section. The groups of phloem fibres do not develop in
strict centripetal sequence along a radius, but are offset relative to groups in other rows (see Fig. 1). Fibre row number 1 (not shown in Fig. 1) probably
lies within primary phloem tissue; rows 2–5 are in secondary tissue.
Table II. Estimated basal thresholds (± standard errors, s.e.) of environmental variables involved in the production of the various cell types in
the secondary vascular system of hybrid aspen stems. α is the elemental rate of cell number increase in relation to the respective developmen-
tal-time unit.
Estimated basal threshold (± s.e.)
a
Cell type
b
Temperature
(°C)
Illuminance
(W m
–2
)
Daylength
(h)
α × 10
4
F – radial file meristem 10.69 ± 0.19 –
c
12.50 ± 0.06 1.348 ± 0.05
F – initials on cambial perimeter – 585.1 ± 101.0 – 2.79 ± 1.86
Xylem fibres 12.84 ± 0.17 – 12.37 ± 0.07 1.49 ± 0.06
Phloem – – 13.94 ± 0.43 34.27 ± 9.02
Xylem ray parenchyma – – 14.10 ± 0.09 63.88 ± 4.13
Phloem ray parenchyma – – 9.03 ± 0.88 3.13 ± 0.56
F and R – terminal latewood cells – – 12.23 ± 0.13 0.113 ± 0.047
a
Development proceeds above all the threshold values given, except in the case of the terminal latewood cells, where development proceeds below the
values given.
b
F – fusiform cells. Terminal latewood cells derive from this type of cell, and also from ray initials, R, after both types of cells have become dormant.
c
A blank (–) in any of the boxes of the table indicates that the environmental variable referred to did not make a statistically significant contribution to
the regulation of the process of cell production.
Thresholds for secondary vascular development 569
cells during this time period. Unfortunately, the data collected
from tangential sections did not reveal whether the transverse
cell divisions in the rays (those inferred from tangential sec-
tions) proceeded simultaneously with the periclinal divisions,
the cell productions of which are seen in the cross-sections.
3.3. Phloem fibres and xylem vessels
In theory it should be possible to estimate the rate of devel-
opment of fibres in the more mature zones of the phloem
(Fig. 1); that is, the rate at which phloem parenchyma cells con-
vert to fibres. However, the sporadic distribution of the fibres
within an annual increment of secondary phloem tissue raises
a problem of how best to sample them for analysis. Their dis-
tribution suggests that the development of one group of fibres
precludes the development of another group in the immediate
vicinity. This would account for the staggered arrangement of
the groups between neighbouring tangential rows and for the
interpolation of new groups in the expanding region between
(or within) pre-existing rows (Fig. 1).
The same sampling problem potentially exists for the xylem
vessels (Fig. 1). However, their distribution is not so clustered.
The vessels arise within a radial cell file from a precursor cell
that has newly emerged from the cambium. If this cell is not
induced to become a vessel, it becomes a xylem fibre by default
[1]. Thresholds for xylem vessel development have been
recorded in a previous publication [16].
3.4. Fusiform cambial cells
Numbers of fusiform cambial cells, as recorded from cross-
sections of sectors of stems, were estimated in the two direc-
tions. In the first case, fusiform cells were counted along the
radial files in the xylem portion of the cambium (i.e., to the
inside of the cambial initials). In the second case, the total
number of fusiform initial cells (ray initial cells were ignored)
was estimated by extrapolation from cell counts along an arc
of the cambial perimeter. The number of fusiform cells in the
radial cell files is related to the number of periclinal divisions
in both the fusiform initials and their meristematic derivatives.
Their cellular kinetics are described elsewhere [2, 16] but, for
completeness, their thresholds and elemental rates of cell pro-
duction (α) towards the xylem are given in Tables II and III.
The estimated number of fusiform cells on the cambial
perimeter showed a regular stepwise increase from one season
to the next. This increase is due to the radial cell divisions
within these cells. The threshold for their development, and
their elemental (α) and maximal rates of production, are given
in Tables II and III.
Illuminance was statistically the best regulator for the
increase in cell numbers on the cambial perimeter – that is, the
number of initial cells produced by radial cell divisions. By
contrast, temperature and daylength together were shown sta-
tistically to be the best regulators of cell numbers within the
radial cell files of the vascular cambium [16]. In both cases, the
models, in terms of the respective developmental units derived
using the corresponding estimated basal values, accounted for
more than 95% of the variation in the sets of data.
The number of fusiform cells in the radial files on the xylem
side of the cambium varied with the time of year, increasing to
a maximum of about 10–11 cells in early summer, and then
decreasing as autumn approached. These periodic variations
are the consequence of the balance maintained between the rate
of periclinal cambial cell divisions and the rate of differentia-
tion of the cells as xylem fibres and parenchyma. In early sum-
mer, the rate of centripetal cell productions from the cambium
outpaces the opposing rate of centrifugal differentiation,
whereas in late summer, the number of dividing cells in the
radial files decreases because the rate of differentiation out-
paces the rate of cell production. More detailed analyses (not
shown here) revealed that during the period when the cambium
was decreasing radially, its circumference was still increasing.
This may be a consequence of distinct basal thresholds for
the two classes of cell division, periclinal and radial. When the
basal thresholds for fusiform cell divisions are crossed, the
cambium becomes effectively dormant.
Figure 2. Fitting the accumulated number of secondary xylem fibres
per radial file. (a) Fit of fibre numbers versus accumulated day-
degrees. There is still evidence of the original sigmoidal pattern of
fibre accumulation versus time. (b) Fit of accumulated fibre numbers
versus the developmental-time unit of accumulated day-degrees and
accumulated daylength values. The sigmoidal pattern of fibre accu-
mulation evident in (a) is absent and the linear fit is now significantly
(p < 0.05) improved.
a
b
570 P.W. Barlow, S.J. Powers
3.5. Cambial dormancy and terminal latewood cells
Approximately three dormant cambial cells, as judged by the
differential staining of their walls, were seen in each radial file
to the inside of the former initials (i.e., within the domain of the
xylem). The non-enlargement of one, or occasionally two, of
these cells during the spring of the following year helped to
identify a double band of flattened, parenchymatous terminal
latewood cells. These cells formed the boundary between one
completed annual growth increment and the one that was cur-
rently developing.
The statistical modelling revealed that the onset of develop-
ment of terminal latewood cells was insensitive to temperature
but was regulated by daylengths < 12.23 h (or by corresponding
dark periods > 11.77 h) (Tab. II). Such day-/night-time values
occurred between 25-09-1999 and 19-03-2000. Microscopic
observations of the transected stems showed that during this
period the percentage of radial files containing a terminal late-
wood cell increased progressively (data not shown) until each
file contained at least one such cell. On 20-09-99, 31% of sec-
ondary xylem radial files had one recognisable terminal late-
wood cell in the zone of the former cambium; on 01-11-99 and
13-12-99, the respective values were 66% and 83%. A com-
plete ring (97–100% of files with latewood cells) was evident
in samples taken after February in the following year, around
the time when nights were beginning to shorten. The threshold
for the development of this cell type was crossed in mid-March,
at which time latewood cell differentiation was complete.
The slow conversion of dormant cambial cells into a ring of
terminal latewood cells is indicated by the low value of α
(Tab. II). This rate applies only when the night period is > 11.77 h.
The dates on which maximal rates of terminal cell formation
occurred are shown in Table III.
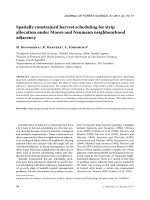
3.6. Predicting vascular development
Because of the completeness of the environmental data, it
was possible to calculate average parameter values for chosen
time periods. Accordingly, averages of temperature and day-
length per successive 28-day periods provided a set of values
across a year’s growth period. These average values define the
positions of the nodes of the polygon shown in Figure 4. The
polygon itself shows the relationship between temperature and
day-length during the one-year period. These two environmen-
tal variables are those which influence all the analysed second-
ary tissue developments, except for the cambial initials (see
Tab. II). Tracing around the polygon, there are 14 threshold
steps that govern the various types of cell productions. These
are superimposed upon Figure 4, thus providing a visual sum-
mary of the developmental pattern of the secondary tissue. Gen-
erally, the chronological pattern of tissue development – for
example, at what times of year the vascular cambium is active,
Table III. Conversion of the elemental rate,
α
, which refers to the number of new cells produced per cell per developmental-time unit, into
either the maximum number of cells added per radial cell file per day or the maximum number of cells produced per cell per day. The dates in
the last column are when conditions for maximum rates of cell production in the hybrid aspen trees were achieved in the years 1999 and 2000.
Cell type Developmental-time unit
α
× 10
4
Cells per cell per day (*) or cells
added per file per day (
†
)
a
Date of maximal cell addition
Fusiform cambial cells (periclinal
divisions towards the xylem)
Temperature and day-length
1.35
0.72
*
0.85
*
9-07-1999
19-06-2000
Fusiform cambial initials (radial
divisions)
Illuminance
2.79 0.12
*
on all occasions
13 dates between
2-06-1999 and 4-08-1999,
and between 24-04-2000
and 21-07-2000
Xylem fibre Temperature and Day-length
1.49
5.92
†
7.12
†
9-07-1999
19-06-2000
Xylem ray parenchyma Day-length
63.88
1.11
†
1.13
†
17-06-1999
23-06-2000
Phloem Day-length
34.27
0.63*
†
0.64*
†
17-06-1999
23-06-2000
Phloem ray parenchyma Day-length
3.13 0.15
†
17-06-1999
and
23-06-2000
Terminal latewood cells Day-length
0.11
0.019*
0.011
*
16-12-1999
4-01-2000
a
In the case of fusiform initial cells, the rate of cell production towards the xylem, the phloem, and within the cambial perimeter, have all to be consi-
dered. Hence, the overall maximal rate for the tri-directional cell production from the fusiform initials in the year 2000 is 0.12 + 0.85 + 0.64 = 1.61
cells per cell per day.
Thresholds for secondary vascular development 571
in which months phloem is being produced, and so on – con-
forms to the pattern summarised in Table I.
4. DISCUSSION
It is customary to assess rates of growth and development
in terms of a time-based increase in cell number. This is con-
venient in circumstances where environmental conditions are
unchanging. Hence, there would then be only two variables of
importance, cell number and time. In describing secondary vas-
cular development with the aid of the present model, where
composite developmental-time units are employed, the ques-
tion arises as to whether all the variables are necessary. All
combinations of the environmental variables were fitted, and
those considered critical were identified by means of statistical
significance. The fit for the secondary xylem fibre accumula-
tion, for example, was improved when day-length was included
as a variable (see Figs. 2a and 2b). The developmental-time unit
appropriate for xylem fibre production is therefore a tempera-
ture-day-length unit (Tab. II). In this circumstance, the basal
temperature, t
b
, was estimated as 12.84 °C ± 0.17, a value
higher than this (t
b
= 15.19 °C) was obtained when xylem fibre
development was considered in terms of degree-days only. The
inclusion of the third variable, illuminance, to the developmen-
tal-time unit did not improve the goodness of fit.
Some caution is necessary before regarding any variable as
non-critical. Even if its inclusion does not result in a statistically
significant improvement of the relationship between accumu-
lated cell number and the developmental-time unit, it could still
be a facilitating factor. For example, solar illuminance is clearly
the source of energy for the production of carbohydrate without
which development would not be possible [6], and Ford et al.
[5] found evidence that accelerated bursts of tracheid produc-
tion in stems of Picea sitchensis (up to 12 cells per file per day)
might be related to especially high levels of solar radiation.
However, in this last-mentioned study [5] wood samples were
taken every 12 h, and such close sampling times may reveal fea-
tures that escape notice when sampling is less frequent. In the
present case of hybrid aspen, the apparent non-dependence of
xylem fibre production upon illuminance, as shown through
modelling, may mean only that this environmental variable was
non-limiting for the development of this particular cell type.
Another, but different, set of environmental dependencies is
displayed by the developing radial files of secondary phloem
(Tab. II). Here, the best fit for cell number increase was found
when a day-length developmental-time unit was used. The
additional contribution from temperature to this model was not
statistically significant. Again, it should not be assumed that
temperature had no effect on the system, but only that day-
length had a more critical effect in its ability to account for var-
iablity in the data.
One assumption made with respect to the perception of tem-
perature and, indeed, to the other environmental variables also,
is that changes in temperature were registered instantly by the
developing system. In the general case, this is unlikely because
of the insulating property of the bark [19, 25]. The bark of the
experimental group of hybrid aspen trees was thin, however,
and it was supposed that, even if temperature tracking by the
cambium and xylem fibres (whose cell numbers show a tem-
perature dependency) were not exactly coincident with ambient
conditions, the systems would be in reasonable conformity with
the assumptions of the model. A study of bark, including that
of Populus species [15], did, in fact, show that the external tem-
perature of the bark could be quite similar to that recorded
simultaneously in the cambium. The results of a sensitivity
analysis [16] indicated that simultaneous tracking of the exter-
nal temperature by the internal tissues is not a critical require-
ment of the model. Nevertheless, if the thermal conductivity of
the overlying tissues were known, it might be possible to esti-
mate any lag in temperature perception.
The quite different day-length thresholds for phloem and
xylem ray parenchyma production (Tab. II) require comment.
The phloem rays undergo dilatation growth late in the year
(Tab. I). The lower threshold for phloem ray cell production
may be indicative of conditions which permit periclinal divi-
sions in locations other than the cambial zone. It is possible,
therefore, that the new cells accumulated in the dilatation zone,
and did so under the influence of a more permissive basal tem-
perature threshold. However, to show exactly where along the
ray these presumed periclinal divisions were occurring would
require careful measurement of radial cell lengths. The second-
ary division zone might then be found to correspond to a region
of ray, probably close to the dilatation zone, where cell lengths
show a periodic decrease.
Unlike the situation in the radial files of cambial fusiform
cells where the number of dividing cells can fluctuate, radial
files of cambial ray cells show no such expansion or contraction
of their cell division zone. There always seems to be just one
dividing ray file initial cell per radial file of ray parenchyma.
Similar thresholds probably apply to the periclinal divisions
which lead to new cells being introduced into the xylem and
phloem regions of the rays because the productions into both
zones seem to originate from a common ray initial cell.
Unfortunately, little is known of the vertical growth of the
rays. To study this requires the preparation of tangential stem
sections [1]. However, there does seem to be some rhythm in
this vertical aspect of ray growth as evidenced by the change
in ray cell numbers in the vertical plane.
The basal thresholds established for a given developmental
process were assumed to operate in two modes, as both an “on”
switch and an “off” switch. That is, the same parameter value
not only permitted a process to commence when the threshold
parameter value was exceeded, but also terminated that process
when the value fell below the threshold at, say, the end of the
growing season. One might object to this assumption on the
grounds that a dormant tree does not share the same physiolog-
ical state as one that is actively growing and, hence, the thresh-
old value which permits the transition from cambial dormancy
to activity does not need to be the same as that which renders
the active state dormant once more. From the present model-
ling, there is no way of telling whether this argument has any
merit. The estimated basal threshold values stated in Table II
are those which statistically satisfy both the activation and the
deactivation of a cell production process.
The two states of the cambium (active and inactive or dor-
mant) may also be regulated by means of a biotic variable to
which is linked a critical abiotic variable (such as one of the
three environmental factors studied). An example is the linkage
572 P.W. Barlow, S.J. Powers
between day-length and auxin [21], and between day-length
and gibberellin metabolism [4]. Auxin provides the permissive
endogenous physiological environment for cambial cell divi-
sions [23, 24]. Accordingly, a certain auxin status is a pre-con-
dition for the cambial system to become responsive to
environmental factors which further regulate its activity.
Sources of auxin are the young leaves [14] and, perhaps, the
expanding internodes of young stems. Thus, a certain number
of young leaves and internodes may need to have been devel-
oped in order for the auxin-dependent pre-condition for tem-
perature- or day-length-regulated cambial activation to be
fulfilled. By the same token, the reversion to dormancy may be
assisted by a curtailment of the production of young leaves.
It is likely that additional parameters, such as soil moisture
and nutritional levels, would also have been found to be critical
[7, 11] had they been allowed to make a variable impact on tis-
sue development. In the present experiments, daily watering
preserved an approximate constancy of soil moisture. A
decrease in soil moisture can lead to the appearance of “false”
growth rings [7] composed of a latewood-type of parenchyma-
tous cell, a cell type whose differentiation is possibly mediated
by both a temporary increase in the level of abscisic acid and
a decrease in the level of auxin required to maintain cambial
activity [12, 13]. With regard to nutrients, experiments with the
same clone of hybrid aspen have shown that the number of cam-
bial cells undergoing periclinal division is affected by the nitro-
gen (as ) status of the soil [8]. Low nitrogen, for example,
was found to diminish the rate of production of xylem fibres.
However, in the present case, the soil nitrogen levels were
maintained at a constant level.
Cytological changes within the radial cell files could also be
studied by the present model. For example, secondary xylem
fibres change from an immature state in which their cytoplas-
mic contents are present, to a mature state where the cells have
enlarged, their contents have autolysed, and the cell walls have
thickened [10, 17]. Phloem fibres could be particularly inter-
esting to study since they occur with predictable spacing pat-
terns, develop at particular times of the year (Tab. I), and then
Figure 3. Relationship of temperature and day-length during the tree-sampling period of 1999-2000. Each point represents the mean temperature
and day-length value for one day during each of the four seasons, spring, summer, autumn and winter. The nodes of the polygon inscribed in
the graph represent the mean values for successive 28-day periods, starting from day 1 on 14-04-1999. The vertical and horizontal lines in the
graph represent the threshold values for the accumulation of the indicated secondary vascular cell types. For periclinal divisions in the cambium,
and for the increase in the number of xylem fibres and vessels, accumulation is initiated to the right and above the respective vertical and horizontal
lines (indicated by arrows). For xylem and phloem ray cells, and for phloem, accumulation is initiated above their respective horizontal lines
(arrowed). For terminal latewood, accumulation is initiated below the horizontal line (arrowed). Fourteen transitions are marked (1–14). Accu-
mulation of a given cell type can occur only when the correct transition(s) has been passed.
NH
4
+
Thresholds for secondary vascular development 573
undergo further maturation into fibre sclereids within the bark
[18]. Detailed observation could thus reveal the thresholds
attending these more subtle, microscopic aspects of develop-
ment.
The day-length and temperature thresholds for the develop-
ment of the various secondary vascular cell types mentioned in
Table II were combined in a graph showing the relationship
between these two environmental variables. One way to visu-
alise the developmental sequence is to trace clockwise around
the polygon in Figure 3 that relates average monthly day-
lengths and temperatures. Wherever the trace cuts a threshold
line, then some developmental event either commences or ceases.
Such events show the expected temporal sequence in accord-
ance with the estimated environmental thresholds provided by
the modelling. In the present case, cambial and phloem cell pro-
duction slightly preceded xylem fibre formation and, likewise,
cambial activity ceased before differentiation of the cells pro-
duced by periclinal divisions had been completed. This intui-
tively conforms to biological reasoning about the process of
initiation and cessation of cell production in the cambial system.
Lastly, visible phenological events relevant to secondary
vascular development should not be ignored. In the present
material, for example, the onset of cambial activity in spring-
time was associated with the resumed growth of shoot buds and
the unfurling of their leaves (our unpublished data; see also [14,
21]). Conversely, the cessation of cambial development might
be coincident with senescence of these leaves and the entry of
the shoot buds into dormancy. The thresholds for these whole
plant events could therefore bear some relationship to the more
microscopic, histological aspects of development whose
thresholds have been indicated in Figure 3.
Acknowledgements: The trees used in this experiment were initially
raised by Professor B. Sundberg (Swedish Agricultural University,
Umeå, Sweden) and then maintained at the former Long Ashton
Research Station, University of Bristol. Much of the sectioned mate-
rial, and some of the cell counts, were prepared in the Institut für For-
stbotanik und Baumphysiologie, Albert-Ludwigs Universität, Freiburg,
Germany, by Dr L. Puech and Miss M. Wittenzellner, under the guid-
ance of Professor Dr S. Fink. Part of the work was supported by a grant
from the Commission of the European Communities.
REFERENCES
[1] Barlow P.W., From cambium to early cell differentiation within the
secondary vascular system, in: Holbrook N.M., Zwieniecki M. (Eds.),
Vascular Transport in Plants, Elsevier/Academic Press, Amsterdam,
2005, pp. 279–306.
[2] Barlow P.W., Brain P., Powers S.J., Estimation of directional divi-
sion frequencies in vascular cambium and in marginal meristematic
cells of plants, Cell Prolif. 35 (2002) 49–65.
[3] Bonhomme R., Bases and limits to using “degree.day” units, Eur. J.
Agron. 13 (2000) 1–10.
[4] Eriksson M.E., Moritz T., Daylength and spatial expression of a
gibberellin 20-oxidase isolated from hybrid aspen (Populus tre-
mula L. × P. tremuloides Michx.), Planta 214 (2002) 920–930.
[5] Ford E.D., Robards A.W., Piney M.D., Influence of environmental
factors on cell production and differentiation in the early wood of
Picea sitchensis, Ann. Bot. (1978) 683–692.
[6] Fritts H.C., Shashkin A., Downes G.M., A simulation model of
conifer ring growth and cell structure, in: Wimmer R., Vetter R.E.
(Eds.), Tree-Ring Analysis, CABI International, Wallingford,
1999, pp. 3–32.
[7] Glock W.S., Agerter S.R., Rainfall and tree growth, in: Kozlowski
T.T. (Ed.), Tree Growth, Ronald Press, New York, 1962, pp. 23–56.
[8] Hellgren J.M., Puech L., Barlow P., Fink S., Mellerowicz E.J.,
Sundberg B., Auxin and cambial growth rate in poplar, Sylvestria
268 (2003) 95–105.
[9] Hellmers H., Distribution of growth in tree seedling stems as affec-
ted by temperature and light, in: Zimmermann M.H. (Ed.), The For-
mation of Wood in Forest Trees, Academic Press, New York, 1964,
pp. 533–547.
[10] Horacek P., Slezingerova J., Gandelova L., Effects of environment
on the xylogenesis of Norway spruce (Picea abies [L.] Karst.), in:
Wimmer R., Vetter R.E. (Eds.), Tree-Ring Analysis, CABI Interna-
tional, Wallingford, 1999, pp. 33–53.
[11] Kozlowski T.T., Pallardy S.G., Growth Control in Woody Plants,
Academic Press, San Diego, 1997.
[12] Lachaud S., Participation of auxin and abscisic acid in the regula-
tion of seasonal variations in cambial activity and xylogenesis,
Trees 3 (1989) 125–137.
[13] Little C.H.A., Wareing P.F., Control of cambial activity and dor-
mancy in Picea sitchensis by indol-3-ylacetic and abscisic acids,
Can. J. Bot. 59 (1981) 1480–1493.
[14] Ljung K., Bhalerao R., Sandberg G., Sites and homeostatic control
of auxin biosynthesis in Arabidopsis during vegetative growth,
Plant J. 28 (2001) 465–474.
[15] Nicolai V., The bark of trees: thermal properties, microclimate and
fauna, Oecologia 69 (1986) 148–160.
[16] Powers S.J., Brain P., Barlow P.W., First-order differential equa-
tion models with estimable parameters as functions of environmen-
tal variables and their application to a study of vascular develop-
ment in young hybrid aspen stems, J. Theor. Biol. 222 (2003) 219–
232.
[17] Puech L., Türk S., Hodson J., Fink S., Wood formation in hybrid
aspen (Populus tremula L. × Populus tremuloides Michx.) grown
under different nitrogen regimes, in: Savidge R., Barnett J., Napier
R. (Eds.), Cell and Molecular Biology of Wood Formation, BIOS
Scientific Publishers, Oxford, 2000, pp. 141–153.
[18] Rees W., Shiue C J., The structure and development of the bark of
quaking aspen, Proc. Minn. Acad. Sci. 25–26 (1957–58) 113–125.
[19] Reifsnyder W.E., Herrington L.P., Spalt K.W., Thermophysical
properties of bark of shortleaf, longleaf and red pine, Yale Univer-
sity School of Forestry, Bulletin No. 70, 1967, pp. 1–40.
[20] Riedacker A., Rythmes de croissance et de régénération des racines
des végétaux ligneux, Ann. Sci. For. 33 (1976) 109–138.
[21] Schrader J., Baba K., May S.T., Palme K., Bennett M., Bhalerao
R.P., Sandberg G., Polar auxin transport in the wood-forming tis-
sues of hybrid aspen is under simultaneous control of developmen-
tal and environmental signals, Proc. Natl. Acad. Sci. 100 (2003)
10096–10101.
[22] Souèges R., Les Lois de Développement, Actualités Scientifiques
et Industrielles N° 521, Hermann, Paris, 1937.
[23] Uggla C., Moritz M., Sandberg G., Sundberg B., Auxin as a posi-
tional signal in pattern formation in plants, Proc. Natl. Acad. Sci.
USA 93 (1996) 9282–9286.
[24] Uggla C., Mellerowicz E.J., Sundberg B., Indole-3-acetic acid con-
trols cambial growth in Scots pine by positional signaling, Plant
Physiol. 117 (1998) 113–121.
[25] Vines R.C., Heat transfer through bark, and the resistance of trees
to fire, Aust. J. Bot. 16 (1968) 499–514.
[26] Went F.W., Sheps L.O., Environmental factors in regulation of
growth and development: ecological factors, in: Steward F.C. (Ed.),
Plant Physiology. A Treatise. Vol. VA: Analysis of Growth: Beha-
vior of Plants and their Organs, Academic Press, New York, 1969,
pp. 299–406.
[27] Zimmermann M.H., Brown C.L., Trees. Structure and Function,
Springer, Berlin, 1971.