Báo cáo lâm nghiệp: "Evapotranspiration of a declining Quercus robur (L.) stand from 1999 to 2001. I. Trees and forest floor daily transpiration" ppsx
Bạn đang xem bản rút gọn của tài liệu. Xem và tải ngay bản đầy đủ của tài liệu tại đây (459.55 KB, 10 trang )
503
Ann. For. Sci. 62 (2005) 503–512
© INRA, EDP Sciences, 2005
DOI: 10.1051/forest:2005055
Original article
Evapotranspiration of a declining Quercus robur (L.) stand
from 1999 to 2001. I. Trees and forest floor daily transpiration
Caroline VINCKE
a
*, Nathalie BREDA
b
, André GRANIER
b
, Freddy DEVILLEZ
a
a
Unité des Eaux et Forêts, Faculté d’ingénierie biologique, agronomique et environnementale, Université Catholique de Louvain,
Croix du Sud, 2/9, 1348 Louvain-la-Neuve, Belgium
b
Équipe bioclimatologie-Écophysiologie. INRA-Centre de recherches de Nancy, 54280 Champenoux, France
(Received 15 November 2004; accepted 2 March 2005)
Abstract – Water use of a Quercus robur (L.) declining stand was estimated from 1999 to 2001 by measuring independently tree canopy and
herb layer transpiration. Two plots differing in density were compared. Oak daily sap flux density kinetic is well synchronised with potential
evapotranspiration (PET) daily time course. Despite differences in density, stand structure and LAI spatial organisation, oak transpiration
(T,mmd
–1
) is quite the same between plots. The declining trees are very responsive to the PET fluctuations, but their daily response is low
(T ≤ 1 mm d
–1
; T/PET < 0.3). A combination of soil constraints and low, disorganised LAI could induce this low transpiration capability.
According to its phenology, density and the above canopy closure, the herbaceous layer contributes to at least the same but often more water
consumption than the oak (up to 2.9 mm d
–1
). Therefore it cannot be neglected in water balance calculations.
sap flux / tree transpiration / herbaceous transpiration / LAI / oak decline
Résumé – Evapotranspiration d’un peuplement de chêne pédonculé (Quercus robur L.) dépérissant, de 1999 à 2001. I. Transpiration
journalière des arbres et de la strate herbacée. L’utilisation de l’eau par un peuplement de chênes dépérissant (Q. robur L.) a été estimée de
1999 à 2001 par des mesures indépendantes de transpiration des arbres et de transpiration de la strate herbacée. Deux parcelles de densité
différente ont été comparées. Les cinétiques journalières de densité de flux de sève des chênes sont bien synchronisées avec celles de
l’évapotranspiration potentielle (ETP). Malgré des différences de densité et de structure des parcelles ainsi que d’organisation spatiale de
l’indice foliaire (LAI), la transpiration des chênes (T, mm j
–1
) est sensiblement la même dans les deux parcelles. Les arbres dépérissants
répondent aux fluctuations de l’ETP, mais leur transpiration journalière est faible (T ≤ 1mm j
–1
; T/ETP < 0.3). La combinaison de contraintes
hydriques et d’un LAI faible et désorganisé pourrait induire cette faible capacité transpiratoire. Selon sa phénologie, sa densité et la fermeture
de la canopée, la strate herbacée consomme souvent plus d’eau que les chênes (jusqu’à 2.9 mm j
–1
). Elle ne peut dès lors pas être négligée dans
le calcul du bilan hydrique de ces parcelles.
flux de sève / transpiration ligneuse / transpiration herbacée / indice foliaire / dépérissement du chêne
1. INTRODUCTION
Whole-tree estimates of water use have been the subject of
numerous researches since the 1930’s. Among the available
techniques, heat dissipation and heat-pulse methods have been
increasingly used [41, 42] because they give insight in tree
physiology through sap flux radial pattern and velocity [21, 38].
Forest water use can be estimated on a ground area basis from
whole-tree water use measurements if appropriate scalars are
used [50]. Yet, forest heterogeneity complicate this task espe-
cially in mixed and/or multi-layered stands. For instance,
according to its development, the herbaceous cover contributes
to stand water use from 6% to 65% [3, 20, 28, 37].
Water use of several broad-leafed species have already been
studied, among which Quercus petraea [7], Quercus robur [10]
and Fagus sylvatica [11, 18]. But few studies treated the case
of declining stands, pedunculate oak declining stands in par-
ticular [5, 44]. Whereas Becker and Lévy [1, 2] demonstrated
that Q. robur decline was mainly due to recurrent and intense
droughts, still no tree water use measurements have been done
on such trees. Among the decline symptoms, a disorganised
branching pattern, a foliage reduction, the clustering of leaves
are usually observed [29, 33]. Tree physiology is altered as well
as the overall forest structure through the impacts of a less dense
canopy cover. Therefore one can reasonably assume that
declining stands and/or trees present a water use regulation dif-
ferent from that of healthy ones.
The objectives of this paper are to estimate (i) water use of
declining pedunculate oaks and (ii) forest floor water use, in
two plots differing in density and canopy structure and during
3 successive years (1999–2001). On the basis of those results,
a companion paper [48] estimates stand daily evapotranspira-
tion from 1999 to 2001, and discuss the relative contribution
of each layer in the stand water use.
* Corresponding author:
Article published by EDP Sciences and available at or />504 C. Vincke et al.
2. MATERIALS AND METHODS
2.1. Environmental settings
The study area is located in the South of Belgium (50° 06’ N, 4°
16’ E; Fig. 1) at an elevation of 260 m. Topography is flat. Climate is
humid temperate with mean annual precipitation of 960 mm and mean
temperature of 8.4 °C. Mean annual potential evapotranspiration
(PET) is 526 mm, with 88% occurring between April and October
(maximum in July and August).
Soils are dystric Cambisol [15]. The B structural horizon rests on
a clayey substratum (up to 51.8% of clay) appearing at 30 cm depth;
a temporary ground water table is present from late fall to late spring
with an upper limit around 0.35–0.5 m deep. The water table floor cor-
responds to poorly weathered schist stratum, located at 1.7–2.1 m
depth [39]. The water table drops rapidly below 0.70 m depth (in aver-
age, from mid-June until mid-September). Those soils present severe
signs of hydromorphy. Though the soil horizons are dense at depth >
0.45 m, roots were observed down to 1.6 m [47]. The soil water reserve
was estimated to be 600 mm at field capacity by the use of soil moisture
measurements (Thetaprobes, Delta-T, Cambridge, UK; data not
shown).
The forest stand, 2.4 km
2
in extent, was planted on an agricultural
land in 1892 with Pinus sylvestris L. and Quercus robur L. The former
was delivered as soon as it competed the oaks. During the 1940’s, dif-
ferent broad-leaved species were introduced in the understorey (Pru-
nus avium L., Fraxinus excelsior L., Quercus rubra L., Betula sp.,
Acer pseudoplatanus L., Alnus sp.). The forest floor vegetation is con-
stituted mainly by Circaea lutetiana L., Stachys sylvatica L., Carex
pendula Huds., Athyrium filix femina (L.) Roth and Rubus fruticosus
L., the latest being the most covering. In the control plot, Prunus
spinosa L. shrubs are found in patches.
2.2. Experimental design and environmental monitoring
A thinned plot (Th.; 1682 m
2
) and a control one (C.; 1323 m
2
) were
created in 1993. In each plot, oaks are arranged in five rows; two more
rows separate the plots. Thinning (May 1993) removed 32% of oak
basal area. Most of the thinned trees were healthy or suffering from
less than 25% of crown leaf loss according to visual assessment [43].
Decline symptoms appeared since the mid 1980’s. In 1999, oak crowns
were more than 25% defoliated in 60% and 40% of the thinned and
the control plots trees, respectively.
The present study started 6 years after thinning, i.e., in 1999 and
up to 2001. In the thinned plot (Tab. I), oak density remained constant
during the 3 years (107 trees ha
–1
) and basal area increased from 13.8
to 14.2 m
2
ha
–1
. In the control plot, density and basal area decreased
respectively from 189 to 159 trees ha
–1
and from 20.9 to 18.3 m
2
ha
–1
.
The average height of oak in both plot is 24 m.
Besides pedunculate oak, forest overstory basal area is dominated
by Acer pseudoplatanus L. (Th.: 10%; C.: 11.3%) and Fraxinus excel-
sior L. (Th.: 5.3%; C.: 8%) ; Prunus avium L. and Quercus rubra L.
contribute respectively for 2.7% and 1.1% in the control plot and Quer-
cus rubra L. contributed for 4.2% in the thinned plot. Total overstory
basal area was 17.5 m
2
ha
–1
in the thinned plot and 28 m
2
ha
–1
in the
control one (Tab. I). Quercus rubra and Fraxinus are part of the dom-
inant canopy respectively in the thinned and the control plot; Acer is
an intermediate species, reaching approximately 17 m in both
plots [46].
LAI-2000 Plant Canopy Analyser (Li-Cor, Lincoln, NE, USA) and
litterfall collection measurements were managed to estimate tree LAI
[46]. Total Leaf Area Index (LAI, Tab. I) for the three years was respec-
tively 3.6, 3.1 and 3.5 in the thinned plot (75% from pedunculate oak,
14% from Q. rubra and 5% from Acer) and 4.3, 3.7 and 4.2 in the con-
trol plot (53% from pedunculate oak, 25% from Acer and 11% from
Fraxinus).
An automatic weather station (PAMESEB, Libramont, Belgium)
monitored the local climate in an open area 1 km from the stand at an
hourly time step: precipitation (1 m height), wind speed (anemometer
“Thermistor”, 1.8 m height), global radiation (photovoltaic sensor
“solar Haeni 130”, 1.5 m height), air temperature (resistance sensor
“Thermistor”, 1.5 m height) and relative humidity (psychrometer
“Thermistor”, 1.5 m height) were recorded. Potential evapotranspira-
tion (PET) was calculated according to the Penman formula [36].
2.3. Sap flux density (SFD) measurements and ligneous
stand transpiration (T)
Xylem sap flux density (SFD, l H
2
O h
–1
dm
–2
sapwood) was mon-
itored on 3 (1999) and 4 (2000–2001) pedunculate oaks and on 1 maple
(2000–2001) in each plot (Tab. II). Sampled oaks were representative
of the plot’s mean basal area tree circumference (Th.: 125 cm; C.:
115 cm) and were suffering from less than 25% leaf loss. Radial sap-
flow sensors [16] were inserted 1.3 m above soil surface in the north
side of stems, to avoid direct solar heating. Those sensors (UP GmbH,
Figure 1. Geographical localization of the study site in Belgium.
Table I. Oak basal area (G, m
2
ha
–1
), oak mean circumference at breast-height (C
130
, cm), oak density (N ha
–1
) and maximum LAI in 1999,
2000 and 2001; basal area (G, m
2
ha
–1
) and maximum LAI when considering all tree species in each plot (All). Th.: Thinned; C.: Control.
1999 2000 2001
Oak All Oak All Oak All
GC
130
N ha
–1
LAI G LAI G C
130
N ha
–1
LAI LAI G C
130
N ha
–1
LAI LAI
Th. 13.8 126.4 107 2.8 17.4 3.6 14 127.2 107 1.9 3.1 14.2 128 107 2.5 3.5
C. 20.9 116.2 189 2.8 28 4.3 19 118.1 166.3 2.3 3.7 18.3 118.8 158.7 2.5 4.2
Transpiration in a declining oak stand 505
Cottbus, Germany) consist in a pair of probes, 2 cm long and 0.2 cm
in diameter each, inserted in a radial orientation behind the cambial
zone. The probes were placed into freshly bored holes separated ver-
tically by 15 cm. The temperature difference between the heated and
reference probes (∆T) was recorded and by comparing it with the max-
imum occurring at predawn (Tmax), SFD was calculated according to
Granier [16]. ∆T was recorded every minute from bud break to leaf
fall and 30-min averages were stored using a DL3000 (Delta-T, Cam-
bridge, UK). For each tree, sap flow (SF, l h
–1
) was obtained by mul-
tiplying SFD by sapwood area (SA, dm
2
). Oak SA was measured on
cores taken at 130 cm height at the end of the 1999 growing season.
For maple, SA (cm
2
) was derived from an allometric relationship
(Eq. (1)) with diameter at breast-height (DBH, cm), cited in Mathieu
[31]:
SA = 0.565 DBH
2
R
2
= 0.947 (1)
Oak SA reached 3.2 m
2
ha
–1
(296 cm
2
per tree) in the thinned plot and
4.2 m
2
ha
–1
(243 cm
2
per tree) in the control plot. For Acer, SA was
respectively 0.24 m
2
ha
–1
and 1.45 m
2
ha
–1
. Sapflow sensors were
replaced each year. Oak and maple daily stand transpiration (T, mm d
–1
)
were calculated as follows [7]:
T = Σ Tj (2)
with
T
j
= SA
j
/GA Σ SFD
i
p
i
(3)
where j stands for a species, GA for the ground area (m
2
), SFD
i
is the
sap flux density of tree i (l h
–1
dm
–2
) and p
i
is the proportion of trees
with sapwood area SA
i
in the stand (Tab. III). Oak and maple SFD are
considered as representative of the ring-porous (Quercus rubra, Frax-
inus excelsior) and diffuse-porous (Betula sp., Prunus sp., Crataegus
sp., Carpinus betulus, Fagus sylvatica) species, respectively.
2.4. Herbaceous transpiration and LAI
Herbaceous transpiration was measured during 6 days in 2001
growing season (4 in the thinned plot and 2 in the control one) with a
mobile closed chamber [13]. This device is a parallelepiped chamber
of 0.76 × 0.76 × 1 m (0.563 m
3
) composed of transparent plastic walls
with removable base and top. The chamber is equipped with 4 PAR
Quantum sensors (Skye instruments LTD, Powys, UK), one psy-
chrometer H301/TR (Vector Instruments, Rhyl, UK), one air temper-
ature probe SKTS 200 (Skye instruments LTD, Powys, UK) and 3 ven-
tilators (to homogenise air humidity). One measurement location was
chosen in each plot, representative of that plot herbaceous species
composition and cover. At the beginning of a measurement, the cham-
ber is set down on the location and kinetics of 2–3 min, with records
of each instrument every 2 s, are realised. Between measurements, the
chamber was opened and displaced to be aerated. For each kinetics
(20 to 30 per day) a transpiration rate per ground area is derived
(E
k
,mms
–1
). The integration of each E
k
measurement gives the daily
transpiration (E
d
, mm d
–1
). It should be noted that this device inte-
grates soil evaporation as well: output is rather the herb layer eva-
potranspiration.
Forest floor LAI was estimated by collecting all leaves in each plot
on 1 m
2
areas in May, June and November 2001 and in January 2002.
The leaves were then surfaced with Scion Image Software (Scion cor-
poration, Frederick, USA).
3. RESULTS
3.1. Sap flux densities diurnal pattern
Daily time courses of mean SFD (L dm
–2
h
–1
) per plot
(Fig. 2) for DOY 162 of each year (PET ≈ 2.7 mm d
–1
in all
years) showed an asymmetrical bell-shaped curve, with a steep
Table II. For 1999, 2000 and 2001, characteristics of the trees equipped with radial flowmeters, per plot (Th.: Thinned; C.: Control) and per
species: tree number (No.), period during which measurements were performed (Years), circumference in 1999 (C
i
,
cm), sapwood thickness
(cm) and sapwood area (SA, cm
2
), crown projected area (S
c
, m
2
), total height (H, m), height of first epicormic shoots occurrence (H
e
, m), trunk
height below crown (H
c
, m), visual UE crown assessment (CEE) and annual circumference increment measured with dial-dendro (I
c
, cm).
Sapwood Height 1999 2000 2001
Species No. Years C
i
Thickness SA S
c
HH
e
H
c
CEE I
c
CEE I
c
CEE I
c
Th
2
Quercus
robur
1 1999–2001 122.8 4.6 456.2 36.3 22.7 3.7 13.3 1 0.8 1 0.8 1 0.8
2 1999–2001 130.5 2.55 288.2 46.1 25.2 9.6 12.6 2 0.5 2 0.75 2 0.45
3 1999–2001 112.8 3.4 318.7 45.4 22.9 6 11.4 2 0.3 2 1 2 0.8
4 1900–2001 131.2 2.45 279.3 58.7 22.9 3 10.9 1 0.85 1 0.9 1 1.2
Acer 5 1900–2001 77.7 5.83 345.6 57.5 17 – 2.2 – – – – – –
C
2
Quercus
robur
1 1999–2001 114.4 1.95 198.9 29.2 24.4 5.6 13.8 1 0.9 1 1.1 1 0.6
2 1999–2001 121.1 2.45 256.6 56.5 23.6 5.2 10.8 1 0.55 1 0.9 1 0.8
3 1999–2001 129.9 2.9 232.2 57.8 25.9 12.3 14.3 1 0.4 1 0.4 2 0.45
4 2000–2001 124.9 3 318.7 52 24.9 6.2 14.8 1 – 2 – 2 –
Acer 5 2000–2001 40.5 3.02 93.9 25.7 13.9 – 5.6 – – – – – –
Table III. For each plot (Th.: Thinned; C.: Control), frequency of
pedunculate oak trees by sapwood area class (SA) expressed in num-
bers of trees (N) and percentages (pi, %); No. is the number of the
tree equipped with radial flowmeters (cf. Tab. II).
SA (cm
2
)
Th. C.
1999–2001 1999 2000–2001
NpiNo. N pi No. N pi No.
100 4 22.2 – 15 60 1 13 56.5 1
200 5 27.8 2–(4) 3 12 2 3 13 2
300 5 27.8 3 4 16 3 4 17.4 3–4
400 4 22.2 1 3 12 3 13 –
{
{
{
{
506 C. Vincke et al.
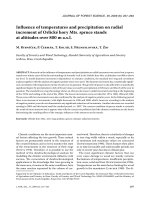
increase in the morning until a maximum value around 8:30
a.m. (UT). For all years, mean SFD is higher in the thinned plot
than in the control one. In years 1999 and 2001, mean SFD daily
time course present similar curves in shape and amplitude
(maximum SFD is 1.5–2 L dm
–2
h
–1
in the thinned plot,
1.5 L dm
–2
h
–1
in the control one) whereas in year 2000, both
plots have mean SFD lower than 1 L dm
–2
h
–1
. Mean SFD
observed during 1999, 2000 and 2001 seasons (not shown)
were, respectively for the thinned and the control plot and from
1999 to 2001, 2.5–2–2.75 L dm
–2
h
–1
and 1.7–1.5–2 L dm
–2
h
–1
.
When comparing SFD between trees with similar SA but from
different plot, SFD in the control tree (No. 4 in Tab. II) was 74%
SFD in the thinned one (No. 3 in Tab. II).
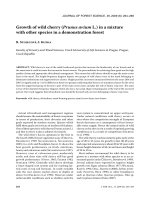
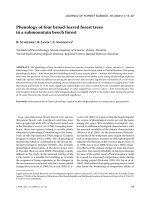
Oak SFD daily time course follows closely PET daily time
course (Fig. 3), even if the PET curves are smoother. Maple
SFD appears to be maximal later (DOY 193 in 2001), i.e. around
11:30–12:00 (UT) and to end up earlier than oak SFD, which
is probably a consequence of its intermediary position in the
canopy [30].
3.2. Inter-tree Sap Flux Density variability
Each tree relative contribution to total SFD per period
(% SFD, Tab. IV) and the variation coefficient among trees
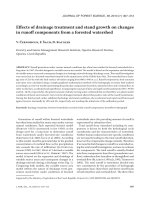
Figure 2. Pedunculate oaks mean sap flux density (SFD, l dm
–2
h
–1
)
per plot (Th.: thinned; C.: control) for days with comparable PET
(2.7 mm), in June (DOY 162 in 1999 and 2000, DOY 163 in 2001).
Each curve is the average of all trees SFD for a given plot (see Tab. IV
for the number of trees considered).
Figure 3. Daily sap flux density (SFD,
l dm
–2
h
–1
) kinetics of the thinned and
control trees for two days per year
(DOY). Days are chosen with similar
PET. Heavy line: PET; black lines:
thinned oaks; grey lines: control oaks;
grey line with open symbol: Acer in the
control plot.
Transpiration in a declining oak stand 507
(cv%) gave information on the representativeness of each
measured tree: this is important for the up-scaling to stand. In
1999, cv% is always lower than 0.3%, which meant that the
respective contribution of each tree to total SFD per day is quite
the same. Nevertheless, in both plots, a variation is observed
within the trees. For example, in the thinned plot, tree No. 3 and
No. 1, which are the ones with the largest SA, contribute more
to daily SFD. In the control plot, excepted for the periods of
leaf flushing, the gradient was No. 3 > No. 2 > No. 1, which
corresponds to a decreasing ranking of SA and crown area
(Tab. II). In 2000, the tendency observed in the thinned plot is
not confirmed (and cv% are high), whereas in the control plot,
the same ranking is observed between trees. In 2001, the cv%
are high but data are difficult to interpret for several reasons:
(i) in the thinned plot, 2 periods out of 3 occur during leaf-flush-
ing and caterpillars attacks, when variability is probably
increased and (ii) in the control plot, sap flow measurements
dysfunction rendered each period unique and impossible to
compare with the others.
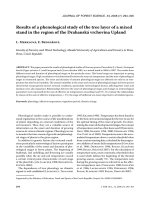
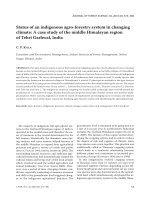
3.3. Tree daily transpiration
The seasonal time course of daily transpiration followed
closely the fluctuations of PET (Fig. 4). In 1999, maximum oak
transpiration in the control plot (1 mm d
–1
) was higher than in
the thinned plot (0.6 mm d
–1
). In 2000, no differences were
observed between plots and stand daily transpiration was
around 0.6 mm d
–1
. For technical reasons, the Acer transpiration
could only be measured accurately in September and daily tran-
spiration rate reached 0.6 mm d
–1
. In 2001, frequent flowmeters
dysfunction occurred during the monitoring period. The bud-
ding of leaves is responsible for the increase of SFD up to 1
mm d
–1
in the control plot and 0.8 mm d
–1
in the thinned one,
between DOY 138 and 146. Right after, SFD decreased, prob-
ably as the result of caterpillars attacks, low PET and of the
beginning of soil water depletion.
Daily oak transpiration diverged strongly with linearity with
increasing PET (Fig. 5), with an inflexion point around PET =
4 mm d
–1
. The T/PET relationship was therefore characterised
linearly for PET < 4 mm d
–1
(Tab. V). The slope of the T/PET
relationship is always < 0.3, with a minimum in 2000 (0.16 in
the thinned plot and 0.19 in the control one). The importance
of LAI as a limiting factor of stand transpiration has been dem-
onstrated [19]. For each year and each plot, T/LAI was calcu-
lated for oaks and was always < 0.3. Except for 2001, T/LAI
was larger in the control plot: it varied from 0.19 to 0.27 in the
thinned plot and from 0.23 to 0.26 in the control one. In
Figure 6, ΣT/ΣPET (over a season) is expressed as a function
of oak LAI. ΣT/ΣPET inter-annual variation with oak LAI is
larger in the thinned plot, whereas in the control one, ΣT/ΣPET
increases with oak LAI. Yet, both plots ΣT/ΣPET relationships
with LAI are consistent with the overall relationship of these
parameters, as measured in other forests (Fig. 6b).
3.4. Herbaceous transpiration and driving variables
Except for DOY 131, before oak budburst, the herbaceous
transpiration measurement days were characterised by a vari-
able weather, with radiation being mainly diffuse (Tab. VI).
Daily time course of transpiration rate E
k
(Fig. 7) demonstrated
no specific trend. E
k
never exceeded 0.14 mm s
–1
(DOY 131).
A correlation was found with below canopy PAR (PAR
bc
;
µmol m
–2
s
–1
):
E
k
= 0.000068.PAR
bc
+ 0.04; R
2
= 0.61. (4)
With equation (4), E
k
was calculated over the sunny hours
at the end of a measurement day. No E
k
calculation has been
done over the first hours of the days because leaves of the under-
storey were still wet at that time (dew deposition). By integrat-
ing E
k
over the entire sunny period, we calculated E
d
(mm d
–1
,
Fig. 8). The maximum is observed before tree bud break, with
a daily value of 2.9 mm. During the leafy period, forest floor
transpiration never exceeded 0.7 mm d
–1
. At the beginning of
leaf fall, daily transpiration raised up to 1.8 mm d
–1
. Forest floor
LAI (Fig. 8) reached maximal values almost identical to oak LAI
Table IV. For each year and each plot (Th.: Thinned; C.: Control),
percents of each oak (No.; cf. Tab. II) in the daily total sap flux den-
sity (% SFD) and variation coefficient (cv% = standard deviation/
arithmetic mean) per period (in julian days). Periods are uniform in
terms of measured trees. Periods marked with an * are leaf flushing
or caterpillars attack; periods marked with an
+
correspond to leaf fall.
Year Plot Period
% SFD
cv%
No. 1 No. 2 No. 3 No. 4
1999
Th.
150–165* 35 – 36 29 0.20
166–218 35 – 32 33 0.08
219–240 34 – 36 30 0.10
241–303
+
32–38300.17
C.
150–156* 33.5 28.5 38 – 0.14
157–214 33.5 32 34 – 0.07
215–240 30 33 37 – 0.13
241–303
+
28 34 38.5 – 0.21
2000
Th.
147–212 39 – 22 39 0.35
213–249 – – 35.5 64.5 0.41
C. 147–249 24 33 43 – 0.37
2001
Th.
139–152* 23 20 18 39 0.40
153–167* 32.6 18 15 34 0.42
184–283 32 – 29 39 0.23
C.
150–170* 37 63 – – 0.47
184–195 – 38 35 27 0.21
221–238 27 44 – 29 0.32
242–283 36 – – 64 0.43
Table V. For each year and each plot (Th.: Thinned; C.: Control),
oak maximum LAI (LAI), the slope of the T = ƒ (PET) regression for
PET ≤ 4 mm d
–1
(T/PET), and T/LAI (mm j
–1
m
–2
), with LAI being
oak maximum LAI.
Year
Th. C.
LAI T/PET T/LAI LAI T/PET T/LAI
1999 2.8 0.21 0.16 2.8 0.26 0.17
2000 1.9 0.16 0.34 2.3 0.20 0.26
2001 2.45 0.28 0.16 2.45 0.22 0.21
508 C. Vincke et al.
values, especially in the thinned plot. E
d
seasonal evolution was
closely related to LAI of the upper layer, as demonstrated by
the following equation:
E
d
(mm) = – 0.9574.LAI + 4.3701; R
2
= 0.8215. (5)
4. DISCUSSION
4.1. Tree SFD and transpiration (T)
In the thinned plot, oak trees SFD are higher than in the con-
trol plot, with exceptions for some periods in trees with large
SA or crowns. The canopy in the thinned plot is more open, with
SA distributed between fewer trees, with larger and more
exposed crowns to light. When integrated to stand scale, the
control plot transpired more, as far as oak is concerned, mainly
because of that species greater density. The inter-tree variabil-
ity, estimated through the relative contribution of each tree to
total daily SFD, confirmed that in thinned and/or declining
stands SFD is more heterogeneous [6, 25, 26]. Our results in
the thinned plot showed that from year to year, despite its SA
or crown area, a tree SFD may be ranking upwards or down-
wards depending on biological events like caterpillar attacks
and their consequences on LAI.
Falge et al. [14] and Wullschleger et al. [51] stated that one
of the most important aspects that emerge from sap flow
Figure 4. Oak daily transpiration (T,
mm d
–1
) and potential evapotranspira-
tion (PET, mm d
–1
) in each plot for 1999,
2000 and 2001 growing season.
Transpiration in a declining oak stand 509
measurements in trees occupying different places in a canopy,
is to estimate how a forest structure or a canopy stratification
influences forest water use. Maple SFD daily time course
(Fig. 3) demonstrated well that each species position in the can-
opy architecture has consequences upon its water use. Maple,
which is an intermediate species, transpired water on a shorter
day period than oak, a dominant species.
The day to day variation of T suggest that oaks are very
dynamic in their response to PET. Still, the daily rates of T are
very low (0.6 to 1 mm d
–1
). Other studies cited daily values of
2–3 mm d
–1
in oak [6, 10]. In this case, these low values could
be attributable to the low LAI or eventually local dryness. Oak
LAI is effectively lower than LAI of healthy trees of same age,
which are around 5–6 [8]. These low daily rates of T could also
be a consequence of xylem water transport impairment via
xylem embolism in root and/or stems [34]. Some errors may
arise from the sapflow measurement itself, associated with
scaling tree estimates [9] or with ring-porous water conducting
elements [22]. Some literature focused on sapflow measure-
ment systems comparison [12, 25, 50], but no generalisation
could be made on the reliability of one method among others.
Studies of inter-annual trends in water use of forests offer
the opportunity to study a spectrum of biotic and abiotic con-
ditions [37]. The interactions between transpiration, climate,
LAI, can then be studied [4]. Except in 1999, no differences
between oak stand transpiration have been observed between
plots: in both plots, the T/PET ratios were very low. Bréda and
Granier [4] cited values of 0.4 to 0.89 for an oak stand; ermák
et al. [10], for hundred-years old non declining pedunculate
oaks cited T/PET values of 0.8, as well as Nizinski et al. [35].
This probably results from interacting biological and physical
factors: soil constraints (clay content of about 46%, high bulk
density, shrink-swell behaviour [39]), the low oak LAI (cater-
pillars and decline) can explain those low rates of transpiration,
which in turn can explain the low T/PET, PET being relatively
very much higher and therefore dampening every transpiration
rise. Control trees in this case respond more to PET (and LAI)
than thinned ones, the reason being probably linked with LAI
spatial organisation, more heterogeneous in the thinned plot.
Plus, an important part of thinned trees LAI is located on epi-
cormic branches.
T/LAI are also low and coupled with ΣT/ΣETP = ƒ (LAI), it
reinforced the role of LAI as the main limiting factor of transpira-
tion [6, 17, 28]. Körner [24] also pointed out that in temperate
deciduous forests, the dominant factor of stand transpiration is
LAI, with clear transitions between dormancy periods (leaf
less) and expanding leaves during growing season. In the
Table VI. Characteristics of the 6 days in 2001 during which forest
floor transpiration was measured ; Plot (Th.: thinned; C.: control),
day of year (DOY), incident global radiation (Rg
o
, J cm
–2
), below
canopy PAR (PAR
bc
, µmol m
–2
s
–1
), potential evapotranspiration
(PET, mm d
–1
), LAI (tree total LAI), and mean temperature inside the
chamber (T°, °C).
Plot DOY Rg
o
PAR
bc
PET LAI T°
Th. 131 1975 784 4.9 (1.1) 27.5
Th. 173 1327 263 3.9 3.05 16.9
C. 213 1948 49.5 2.5 4.1 20.2
Th. 223 1526 208.5 2.5 3.5 17.9
C. 241 1535 51.6 1.6 3.9 18.5
Th. 284 731 94.2 1.1 2.5 15.2
Figure 5. Oak daily transpiration (T,
mm d
–1
) as a function of PET (mm d
–1
)
for 1999, 2000 and 2001 growing
seasons.
Figure 6. (a) ∑T/∑PET as a function of oak
LAI (1999: from DOY 150 to 304; in 2000:
from DOY 147 to 249; in 2001: from DOY
137 to 282); (b) same values but compared
with other forest stands reviewed from lite-
rature in different species and site condi-
tions [19], including Quercus stands.
ŠC
510 C. Vincke et al.
thinned plot, the LAI structure inter-annual variability (due in
part to caterpillar attacks) could be responsible for the apparent
non correlated relationship between T/PET and LAI. The Acer
transpiration measurements were managed mainly to estimate
the contribution of diffuse porous species in the stand transpi-
ration. Even though they occupy an intermediate position in the
canopy architecture, yet they contribute greatly to the stand
water use (up to 0.6 mm d
–1
).
4.2. Forest floor evapotranspiration
In most of forest water use studies, herbaceous transpiration
is deduced as the residual term of forest water use minus tree
Figure 7. Daily kinetics of forest floor transpira-
tion (E
k
, mm s
–1
; closed symbol) and of PAR
bc
(µmol m
–2
s
–1
; open symbol). Each point is the
value of evapotranspiration fluxes inside the
closed chamber on a 2–3 min period. The hours
are expressed in decimal hours (h + min/60), in
Universal Time.
Figure 8. E
d
(mm d
–1
) as measured with the closed
chamber during 6 days in 2001 (lozenges and dotted
line). Stand (triangles and heavy line) and herba-
ceous (histograms) LAI seasonal dynamics are
shown as well.
Transpiration in a declining oak stand 511
water use. Few authors tested the effectiveness of enclosed
chamber systems [13, 45] which measure directly the water use
of a small forest floor surface. In this case, forest floor (evapo-)
transpiration appeared to be closely related to LAI and therefore
to canopy structure [23, 49] which determines the fraction of
the available energy to be delivered to herbs. None of the meas-
urement days was very warm and bright so higher transpiration
rates probably occurred during the vegetation period. Still, this
layer plays an important role in the forest water use, with max-
imal values being more than twice oak maximal daily water use.
Shrubs transpiration has not been estimated (Prunus spinosa L.
in the control plot) but Phillips and Oren [37] showed that their
contribution to stand transpiration is < 3%. In terms of water
use management, how can an understorey compete with trees?
Canopy closure induces a decrease in herbaceous transpiration
(as a consequence of Rg
bc
diminution). Nevertheless, this strata
stays competitive for water. During dry periods, transpiration
reduction concerns more the trees than the herbs [5], those
being more “coupled” with the atmosphere. Roberts et al. [40],
Loustau and Cochard [27], McNaughton and Jarvis [32] also
confirmed the substantial raise of herbaceous transpiration con-
tribution to stand transpiration during dry summer. Still, some
uncertainties persist: rooting depth of herbaceous is not known
(and therefore its consequences upon water sources), as well
as their drought tolerance and their inter-specific differences of
transpiratory behaviour.
Acknowledgements: We thank the Forest and Nature Division in Bel-
gium, more particularly the Chimay division, for the stand disposal.
We also thank the CDAF laboratory (Chimay) for its helpful assistance
for data collection. Thanks also go to F. Hardy, L. Gerlache,
G. Rentmeesters, V. Van Hese (UCL) and P. Gross (INRA-Nancy) for
technical assistance.
REFERENCES
[1] Becker M., Lévy G., Le dépérissement du chêne en forêt de Tron-
çais. Les causes écologiques, Ann. For. Sci. 39 (1982) 439–444.
[2] Becker M., Lévy G., Croissance radiale comparée de chênes adultes
(Q. robur L. et Q. petraea (Matt.) Liebl.) sur sol hydromorphe
acide: effet du drainage, Acta Oecol. Oecol. Plant. 7 (1986) 123–
143.
[3] Black T.A., Kelliher F.M., Processes controlling understory evapo-
transpiration, Phil. Trans. Roy. Soc. London B 324 (1989) 207–
231.
[4] Bréda N., Granier A., Intra- and inter-annual variations of transpi-
ration, leaf area index and radial growth of a sessile oak stand
(Quercus petraea), Ann. For. Sci. 53 (1996) 521–536.
[5] Bréda N., Peiffer M., Étude du bilan hydrique des chênaies de la
forêt domaniale de la Harth (Haut-Rhin) et impact des épisodes de
sécheresse sur la croissance radiale des chênes, Rapport scientifi-
que ONF/INRA, 1998, 60 p.
[6] Bréda N., Granier A., Aussenac G., Effects of thinning on soil and
tree water relations, transpiration and growth in an oak forest
(Quercus petraea (Matt.) Liebl.), Tree Physiol. 15 (1995) 295–306.
[7] Bréda N., Cochard H., Dreyer E., Granier A., Water transfer in a
mature oak stand (Quercus petraea): seasonal evolution and effects
of a severe drought, Can. J. Forest Res. 23 (1993) 1136–1143.
[8] ermák J., Práx A., Water balance of a Southern Moravian flood-
plain forest under natural and modified soil water regimes and its
ecological consequences, Ann. For. Sci. 58 (2001) 15–29.
[9] ermák J., Nadezhdina N., Sapwood as the scaling parameter-defi-
ning according to xylem water content or radial pattern of sap flow?
Ann. Sci. For. 55 (1998) 509–521.
[10] ermák J., Ulehla J., Ku era J., Penka M., Sap flow rate and trans-
piration dynamics in the full-grown oak (Quercus robur L.) in floo-
dplain forest exposed to seasonal floods as related to potential eva-
potranspiration and tree dimensions, Biol. Plant. 24 (1982) 446–
460.
[11] ermák J., Cienciala E., Ku era J., Hallgren J E., Radial velocity
profiles of water flow in trunks of Norway spruce and oak and res-
ponse of spruce to severing, Tree Physiol. 10 (1993) 367–380.
[12] Clearwater M.J., Meinzer F.C., Andrade J.L., Goldstein G., Hol-
brook N.M., Potential errors in measurement of nonuniform sap
flow using heat dissipation probes, Tree Physiol. 19 (1999) 681–
687.
[13] Cochard H., Utilisation d’un système de type “enceinte fermée”
pour l’estimation de la transpiration journalière d’un sous-bois de
pin maritime (Pinus pinaster Ait.), DEA Écologie végétale, 1988,
37 p.
[14] Falge E., Ryel R.J., Alsheimer M., Tenhunen J.D., Effects of stand
structure and physiology on forest gas exchange: a simulation study
from Norway spruce, Trees 11 (1997) 436–448.
[15] FAO, ISSS Working Group Reference Base. World Reference Base
for Soil Resources: Keys to Reference Soil Groups of the World,
World Soil resource Report No. 84, FAO, Rome, 1998, 88 p.
[16] Granier A., Une nouvelle méthode pour la mesure du flux de sève
brute dans le tronc des arbres, Ann. For. Sci. 42 (1985) 193–200.
[17] Granier A., Évapotranspiration des forêts, C. R. Acad. Agric. Fr. 82
(1996) 119–132.
[18] Granier A., Biron P., Lemoine D., Water balance, transpiration and
canopy conductance in two beech stands, Agric. For. Meteorol. 100
(2000) 291–308.
[19] Granier A., Bréda N., Biron P., Villette S., A lumped water balance
model to evaluate duration and intensity of drought constraints in
forest stands, Ecol. Model. 116 (1999) 269–283.
[20] Granier A., Loustau D., Saugier B., Berbigier P., Bilan hydrique de
deux peuplements de pin maritime dans les Landes: évaluation des
flux des strates ligneuse et herbacée et de leur variabilité, in: ATP
PIREN, Influence à l’échelle régionale des couvertures pédologi-
ques et végétales sur les bilans hydriques et minéraux du sol, Rap-
port final, 1989, pp. 287–315.
[21] Granier A., Biron P., Bréda N., Pontailler J.Y., Saugier B., Strate-
gies for monitoring and modeling CO
2
and water vapor fluxes over
terrestrial ecosystems, Thematic issue with selected papers presen-
ted at a workshop held at La Thuile, Valle d’Aosta, Italy, 5–9 Mars
1995, Glob. Change Biol. 96 (1996) 265–274.
[22] Granier A., Anfodillo T., Sabatti M., Cochard H., Dreyer E.,
Tomasi M., Valentini R., Bréda N., Axial and radial water flow in
the trunks of oak trees: a quantitative and qualitative analysis, Tree
Physiol. 14 (1994) 1383–1396.
[23] Jarvis P.G., McNaughton K.G., Stomatal control of transpiration:
scaling up from leaf to region, Adv. Ecol. Res. 15 (1986) 1–49.
[24] Körner C., Leaf diffuse conductance in major vegetation types of
the globe, Ecol. Stud. 100 (1994) 463–490.
[25] Köstner B., Granier A., ermák J., Sapflow measurements in forest
stands: methods and uncertainties, Ann. For. Sci. 55 (1998) 13–27.
[26] Köstner B.M.M., Schulze E.D., Kelliher F.M., Hollinger D.Y.,
Byers J.N., Hunt J.E., Mcseveny T.M., Meserth R., Weir P.L.,
Transpiration and canopy conductance in a pristine broad-leaved
Š
C
Š
C
Š
C
š
c
Š
C
š
c
Š
C
512 C. Vincke et al.
forest of Nothofagus – An analysis of xylem sap flow and eddy-
correlation measurements, Oecologia 91 (1992) 35–359.
[27] Loustau D., Cochard H., Use of a portable transpiration chamber
for estimating evapotranspiration in the Molinia caerulea understo-
rey of a maritime pine stand, Ann. Sci. For. 48 (1991) 29–45.
[28] Lüttschwager D., Rust S., Wulf M., Forkert J., Hüttl R.F., Tree
canopy and herb layer transpiration in three Scots pine stands with
different stand structures, Ann. For. Sci. 56 (1999) 265–274.
[29] Malaisse F., Burgeon D., Degreef J., Deom B., Van Doren B., Le
dépérissement des chênes indigènes en Europe occidentale,
Note 1 : symptômes de perte de vitalité – Fiche technique n° 2,
Belg. J. Bot. 126 (1993) 191–205.
[30] Martin T.A., Brown K.J., ermák J., Ceulemans R., Ku era J.,
Meinzer F.C., Rombold J.S., Sprugel D.G., Hinckley T.M., Crown
conductance and tree and stand transpiration in a second-growth
Abies amabilis forest, Can. J. For. Res. 27 (1997) 797–808.
[31] Mathieu F., Étude de la transpiration des couverts d’érable à sucre
et de sapins baumiers à partir de mesures de flux de sève et de mesu-
res micrométéorologiques : de l’arbre au peuplement, DEA en
Fonctionnement physique, chimique et biologique de la biosphère
continentale, INA-PG, Paris VI, ENS, 1999, 55 p.
[32] McNaughton K.G., Jarvis P.G., Predicting effects of vegetation
changes on transpiration and evaporation, in: Kozlowski T.T. (Ed.)
Water deficits and plant growth, VII, NY, Academic Press, 1983,
pp. 1–47.
[33] Nageleisen L M., Les dépérissements d’essences feuillues en
France, Rev. For. Fr. 45 (1993) 605–620.
[34] Nardini A., Salleo S., Trifilo P., Lo Gullo M.A., Water relations and
hydraulic characteristics of three wood species co-occurring in the
same habitat, Ann. For. Sci. 60 (2003) 297–305.
[35] Nizinski J., Morand D., Saugier B., Variation of stomatal resistance
with leaf age in Quercus petraea: effect on the soil-water balance
of an oak forest, Ann. For. Sci. (1989) 429–432.
[36] Penman H.L., Natural evaporation from open water, bare soils, and
grass, Proc. R. Soc. Ser. A. 193 (1948) 120–145.
[37] Phillips N., Oren R., Intra- and inter-annual variation in transpira-
tion of a pine forest, Ecol. Appl. 11 (2001) 385–396.
[38] Phillips N., Oren R., Zimmermann R., Radial patterns of xylem
sapflow in non-, diffuse- and ring-porous tree species, Plant Cell
Environ. 19 (1996) 983–990.
[39] Rémy J., Carte des sols de la Belgique: planchette de Seloignes
190E,
Centre de cartographie des sols de Belgique méridionale,
1980, Gembloux.
[40] Roberts J., Pymar C.F., Wallace J.S., Pitman R.M., Seasonal chan-
ges in leaf area, stomatal conductance and transpiration from brac-
ken below a forest canopy, J. Appl. Ecol. 17 (1980) 409–422.
[41]Smith D.M., Allen S.J., Measurements of sap flow in plant stems,
J. Exp. Bot. 47 (1996) 1833–1844.
[42] Swanson R.H., Significant historical developments in thermal
methods for measuring sap flow in trees, Agric. For. Meteorol. 72
(1994) 113–132.
[43] Thierron V., Gloesener Y., André P., Rapport final du projet “mise
au point et application de traitements de restauration”, UCL, Unité
des Eaux et Forêts, 1995, 75 p.
[44] Thomas F.M., Hartmann G., Soil and tree water relations in mature
oak stands of northern Germany differing in the degree of decline,
Ann. For. Sci. 53 (1996) 697–720.
[45] Vaugeois Y., Étude des échanges de CO
2
au niveau d’un sous-bois
de pin maritime, INRA, Laboratoire d’écophysiologie Cestas-
Gironde, 1994, 27 p.
[46] Vincke C., Approche écophysiologique des flux d’eau au sein
d’une chênaie pédonculée (Q. robur L.) dépérissante sur sol à
régime hydrique alternatif, Thèse, UCL, 2003, 392 p.
[47] Vincke C., Delvaux B., Porosity and avalilable water of tempora-
rily waterlogged soils in a Quercus robur (L.) declining stand, Plant
Soil 274 (2005) 189–203.
[48] Vincke C., Granier A., Bréda N., Devillez F., Evapotranspiration of
declining Quercus robur (L.) stand from 1999 to 2001. II. Daily
actual evapotranspiration and soil water reserve, Ann. For. Sci.
(2005) (in press).
[49] Wedler M., Heindl B., Hahn S., Köstner B., Bernhofer C., Tenhunen
J.D., Model-based estimates of water loss from “patches” of the
understory mosaic of the Hartheim Scots pine plantation, Theor.
Appl. Climatol. 53 (1996) 135–144.
[50] Wullschleger S.T., Meinzer F.C., Vertessy R.A., A review of
whole-plant water use studies in trees, Tree Physiol. 18 (1998) 499–
512.
[51] Wullschleger S.D., Wilson K.B., Hanson P.J., Environmental con-
trol of whole-plant transpiration, canopy conductance and estimates
of the decoupling coefficient for large red maple trees, Agric. For.
Meteorol. 104 (2000) 157–168.
Š
Cšc
To access this journal online:
www.edpsciences.org