Báo cáo lâm nghiệp: "Designing decision support tools for Mediterranean forest ecosystems management: a case study in Portugal" pptx
Bạn đang xem bản rút gọn của tài liệu. Xem và tải ngay bản đầy đủ của tài liệu tại đây (1.02 MB, 10 trang )
751
Ann. For. Sci. 62 (2005) 751–760
© INRA, EDP Sciences, 2005
DOI: 10.1051/forest:2005061
Original article
Designing decision support tools for Mediterranean forest ecosystems
management: a case study in Portugal
André O. FALCÃO
a
*, José G. BORGES
b
a
Departamento de Informática, Edifício C6, Faculdade de Ciências da Universidade de Lisboa, Campo Grande,
1700 Lisboa, Portugal
b
Departamento de Engenharia Florestal, Instituto Superior de Agronomia, Universidade Técnica de Lisboa, Tapada da Ajuda,
1349-017 Lisboa, Portugal
(Received 21 January 2005; accepted 18 May 2005)
Abstract – The effectiveness of Mediterranean forest ecosystem management calls for the conceptualization and implementation of adequate
decision support tools. The proposed decision support system encompasses a management information system, a prescription simulator, a
constraint generator and a set of management models designed to solve decision problems. Emphasis is on the architecture of the prescription
simulator and its linkage to the three other modules, as well as on methods for reporting and visualizing solutions. Results are discussed for a
real world test case – Serra de Grândola, a management area with about 18 600 ha comprising 860 cork oak (Quercus suber L.) land units. Cork
oak silviculture adds complexity to the traditional forest management problem. Results show that the devised system is able to address
effectively the integration of ecosystem data, silviculture, growth-and-yield and management models. They further suggest that the proposed
system architecture may help address the complexity of Mediterranean ecosystem management problems.
forest management / Mediterranean ecosystems / prescription simulation / decision support systems / cork oak
Résumé – Concevoir des outils de support de décision pour la gestion des écosystèmes forestiers méditerranéens : une étude de cas au
Portugal. L’efficacité de gestion de l’écosystème méditerranéen requiert la conception et l’implantation d’outils de support à la décision
adaptés. Le système d’aide à la décision proposé comprend un système de gestion de l’information, un simulateur de prescriptions, un généra-
teur de contraintes et un ensemble de modèles de gestion conçus pour la résolution de problèmes de décision. L’accent est mis sur la description
de l’architecture du simulateur de prescriptions et de ses liens avec les trois autres modules. Sont également décrites les méthodes de présenta-
tion et de visualisation de scénarios alternatifs. Les résultats obtenus sur un cas réel, la Serra de Grândola, située au sud du Portugal (qui cor-
respond à la gestion d’une superficie de 18 600 ha dont 860 unités de gestion de chêne liège (Quercus suber L.) ) sont discutés. Le chêne liège
est une espèce dont la spécificité engendre une gestion complexe. Les résultats montrent que le système est capable de résoudre avec succès
l’intégration des données, des modèles de sylviculture, croissance et développement ainsi que des modèles de gestion. L’analyse des résultats
suggère que le système proposé permet de traiter la complexité de gestion de l’écosystème méditerranéen.
gestion forestière / écosystème méditerranéen / simulation / système de décison / chêne liège
1. INTRODUCTION
Management alternatives, activities or prescriptions consist
of a schedule of cultural treatments for a specific management
area within a given planning horizon. According to Davis et al.
[10] developing, evaluating and applying prescriptions is the
central activity of professional forestry. Ecosystem manage-
ment objectives determine the number and the complexity of
prescriptions. As the diversity of objectives increases, demand
grows for comprehensive natural resources inventories and for
new land classification schemes with more detailed, land-unit
prescriptions [2]. Automated simulation of prescriptions is thus
a key functionality of an ecosystem management decision
support system [1].
A decision support system (DSS) is an interactive and flex-
ible set of computer-based tools that integrate the insights of
the decision maker with information processing capabilities in
order to improve the quality of decision-making [19, 47, 48].
The prescription simulator is a key component of an ecosystem
management decision support system (EMDSS), as it allows
the automated generation of all management options available
to the decision maker. Other modules of the system include a
management information system (MIS) that stores both spatial
and aspatial data from Mediterranean ecosystems to provide
* Corresponding author:
Article published by EDP Sciences and available at or />752 A.O. Falcão, J.G. Borges
information appropriate for planning, and a set of models to
address specific ecosystem management problems. [5, 8, 20,
23, 25, 34, 38, 39, 41, 45] present examples or applications of
prescription simulators. Nabuurs and Paivinen [29] further
compare several decision support tools for large-scale forestry
modeling. [31–33, 46] report the development of decision sup-
port modules for some Mediterranean ecosystems.
In this paper we present a cork oak prescription simulator
and we further discuss a common framework for conceptual-
izing and implementing decision support tools for Mediterra-
nean forest ecosystem management. Research on the basic
components of decision support tools specific to the Mediter-
ranean region is discussed. Both the specificity of Mediterra-
nean prescription simulation and its integration within an
EMDSS are emphasized. The description of a scalable and
interactive EMDSS will address (a) database interaction;
(b) linkage to growth and yield models; (c) interactive silvicul-
ture modeling; and (d) linkage to management models – math-
ematical representations of ecosystem management scheduling
problems. The proposed system architecture is implemented
and an application is presented.
Dry and hot summers and rainy winters characterize the
Mediterranean ecosystem climate and contribute to fire risk and
ecosystem fragility [40]. Although this biome represents less
than 2% of the continental area, it encompasses about 20% of
the world’s floristic richness [26, 35]. This biodiversity is
reflected in Mediterranean human-forest ecosystems with con-
trasting silviculture models. Cork oak (Quercus suber L.) is a
characteristic species of the Mediterranean basin and its main
product (cork) is one of the most important assets in the Por-
tuguese forest sector. According to the Portuguese Forest
Inventory [11], it represents about 22% of the forest cover in
Portugal, totalling about 713 000 ha. Further, the specificity of
cork oak management turns out to be a challenge for natural
resource management modeling and information systems
development. Serra de Grândola, a cork oak management area
located in Southern Portugal was thus used to test the proposed
EMDSS. Its ability for automating the simulation of a large
number of prescriptions for cork oak stands was assessed. The
EMDSS capabilities to help decision-makers evaluate and
select simulated prescriptions and to provide information for
scenario analysis were assessed by solving three cork oak eco-
system management example problems.
2. MATERIALS AND METHODS
2.1. The test problem
Serra de Grândola, a management area with about 18 600 ha com-
prising 860 cork oak land units located in Southern Portugal was used
to test the proposed EMDSS. The ecological importance of Serra de
Grândola is highlighted by its classification as a CORINE Biotope
(C-108) and its integration in the set of sites proposed to be part of the
EU network Natura 2000. The main cover types are dominated by cork
oak and umbrella pines (Pinus pinea L.). These species may occur in
pure or mixed composition, and in even-aged or uneven aged stands
[37]. Spacings also vary. Higher densities are generally found at higher
altitudes. In the past, land use has led to erosion and soils are generally
thin. Agro-forestry activities, namely range management, are con-
ducted in most stands [37].
The ‘montado’ ecosystem is generally managed as an agro-forestry
system. Most stands are uneven-aged and have densities of 70 to
150 trees per ha when mature. The first debarking cannot take place
until the tree perimeter at breast height reaches 70 cm. Thus cork oak
debarking usually starts at the age of 30 years. Current legislation fur-
ther prescribes a minimum tree debarking cycle of 9 years. A land unit
debarking cycle usually ranges from 1 to 9 years as trees in the same
uneven-aged stand often distribute unevenly between “years since
debarking” classes. In some cases, a land unit debarking period may
encompass more than one year, i.e., a debarking entry in a land unit
may last for more than one year. Thinnings occur in debarking years
and remove recently debarked trees. Trees may live up to about
150 years or more. Cork oak ecosystem management modeling is a
particularly complex task, for both tree growth and cork production
must be taken into account.
A local development organization and a forest landowners associ-
ation set up the Mediterranean ecosystem management problem for
decision-making at Serra de Grândola. These non-governmental
organizations (NGO) provide both technical and management assist-
ance to landowners and information to develop policy instruments for
sustainable practices to central and local government agencies. The
intelligence phase of decision analysis concluded that natural
resources inventory and assessment in both areas were priorities [37].
Further, it pointed out the importance of estimating cork production
potential in Serra de Grândola over short to medium terms. Previous
efforts to model cork oak ecosystem management used either classical
methods (e.g. [7]) or assignment models (e.g. [2]). In order to comply
with the NGO information requirements and to test the proposed archi-
tecture for a prescription simulator and its integration within an
EMDSS, the system is used initially to simulate a set of management
prescriptions and the generated simulated information is then used by
a set of management models. These, will define the appropriate man-
agement plan to each land unit selected, according to a set of user spec-
ifications.
2.2. Architecture requirements for a prescription
simulator for Mediterranean forests
An automated prescription simulator is a key module of an
EMDSS. Its design should take into account both efficiency and effec-
tiveness issues. First, the simulator should be able to retrieve data from
several ecosystem types stored in MIS. Second, the system should be
fully scalable, i.e. capable of dealing with different cover types and
growth models without compromising ease and efficiency of use, thus
simulating prescriptions according to user-defined silviculture models.
Finally, the output of every prescription simulation should be in a for-
mat compatible with alternative management models (e.g. linear pro-
gramming matrix format) so that the system may be used to address
different Mediterranean ecosystem management problems.
2.2.1. Linkage to a management information system
A MIS within a typical EMDSS stores physical, vegetative, devel-
opment and administrative attributes of land units (e.g. forest stands).
It also stores topological data to allow spatial recognition and analysis
of land units within the landscape, thus integrating Geographic Infor-
mation System (GIS) functionalities. Further, it stores financial and
economic data. The linkage between a MIS and a prescription simu-
lator should take into account efficiency and effectiveness considera-
tions. First, it should provide easy access to a set of spatial and aspatial
data from the MIS so that the user may select the ecosystem area where
decisions are to be made. The system should thus enable the user to
select land units in the ecosystem area either by querying the database
for specific attributes (e.g. region, management area name, cover type,
major forest use, species, site index, date of last inventory) or by direct
Mediterranean forest decision support system 753
selection through a GIS. The latter allows the user to select land units
based solely on geographical and topological characteristics (e.g. loca-
tion, adjacency or proximity).
Second, the system must provide a capability for interpreting data
from a land unit. This interpretation is a prerequisite for selecting and
applying an adequate production or conservation function (e.g. growth
and yield models, wildlife and habitat models) for both simulating pre-
scriptions and computing resource flows. For example, some models
may need site index and stand age as inputs while others may require
individual tree information and specific ecological data. Third, an
additional capability for linking financial and economic data, i.e. unit
costs and prices, to cultural treatments is key for estimating revenue
and cost flows associated with each prescription in each land unit. This
capability ensures that thinnings, harvests, fertilizations and other cul-
tural treatments’ economic returns are computed based on the charac-
teristics of the land units where they occur. The development of the
proposed Mediterranean prescription simulator addressed these three
major MIS linkage issues. It is a standalone module that can link to a
MIS with the required data model. Currently, it accesses a MIS [27,
[37] that stores data from the most important Portuguese forest eco-
system types. Ecosystem areas encompass over 85 000 ha and are clas-
sified into over 12 000 land units. Access to ecosystem data is
performed through a set of internal queries that organize the informa-
tion needed by the growth models within the prescription simulator.
2.2.2. Prescription simulation and system adaptability
The success of prescription simulation depends on the availability
of models to project conditions and outcomes in each land unit over
time [10]. Growth and wildlife models are constantly being changed
and improved. Furthermore, the storage of data from other Mediter-
ranean ecosystems in the MIS may induce the insertion of new models
in the system. Thus, the architecture of a prescription simulator should
be flexible to allow for model updating and insertion. The simulator
should encapsulate models so that its coding is independent of the
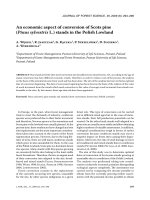
implementation of other components of the system. Further, interface
with the user is provided through input forms that allow for the spec-
ification of simulation parameters and silvicultural practices (Fig. 1).
For example, the user interface encompasses a set of forms with ranges
of feasible values for parameters such as rotation age or cutting cycle
based on the interpretation of data from the land units. This interface
is key for interactive definition of adequate cultural treatments in each
land unit in a Mediterranean ecosystem.
The development of the proposed Mediterranean prescription sim-
ulator addressed these issues. Both stand-level and individual-tree-
growth models were implemented within the system. Currently, it
encompasses six main models:
(a) The GLOBULUS 1.0.1. [43] stand-level growth model, a growth
model for eucalypt (Eucalyptus globulus, Labill) plantations in
Portugal;
(b) The DUNAS [12] a stand-level growth model for maritime pine
stands (Pinus pinaster, Ait) on the Portuguese northern coastal
region;
(c) The Oliveira [30], stand-level growth model for maritime pine
stands (Pinus pinaster, Ait) on Portuguese inland regions;
(d) The SUBER 1.0.0. [44] individual-tree model used for cork oak
simulations;
(e) The MONTADO [14] hybrid individual-tree-stand-level model is
also implemented;
(f) The HORTAS [18] stand-level model to assess growth and yield
for several species (e.g. Quercus robur L., Castanea sativa L.
Betula pubescens L., Pseudotsuga menziesi Franco) in the Portu-
guese central mountainous region.
Each model is connected to a model wrapper through a data-centric
interface. The wrapper provides access to the MIS and supplies each
model with the required input information in a standardized format
(Fig. 1). Wildlife habitat concerns (e.g. wild boar (Sus scrofa L.)) are
further addressed by the system through an adequate use of landscape
metrics [16].
2.2.3. Linkage to management models
Model building to address ecosystem management problems
requires utilities (e.g. matrix generators) that translate prescription
data into adequate input files that may be read by management models
in the EMDSS. The solution proposed involves the definition of three
data structures:
MAS – (for Management AlternativeS) stores general data for each
prescription (land unit ID, prescription ID, net present value resulting
Figure 1. Integration of decision support tools within the EMDSS.
754 A.O. Falcão, J.G. Borges
from applying the prescription (it includes the sum of individual oper-
ations discounted values and the bare land value) and age at the ending
inventory).
PRODS – (for PRODuctS) stores data that describes operations and
outputs resulting from the application of each prescription to each land
unit. Several product types can be considered.
CONS – (for CONStraints) stores data related to user requirements
for each product in each planning period.
These data structures complement each other thus facilitating
model building to address several ecosystem management problems.
The prescription simulator identifies each product with a unique code
and the second data structure may thus record several types of outputs
that may result from a prescription in a planning period. The simulator
output structure follows the definition of a relational model in the third
normal form ([9], pp. 288–312). It is therefore capable of future exten-
sions without affecting current applications ([9], pp. 79–100). It is pos-
sible, for example, to add one extra field to the data structure PRODS
(e.g. cost resulting from one operation), with no impact on the basic
system structure. Notwithstanding, there are some product types that
cannot be included within this data structure. Examples include spatial
outputs such as patch size or edge length. Yet, providing topological
information to management models can circumvent this limitation, for
these product types may be calculated dynamically as the optimisation
process runs (e.g. [3, 13]). In addition to prescription data, the simu-
lator is then able to provide topological information and other pertinent
data required for building management models [17]. Another optional
data structure provides additional information required to link pre-
scription simulation information to a real time 3D-visualiser.
Generally, management models require the generation of matrices
to describe the decision problem (e.g. [5, 22]). The system includes a
module that allows the generation of formulations in the LP format
[21]. It can also produce output files with the forest topological struc-
ture so that spatially constrained models may be solved (e.g. [13, 15,
16]). The structure of the output files has thus been designed to incor-
porate the requirements of several optimisation and heuristic tech-
niques. Further, the simulated data produced by the models is exported
to the wrapper through a common data format (Fig. 1). This frame-
work facilitates the introduction of other management models in the
system.
The current system provides linkages to a set of management prob-
lem types (e.g. unconstrained timber net present value optimization,
timber net present value optimisation subject to flow constraints, tim-
ber net present value optimization subject to adjacency constraints,
timber net present value optimization subject to flow constraints and
to minimum harvest patch size constraints). The system further ena-
bles the selection of specific models to solve a management problem
type. For example, for timber net present value optimisation subject
to flow constraints the user may select simulated annealing, tabu
search, evolution programs or Lagrangean relaxation.
2.2.4. Implementation of the basic interface
The current implementation of the prescription simulator has an
extensible modular structure. The program was developed in Visual
Basic 6.0, under Windows 2000. Yet the compiled program runs in
any Win32 platform (Windows 95/98, Me, 2000 or XP). Visual Basic
was chosen due to its rapid prototyping capabilities, robust interface
design, and extensive graphics capabilities. The integrated program-
ming environment further contributed to reduce the development
cycle. The systems architecture allows for easy linkage to GIS inter-
faces thus facilitating information interpretation by the end users. The
prescription generator is able to display simple maps that can be used
for interactive selection of management units or to depict accom-
plished management plans. These geographical visualization tools
were incorporated in the system through an integrated ActiveX [6]
component (ESRI’s MapObjects LT). As the tool produces simple
ArcView files, the outputs can be further analysed and interpreted in
a desktop GIS, such as ESRI’s ArcView
2.3. Cork oak prescription simulation
The simulation of cork oak prescriptions encompasses the defini-
tion of both the debarking cycle for each tree in the land unit and the
thinning regime. The prescription simulator may consider three
debarking models. The inputs to the first model (Model A) are both
the minimum and the maximum number of years of a land unit debark-
ing cycle and the timing of the first debarking for each land unit. In
order to run this model the prescription simulator interprets inventory
data to estimate the “number of years since debarking” for all trees in
all land units. Afterwards it simulates land unit debarking cycles start-
ing in the year when the first debarking is to take place. Trees with a
“number of years since debarking” lower than 9 at that year will not
be debarked. Their debarking will be delayed until the next debarking
in that land unit starts. From then on all trees in a land unit will be
debarked in the same year. For example, if land unit debarking cycles
range from 9 to 11 years, as many as 31 prescriptions may be simulated
over a 20-year planning horizon (Tab. I).
The inputs to the second model (Model B) encompass the minimum
number of years in a tree debarking cycle, the range of years in a
debarking period and the number of levels of periodic land unit cork
yield intensities. Again, in order to run this model the prescription sim-
ulator interprets inventory data to estimate the “number of years since
debarking” for all trees in all land units. It further estimates the max-
imum and the minimum periodic cork yields for each land unit over
the planning horizon. Intermediate yield values are defined by inter-
polation. Afterwards, debarking operations are simulated according to
a simple rule. Trees in each land unit are sorted in descending order
according to the “number of years since debarking”, and debarked in
that order, until one of two situations occurs: (a) the required land unit
periodic yields are reached or (b) there are no more trees in the land
unit with the “number of years since debarking” equal or larger than
the minimum of years in a tree debarking cycle. In the latter case,
despite debarking all available trees, the required periodic land unit
yields may not be satisfied. For example, consider a case with a range
of 1 to 3 years debarking period, with three levels of periodic land unit
cork yield intensities. If the prescription simulator estimates that the
land unit minimum and maximum periodic yields are 250 and 300 kg,
respectively, then the program may simulate up to 9 different options:
1. Every year harvest 250 kg of cork;
2. Every year harvest 275 kg of cork;
3. Every year harvest 300 kg of cork;
4. Every two years harvest 500 kg of cork;
5. Every two years harvest 550 kg of cork;
6. Every two years harvest 600 kg of cork;
Table I. Intervention periods for a sample management alternative
generation using simultaneous debarking for a 20-year planning
horizon.
Prescription 1st Debark 2nd Debark 3rd Debark
111019
211020
3110
411120
31 9 20
Mediterranean forest decision support system 755
7. Every three years harvest 750 kg of cork;
8. Every three years harvest 825 kg of cork;
9. Every three years harvest 900 kg of cork.
The third model (Model C) takes as input a range of years to define
the tree debarking cycle. The prescription generator checks all trees
in each period and if the “number of years since debarking” is equal
or larger than the years in that cycle the tree is debarked; otherwise it
is not debarked.
The simulator and prescription generator let the user select three
land unit density target levels (sparse, normal and dense). Users are
asked too to define the minimum number of years between harvest
entries. The thinning regime is then simulated according to the inter-
pretation of inventory data and selected target levels. In order to reduce
cork production losses, the prescription simulator only allows for thin-
nings in debarking years – only recently debarked trees may be har-
vested in a thinning operation.
In general, the output of a cork oak ecosystem management prob-
lem may encompass up to 7 cork types. Each type is characterized by
its evenness and thickness. Yet, due to the limitations of the growth
model and scarce inventory information, only one cork type was con-
sidered for testing purposes.
2.4. Simulated annealing as a solution method
Usually management models are based on a typical Model I for-
mulation [22]:
( 1 )
subject to,
∀i (2)
(3)
(4)
(5)
where,
N = the number of land units;
M
i
= the number of alternatives for land unit i;
P = the number of products;
T = the number of planning periods;
x
ij
= binary variable that is set equal to 1 if alternative j is chosen for
land unit i and to 0 otherwise;
c
ij
= net present value associated with alternative j for land unit i. It
includes the value of the ending inventory;
v
ijpt
= yield of product p in period t that results from assigning alter-
native j to land unit i;
d
pt
= deviation allowed from target volume level of product p in
period t;
V
pt
= target volume level of product p in period t.
Equation (1) defines the objective of maximizing net present value
(NPV). Equation (2) states that there must be one, and only one pre-
scription per stand. Equations (3) and (4) define the maximum and
minimum yields per product and planning period. Finally, equation (5)
ensures that the solution is integer. Strategic estimates of cork produc-
tion do not require an integer solution. Yet the anticipation of future
ecological goals other than cork production prompted the development
of an integer formulation that might better address new strategic man-
agement concerns. The integer requirements generally preclude the
use of linear programming packages to solve the generated problems,
thus a heuristic strategy is frequently used, generally providing near
optimal results [15].
The simulated annealing meta-heuristic has been used extensively
to solve integer formulations (e.g. [4, 16, 24, 28, 42]). Its basic mech-
anism can be described as follows:
1. An initial solution is generated randomly. That is, a random pre-
scription is assigned to each land unit and the solution is evalu-
ated (Z
1
);
2. A modification of the previous solution is proposed (by changing
randomly the prescription assigned to a randomly selected land
unit) and this solution is evaluated (Z
2
);
3. If Z
2
is larger than Z
1
, the proposed modification is accepted, and
the procedure jumps to step 5;
4. If Z
2
is lower than Z
1
, the proposed modification will be accepted if a
randomly generated value (within a 0.1 bound) is lower than
exp((z
1
– z
2
)/temp), where temp is a control parameter. If it is not
accepted then jump to step 6, else continue to step 5;
5. Change the current solution with the proposed modification and
make Z
1
= Z
2
;
6. After a fixed number of iterations, lower the temp parameter by a
given factor (cooling schedule);
7. If the number of iterations has not reached the maximum go to
step 2, else end and report the final solution.
Thus, the probability of accepting inferior solutions increases with
temperature (temp) and decreases with magnitude of the inferior move.
Pham and Karaboga [36] report that factors that lead to successful
algorithm implementation are choices regarding the solution data
structure, the fitness evaluation function and the cooling schedule. In
general, the latter involves a careful choice of the initial temperature
(temp), of the cooling schedule and of the maximum number of iter-
ations. Another issue when using meta-heuristics is the incorporation
of constraints in the evaluation function. This is usually accomplished
through the use of penalty functions that penalise the objective value
the further the solution is from the required constraints.
The implementation of simulated annealing for this type of prob-
lems has used a default set of parameters (temperature and cooling
schedule) that usually provide good results for a large spectrum of sit-
uations. The evaluation function encompassed the net present value
and a penalty function (Eq. (6)):
(6)
where λ
c
represents a penalty function dependent of the demand levels
and deviation values for each constraint c in the set of equations (3)
and (4). Previous efforts [15] showed that a parabolic function, with
parameters derived from the problem and the constraint values, pro-
vided a reliable and flexible approach to this problem, so this method
is used uniformly in the simulated annealing implementation.
3. RESULTS
The proposed architecture for a prescription simulator and
its integration within an EMDSS were used successfully to
address the test problem. The prescription simulator considered
all three debarking models. In the case of the first model, the
minimum and the maximum number of years of a land unit
debarking cycle were set to 9 and 11 years, respectively. The
Max NPV
i 1=
N
∑
c
ij
j 1=
M
i
∑
x
ij
=
j 1=
M
i
∑
x
ij
1, =
i 1=
N
∑
v
ijpt
j 1=
M
i
∑
x
ij
1 d
pt
–()V
pt
, p 1,2, , Pt∧ 1, 2, , = T=≥
i 1=
N
∑
v
ijpt
j 1=
M
i
∑
x
ij
1 d
pt
+()V
pt
, p 1,2, , Pt∧ 1, 2, , = T=≤
x
ij
1 x
ij
0, i, j∀ 1, , Mi=∀=∨=
i 1=
N
∑
c
ij
j 1=
M
i
∑
x
ij
c
∑
λ
c
d
c
, V
c
()–
756 A.O. Falcão, J.G. Borges
second model considered a minimum tree debarking cycle of
9 years, a debarking period ranging from 2 to 9 years and three
levels of periodic land unit cork yield intensities. The third
model considered tree debarking cycles ranging from 9 to
11 years. The minimum number of years between harvest
entries was set to 9 years. Only one land unit density target level
was considered. The prescription simulator interpreted effi-
ciently the ecosystem data from each of the 860 cork oak land
units in the MIS and used effectively the three debarking mod-
els and the thinning model to generate 209 840 prescriptions
over a thirty 1-year periods planning horizon. Users may use
the system to simulate prescriptions over longer planning horizons.
Yet for current testing purposes it was not necessary to do so. The
proposed system generated an average of about 244 decision var-
iables for each land unit. Adequate management flexibility may
be achieved by considering a lower number of options for each
land unit. Thus extending the planning horizon will not impact
the effectiveness of this decision support tool.
The interpretation of inventory data demonstrated the effec-
tiveness of the linkage between the MIS and the prescription
simulator. It further showed that most land units were occupied
by fairly young cork oaks. Current cork production in Serra de
Grândola is below potential production levels in the area.
Unconstrained financial optimization and several LP model
solutions were used to estimate potential production levels over
the 30-year planning horizon. Based on this information, the
decision model (Eq. (1) to (5)) to address the NGOs require-
ments and to test the linkage between the prescription simulator
and the management models assumed a yearly production tar-
get of 3 600 t of cork in the first five 1-year periods. This value
was gradually increased over an 8-year period to a maximum
of 6 000 t of cork per year. Deviations from these target levels
of up to 5% were allowed.
The results of the prescription simulation and the manage-
ment model parameters were organized into the three data
structures – MAS, PRODS and CONS –, to generate the man-
agement model matrix. The latter was used as input by both a
linear programming solver (CPLEX 8.1.) and the simulated
annealing algorithm thus demonstrating the effectiveness of the
linkage between the prescription simulator and the manage-
ment models.
In order to provide useful information to the NGOs, the sys-
tem was further used to assess the opportunity costs associated
with the cork even-flow constraints. This information helped
evaluate tradeoffs between strategic objectives of cork produc-
tion in Serra de Grândola and financial objectives for each land
unit. The comparison between the unconstrained net present
value optimization solution and the solutions of the linear pro-
gramming and the simulated annealing algorithms provided
that information. The former net present value was 3.484 ×
10
8
EUR. The LP optimal solution was 2.774 × 10
8
EUR, while
the simulated annealing solution was 5.3% below this value
(2.628 × 10
6
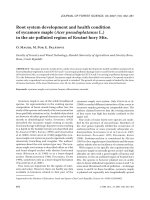
EUR). The last two approaches provided an esti-
mate of strategic sustainable cork flows over the 30-year plan-
ning horizon (Fig. 2). Cork even-flow constraints further
impact the selection of debarking models. Unconstrained net
present value optimization selected models A and C for about
Figure 2. Cork flows associated with the unconstrained net present value maximization and the simulated annealing solutions.
Mediterranean forest decision support system 757
97% of land units while simulated annealing selected Model B
for most land units (Tab. II). Further comparison between the
LP and the simulated annealing solutions provided a first esti-
mate of opportunity costs of other strategic ecological objec-
tives that may require integer solutions. These costs reached
about 784 EUR per ha as a consequence of prescription value
variability in each land unit. Several land units show differ-
ences above 1 100% between the maximum and minimum
NPV and over 82% of land units have differences greater then
300% between prescription values.
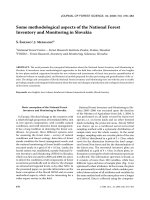
A GIS visualization tool may be used to analyze landscape
wide impacts of the treatment schedule (Fig. 3). For example,
the unconstrained financial optimum scenario concentrates
treatments and it proposes that over 90 percent of the total area
is debarked in 2018 and 2033 (Fig. 3). Conversely, the regular
flow constraints scenario proposes a more even distribution of
debarking over the planning horizon. Moreover, it proposes
that only about 30% of the total area is debarked. It is also inter-
esting to analyze the type of prescriptions selected in each sce-
nario. The regular flow constraints scenario selected mostly
management option B to address sustainability concerns (Fig. 4).
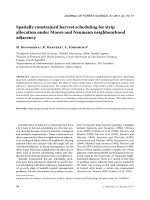
The unconstrained financial optimum scenario assigned to each
land unit the most lucrative method, which was, for the more
productive area (the south-eastern plateau), management option C.
Northern and western areas in Serra de Grândola area charac-
terized by higher altitudes, steeper slopes and lower productivity.
In these areas, the unconstrained financial optimum criterion
assigned to most land units management option A to enforce a
regular and simultaneous debarking periodicity for all trees,
thus minimizing the costs (Fig. 4).
Table II. Debarking models selected by the unconstrained net pre-
sent value maximization (UNPVM) and the simulated annealing
(SA) solutions.
Solution method Debarking model No. land units (%)
UNPVM A 426 49.53
B252.91
C 409 47.56
SA A 199 23.14
B 524 60.93
C 137 15.93
Figure 3. Maps of Serra de Grândola present-
ing the unconstrained net present value maxi-
mization (top) and the simulated annealing
(bottom) solutions in 2018 (left) and 2033
(right). Dark gray - debarking; Light gray -
debarking and thinning; White - do nothing.
758 A.O. Falcão, J.G. Borges
4. DISCUSSION
Database interaction, linkage to growth and yield models,
interactive silviculture modeling, GIS integration and linkage
to management models are key aspects of the architecture for
a prescription simulator. All have been discussed in the frame-
work of the development of an effective and efficient simulator
that might interface with other components of an EMDSS. A
cork oak management problem was used to test the system
functionality. The problem was defined according to end users
(a local development organization and a forest landowners
association) objectives. Results showed that the proposed pre-
scription simulator architecture did successfully address end
users objectives.
The current implementation is an extensible system because
it allows for the updating and the insertion of timber growth and
wildlife models. Currently, the system includes models for the
most common forest species in Portugal (Pinus pinaster, Euca-
lyptus globulus, and Quercus suber) plus a general model for
other less important species. New growth and yield models for
other species (e.g. Pinus pinea, Pinus nigra or Quercus ilex)
may be integrated in the system thus extending the usability of
the system to support other Mediterranean forest ecosystems.
Further, the system does not incur in excessive computational
costs.
The solution of the test problem demonstrated that the sys-
tem acted effectively as an interface between the models, the
(geo-referenced) database thus simulating adequate cork oak
prescriptions for each land unit. It further demonstrated the
effectiveness of the simulator data structures that provide the
linkage to management models. They facilitate model building
to address several forest ecosystem management problems. It
was also shown that the prescription simulator is fully inte-
grated with a geographical information system thus producing
data needed by state-of-the-art ecosystem management heuris-
tics. The user friendliness of the interface, namely its visuali-
zation capabilities, connection to popular tools (e.g., Microsoft
Excel, ESRI ArcView), and its overall architecture define a
powerful and easy to use tool.
The current system still does not allow conversions between
cover types, yet a new prototype is being developed that aims
at overcoming this shortcoming. Research work will also focus
on integrating other production and conservation functions and
on enhanced interfacing with other multiple criteria ecosystem
management models. Finally, further research is needed to
include fire risk considerations and models within the EMDSS.
Acknowledgments: Partial support for this research was provided by
Fundação para a Ciência e a Tecnologia (Project SFRH/BPD/7135/
2001 and Project Sapiens 36332/AGR/2000, with the title “Forest eco-
system management: an integrated stand-to-landscape approach to
biodiversity and to ecological economic and social sustainability”,
funded by FCT, POCTI, and FEDER), by Instituto Nacional de Inves-
tigação Agrária (Project PAMAF with the title “Prospective studies
of the productive potential of cork oak stands in Serra de Grândola and
of Pinus pinea stands in Vale do Sado”), by Project Life with the title
“MONTADO - Conservation and Valuation of Montado Forestry Sys-
tems for Fighting Desertification” and by Project Suberwood with the
title “Strategy and technology development for a sustainable wood and
Figure 4. Maps of Serra de Grândola presenting the debarking models selected by the unconstrained net present value maximization (left) and
the simulated annealing (right) solutions. Black - Model A; Dark gray - Model B; Light gray - Model C.
Mediterranean forest decision support system 759
cork forestry chain” presented in the framework of the European
Union Programme “Quality of Life and Management of Living
Resources”.
REFERENCES
[1] Borges J.G., Sistemas de apoio à decisão para o planeamento em
recursos naturais e ambiente, Aplicações florestais, Revista Flores-
tal IX (1996) 37–44.
[2] Borges J.G., Oliveira A.C., Costa M.A., A quantitative approach to
cork oak forest management, For. Ecol. Manage. 97 (1997) 223–229.
[3] Borges J.G., Hoganson H.M., Assessing the impact of management
unit design and adjacency constraints on forest wide spatial condi-
tions and timber revenues, Can. J. For. Res. 29 (1999) 1764–1774.
[4] Boston K., Bettinger P., An analysis of Monte Carlo integer pro-
gramming, simulated annealing, and tabu search heuristics for sol-
ving spatial harvest scheduling problems, For. Sci. 45 (1999) 292–
301.
[5] Camenson D., Sleavin K., Greer K., Spectrum: an analytical tool
for building natural resources management models. In: Proceedings
of Large Scale Forestry Scenario Models, in: Experiences and
Requirements, 15–22 June 1995, Joensuu, Finland.
[6] Chappell D., Understanding ActiveX and OLE, a guide for develo-
pers and managers, Microsoft Press, Redmond, Washington, 1996.
[7] Collazo A.M., Ordenacion de montes arbolados, ICONA, Ministe-
rio de Agricultura, Pesca y Alimentacion, Madrid, 1994.
[8] Covington W.W., Wood D.B., Young D.L., Dykstra D.P., Garret
L.D., TEAMS: A decision support system for multiresource mana-
gement, J. For. 86 (1988) 25–33.
[9] Date C.J., An introduction to database systems, Addison and Wes-
ley, Reading, Massachusetts, 1994.
[10] Davis L.S., Johnson K.N., Howard T., Bettinger P., Forest manage-
ment, McGraw Hill Publishing Company, New York, 2001.
[11] DGF (Direcção Geral das Florestas), Inventário Florestal Nacional
(1995–1998), Relatório final, Direcção de Serviços de Planeamento
e Estatística, 2001.
[12] Falcão A., DUNAS – A growth model for the National Forest of
Leiria, in: Amaro A. (Ed.), Proceedings of the IUFRO Workshop
Empirical and Process in Based Models for Forest Tree and Stand
Growth Simulation, Actas Conf. IUFRO, Lisboa, 21–27 Setembro
1997.
[13] Falcão A., Implementação de métodos heurísticos para modelação
da gestão em ecossistemas florestais – Integração num Sistema de
Apoio à Decisão, Ph.D. thesis, Instituto Superior de Agronomia,
Lisboa, 2001.
[14] Falcão A., Simulação e projecção de alternativas de gestão para o
montado de sobro, Documento Técnico 04/02, Grupo de Economia
e Gestão de Recursos Naturais, Departamento de Engenharia Flo-
restal, Instituto Superior de Agronomia, Lisboa, 2002.
[15] Falcão A., Borges J.G., Designing an evolution program for solving
integer forest management scheduling models: an application in
Portugal, For. Sci. 47 (2001) 158–168.
[16] Falcão A., Borges J.G., Combining random and systematic search
heuristic procedures for solving spatially constrained forest mana-
gement scheduling models, For. Sci. 48 (2002) 608–621.
[17] Falcão A., Borges J.G., Tomé M., SAGfLOR – An automated forest
management prescription writer, in: Pukkala T., Eerikainen K.
(Eds.), Modelling the Growth of Tree Plantations and Agroforestry
Systems in South and East Africa, University of Joensuu, Faculty
of Forestry Research Notes 97 (1999) 211–218.
[18] Falcão A.A., Marques A., Metodologia expedita para simulação do
crescimento e produção de algumas espécies florestais portuguesas,
Documento Técnico 01/02, Grupo de Economia e Gestão de Recur-
sos Naturais, Departamento de Engenharia Florestal, Instituto
Superior de Agronomia, Lisboa, 2002.
[19] Gadow K., Information: a key resource in plantation forestry, Sud-
Afrikaanse Tydskrift vir Wetenskap 85 (1989) 435–440.
[20] Hoen H.F., Solberg B., Forestry scenario modeling for economic
analysis – experiences using the GAYA-JLP model, in: Päivinen
R., Roihuvuo L., Siitonen M. (Eds.), Large Scale Forestry Scenario
Models: experiences and requirements, EFI Proceedings 5 (1996)
79–88.
[21] ILOG, Inc. CPLEX 8.0 - Users manual, Mountain View, CA, July
2002.
[22] Johnson K.N., Scheurman H.L., Techniques for prescribing opti-
mal timber harvest and investment under different objectives – dis-
cussion and synthesis, For. Sci. Monogr. 18 (1977).
[23] Johnson N.N.T., Stuart W., Crim S.A., FORPLAN Version 2: an
Overview, USDA Forest Service, Land Management Planning Sys-
tems Section, 1986.
[24] Lockwood C., Moore T., Harvest scheduling with spatial cons-
traints: a simulated annealing approach, Can. J. For. Res. 23 (1993)
468–478.
[25] Manley B., Application of the IFS/FOLPI Forest Estate Modeling
System to Large -scale Forestry Scenario Modeling in New Zea-
land, in: Paivinen R., Roihuvuo L., Siitonen M. (Eds.), Large Scale
Forestry Scenario Models: Experiences and Requirements, EFI
Proceedings 5 (1996) 295–305.
[26] Medail F., Quézel P., Hot spots analysis for conservation of plant
biodiversity in the Mediterranean basin, Ann. Missouri Bot. Garden
84 (1997) 112–127.
[27] Miragaia C., Borges J.G., Falcão A., Tomé M., inFlor, a Manage-
ment Information System in Forest resources, in: Pukkala T.,
Eerikainen K. (Eds.), Modelling the Growth of Tree Plantations and
Agroforestry Systems in South and East Africa, University of Joen-
suu, Faculty of Forestry Research Notes 80 (1998) 131–142.
[28] Murray A., Church R., Heuristic solution approaches to operational
forest planning problems, [OR Oper. Res.] Spektrum 17 (1995)
193–200.
[29] Nabuurs G.J., Paivinen R., Large scale forestry scenario model – a
compilation and review, EFI Working paper 10, Eur. For. Inst.
Finland, Joensuu, 1996.
[30] Oliveira A., Tabela de Produção Geral para o Pinheiro Bravo das
Regiões Montanas e Sub-Montanas, Direcção Geral das Florestas,
Centro de Estudos Florestais, INIC, Lisboa, 1985.
[31] Palahí M., Modelling stand development and optimising the mana-
gement of even-aged Scots pine forests in north-east Spain, Acade-
mic Dissertation, Research note 143, Faculty of Forestry, Univer-
sity of Joensuu, 2002.
[32] Palahí M., Pukkala T., Optimising the management of Scots pine
(Pinus sylvestris L.) stands in Spain based on individual-tree
models, Ann. For. Sci. 60 (2003) 105–114.
[33] Palahi M., Pukkala T., Pascual L., Trasobares A., Examining alter-
native landscape metrics in ecological forest landscape planning: a
case for capercaillie in Catalonia, Investigaciones Agrarias, Sist.
Recur. For. 13 (2004) 527–538.
[34] Pelkki M., Development of an automated stand natural resources
simulator for timber harvest scheduling, M.Sc. thesis University of
Minnesota, 1988.
[35] Pereira J.S., David J.S., David T.S., Caldeira M.C., Chaves M.M.,
Carbon and water fluxes in Mediterranean-type ecosystems –
Constraints and adaptations, Prog. Bot. 65 (2004) 467–498.
[36] Pham D.T., Karaboga D., Intelligent optimisation techniques,
Genetic, algorithms, tabu search, simulated annealing and neural
networks, Springer-Verlag, London, 2000, 302 p.
760 A.O. Falcão, J.G. Borges
[37] Ribeiro R.P., Borges J.G., Oliveira V., A framework for data qua-
lity for Mediterranean sustainable ecosystem management, Ann.
For. Sci. 61 (2004) 557–568.
[38] Rose D., McDill M., Hoganson H., Development of an environ-
mental impact statement of statewide forestry programs: A Minne-
sota case study, The Compiler 10 (1992) 18–27.
[39] Rose D.W., DTREES, Version 4.2., A decision tree system for
developing harvest schedules from user defined silvicultural guide-
lines, User’s manual, Staff Paper No. 92, Department of Forest
Resources, University of Minnesota, 1994.
[40] Scarascia-Mugnozza G., Oswald H., Piussi P., Radoglou K.,
Forests of Mediterranean region: gaps in knowledge and research
needs, For. Ecol. Manage. 132 (2000) 97–109.
[41] Siitonen M., The MELA system as a forestry modeling framework,
Lesnictví Forestry 41 (1995) 173–178.
[42] Tarp P., Helles F., Spatial optimization by simulated annealing and
linear programming, Scand. J. For. Res. 12 (1997) 390–402.
[43] Tomé M., Falcão A., Amaro A., GLOBULUS v1.0.0: a regionali-
zed growth simulator for eucalypt plantations in Portugal, in:
Ortega A., Gezan S. (Eds.), Modelling Growth of Fast-Grown Tree
Species, Proceedings, IUFRO Conference, Valdivia, Chile, 1998,
138–145.
[44] Tomé M., Coelho M.B., Pereira H., Lopes F., A management orien-
ted growth and yield model for cork oak stands in Portugal, in:
Amaro A., Tomé M. (Eds.), Proceedings of the IUFRO Workshop
Empirical and Process Based Models for Forest Tree and Stand
Growth Simulation, Oeiras, Portugal, 1999, pp. 271–289.
[45] Torres Rojo J.M., Decision Support System for Forest Resources
Management in Central Mexico, in: Proceedings of the 1994 Sym-
posium on Systems Analysis in Forest Resources, September 6–9,
1994, Pacific Grove California, pp. 283–291.
[46] Trasobares A., Pukkala T., Optimising the management of uneven-
aged Pinus sylvestris L. and Pinus nigra Arn. mixed stands in Cata-
lonia, north-east Spain, Ann. For. Sci. 61 (2004) 747–758.
[47] Turban E., Aronson J., Decision support systems and intelligent
systems, 7th Ed., Prentice-Hall, Inc., 2004, 890 p.
[48] Varma V.K., Ferguson I., Wild I., Decision support system for the
sustainable forest management, For. Ecol. Manage. 128 (2000) 49–55.
To access this journal online:
www.edpsciences.org