Báo cáo lâm nghiệp: "Assessing the nutritional and climatic response of temperate tree species in the Vosges Mountains" doc
Bạn đang xem bản rút gọn của tài liệu. Xem và tải ngay bản đầy đủ của tài liệu tại đây (299.58 KB, 10 trang )
761
Ann. For. Sci. 62 (2005) 761–770
© INRA, EDP Sciences, 2005
DOI: 10.1051/forest:2005068
Original article
Assessing the nutritional and climatic response
of temperate tree species in the Vosges Mountains
Paulina E. PINTO
a,b
*, Jean-Claude GÉGOUT
a
a
Laboratoire d’Étude des Ressources Forêt-Bois, ENGREF, 14 rue Girardet CS 4216, 54042 Nancy Cedex, France
b
Departamento de Ciencias Forestales, Facultad de Agronomía e Ingeniería Forestal, Pontificia Universidad Católica de Chile,
Casilla 306, Correo 22, Santiago, Chile
(Received 21 February 2005; accepted 16 June 2005)
Abstract – Tree species distribution according to climatic gradients is often analysed through geographic information systems modelling
whereas their nutrient requirements is mainly studied by experimentation. Using 325 forest plots, this study analysed the response of frequent
tree species in the Vosges mountains, a siliceous area in northeast France, along both climate and nutrient gradients. Besides a better
understanding of species behaviour, our aim was to investigate if indicator plants can be used to accurately estimate species response to
ecological factors. Results showed a main effect of climate on Abies alba and Quercus petraea with a transition between both species around
–20 mm of June water balance. They also showed a combined effect of climate, base saturation and nitrogen nutrition on Acer pseudoplatanus,
Carpinus betulus, Fraxinus excelsior and Pinus sylvestris distribution. Nutritional and climatic variables estimated by Ellenberg indicator
values or those established with the phytoecological database EcoPlant are almost as efficient as measured variables to assess tree species
ecological response.
natural forest / nutrient availability / climate / generalized linear models / ecological niche
Résumé – Effet du climat et de la nutrition minérale sur la distribution des essences dans le massif vosgien. Le lien entre la distribution
des essences forestières et les gradients climatiques est souvent analysé à partir de traitements sous système d’information géographique alors
que leurs exigences nutritionnelles sont principalement déterminées par expérimentation. À partir de 325 relevés phytoécologiques forestiers,
nous analysons dans ce travail la distribution de huit essences fréquentes dans le massif vosgien en prenant en compte simultanément les
conditions nutritionnelles et climatiques des sites. En plus d’une meilleure connaissance de l’écologie des essences étudiées, notre objectif est
de déterminer si la flore forestière peut être utilisée comme bioindicateur des conditions du milieu pour définir le comportement écologique des
essences. Les résultats montrent un fort effet du climat sur Abies alba et Quercus petraea avec une transition entre les deux espèces autour de
–20 mm de bilan hydrique climatique en juin. Il existe également un effet combiné du climat, du taux de saturation et de la nutrition azotée sur
la distribution de Acer pseudoplatanus, Carpinus betulus, Fraxinus excelsior et Pinus sylvestris. Les variables climatiques et nutritionnelles
estimées par les valeurs indicatrices d’Ellenberg ou celles calculées à l’aide de la base de données phytoécologiques EcoPlant sont presque aussi
efficaces que les variables mesurées pour définir la réponse des essences aux facteurs écologiques.
forêt naturelle / nutrition minérale / climat / modèles linéaires généralisés / niche écologique
1. INTRODUCTION
A knowledge of the ecological conditions under which the
different tree species occur is an essential pre-requisite for for-
est management, particularly for the choice of tree species
adapted to natural site conditions. In a long-term context, an
accurate approach is required in order to ensure that environ-
mental modifications should be taken into account in silvicul-
tural decision-making processes.
Austin et al. [6] pioneered the analytical approach to predict
species distribution in relation to a number of environmental
factors. Since then, numerous studies have been conducted on
species-environment relationships around the world. Guisan and
Zimmermann [35] provide an extensive review of those devel-
opments which have concerned plant species. Some authors
have focused on tree species distribution in relation to ecolog-
ical variables to elaborate conservation priorities for Australia’s
Eucalyptus spp. [5]. In addition, frequent evaluations of the
effect of climatic change on forest stands have been undertaken,
for example: in New Zealand’s Nothofagus spp. forests [43],
in Canadian boreal forest [45], or in the United States [38, 49].
The studies on global change effects in European temperate for-
ests identify the distribution and behaviour of tree species in
relation to climatic variables in the Swiss Alps [11].
* Corresponding author:
Article published by EDP Sciences and available at or />762 P.E. Pinto, J C. Gégout
Nutritional behaviour of European tree species has often
been studied using bioindication by plant species. The value of
an environmental factor at a site is estimated from Ellenberg
species’ indicator values [26], or using principal environmental
axes from ordination methods [18, 42]. This approach, used in
northern Europe, is not as accurate as direct field measurement
variables, but has the advantage that soil nutritional variables
can be obtained easily and at low cost by plant species bioin-
dication.
Several approaches were also used in Europe by ecologists
to describe tree species behaviour according to soil character-
istics [21, 22, 25, 47], or to both soil and climatic gradient [26,
41, 58, 59]. These authors provide empirical value of tree spe-
cies optima [26, 41] or a graphical display of their tolerance [58,
59] according to synthetic gradients of climate, soil moisture
or nutrition.
Despite these various studies, the distribution of European
tree species according to both climatic and soil resource meas-
ured variables has not been studied using an analytical
approach. Furthermore, little is known from formalised meth-
ods about the ecological behaviour of some tree species (e.g.
Carpinus betulus L.), or some areas (west and southwest
Europe). A precise knowledge of tree species distribution
according to measured variables is important when making an
evaluation of species’ ecological realized niche, to constitute
a guiding framework for silvicultural practices or anticipate
tree reaction to global change. Finally, niche evaluation uses
either direct variables or estimated variables by bioindication,
but there is little information about the relative efficiency of
these two approaches.
The Vosges Mountains forests (northeast France) represent
an important part of French temperate forest resources, with
forest stands characterised by a mixture of coniferous and
deciduous tree species, the most frequent being: silver fir (Abies
alba L.), European beech (Fagus sylvatica L.), sessile oak
(Quercus petraea Liebl.), Norway spruce (Picea abies (L.)
Karst.), Scots pine (Pinus sylvestris L.), sycamore (Acer pseu-
doplatanus L.), ash (Fraxinus excelsior L.) and hornbeam
(Carpinus betulus L.). Forests of this area are particularly char-
acteristic of the transition between colline deciduous sessile
oak-European beech stands and montane mixed silver fir-Euro-
pean beech stands, which to date has not been studied. With
both nutritional and altitudinal gradients, this natural area pro-
vides the species and environmental diversity useful for stud-
ying ecological behaviour of tree species and communities.
The purpose of this paper is to: (1) identify the chemical (soil
conditions) and physical (climatic) variables that most strongly
influence tree species composition in the forests of the Vosges
Mountains; (2) estimate the response of tree species according
to the main environmental factors; (3) compare the efficiency
of plant bioindication and measured variables to explain stand
composition, with the objective of making an easy assessment
of environmental conditions.
2. MATERIALS AND METHODS
2.1. Study area and data sources
The study area is limited to the crystalline Vosges Mountains, in
northeastern France, located between 47° 33’ to 48° 47’ latitude and
5° 50’ to 7° 28’ longitude. The delimitation, based on the geological
substrates, allowed us to establish a continuous study area with homo-
geneous geology and geomorphology. This natural region of 6 800 km
2
comprises a wide altitude range (400 to 1400 m) and a significant var-
iability in soil nutrient status (3 < pH-H
2
0 of A-horizon of soil < 7)
[29]. 325 plots located within this study area were extracted from Eco-
Plant, a forest sites database with complete floristic relevé and both
climatic and measured soil nutritional variables available on each plot
[32]. All these plots were sampled in mature natural forest stands of
native species mainly composed of silver fir, European beech, sessile
oak, Norway spruce, Scots pine and sycamore. For each sample plot,
the presence of all vascular species and terricolous bryophytes was
recorded over a surface area of 400 m
2
. Two categories of species were
distinguished in each plot: (i) tree species, divided into overstory (tree
species taller than 7 m) and understory (tree species smaller than 7 m,
excluding tree seedling) layers; (ii) shrubs, herbaceous species, and
bryophytes.
2.2. Measured ecological variables
Soil nutrient resources were evaluated in the field through humus
form description, a ground variable highly correlated with the soil
nutrient regime [12, 23, 39]. Humus forms were grouped in five cat-
egories (dysmoder and eumoder, hemimoder and dysmull, oligomull,
mesomull, eumull) [13]. In each plot, one soil sample was collected
in the A-horizon for laboratory analyses. Soil samples were air-dried
and sieved at 2 mm. Exchangeable Ca, K, Mg and Al, were extracted
with 0.5 M NH
4
Cl at soil pH and measured by spectrometry. Protons
were measured by titration. Base Saturation (BS) was defined as
(Ca
++
+ Mg
++
+ K
+
)/(Ca
++
+ Mg
++
+ K
+
+ Al
+++
+ H
+
) ratio. pH-H
2
0
was measured, after 1:2.5 dilution of fine earth, with pH-electrodes.
Total nitrogen and organic carbon were measured using the Kjeldahl
and Anne methods.
Climatic variables came from AURELHY, a 1 km gridded tem-
perature and precipitation model which extends over France and takes
into account the effect of altitude [9]. Data consists of 1961–1990
monthly mean precipitation (P) and monthly minimum, maximum and
mean temperature (respectively: Tmin, Tmax, T). These variables
allowed us to calculate climatic variables used successfully to explain
plant species distribution such as monthly Thornthwaite potential eva-
potranspiration (PET) [67], monthly climatic water balance (e.g.
WB
June
= P
June
– PET
June
) and De Martonne monthly aridity index
(e.g. AI
June
= P
June
/(T
June
+ 10)) [17]. This index, low when the aridity
is high, has been used to explain tree species distribution [51, 61].
2.3. Predicted variables
The environmental variables were also estimated for each plot
using plant species indicator values (IV). Ellenberg’s indicator values
were used to estimate three soil factors: moisture (F), reaction (R) and
soil nitrogen availability (N) [26]. These values were assigned empir-
ically on the basis of observations and measurements, and express the
relative response of plant species in their natural environment as com-
pared to other species. They have been successfully used in Northern
Europe, Great Britain, Germany, Eastern Europe and the Mediterra-
nean region to estimate environmental variables using vegetation (see
[19]).
A formalized method to assess species IV was proposed by Ter
Braak and Looman [65]. Under the hypothesis of an unimodal
response of species to environmental variables, the presence proba-
bility curve of a species along any variable is modelled using logistic
regression and the indicator value is defined as the value of the variable
that maximises the presence probability of the species [64, 65]. Using
this method the indicator values of the 700 most frequent plant species
in French forests have been established for three nutritional and three
Ecological response of tree species in the Vosges Mountains 763
climatic variables [31]. Four thousands plots from EcoPlant, with
complete plant species inventory, measured soil variables and mod-
elled climatic variables were used to assess response curves and indi-
cator values of these plant species according to: pH as an acidity var-
iable (IV
pH
), C:N ratio as a nitrogen availability variable (IV
C:N
), base
saturation as a mineral nutrition/toxicity variable (IV
BS
), mean annual
temperature as a variable linked to growth, mean January temperature
as a variable of winter conditions and the De Martonne annual index
of aridity (IV
AI
).
For the two sets of indicator values, estimation of variables using
plant species was based on the classical IVs approach, that consists in
calculating mean IVs of the species present in the plot [26]. Only shrub,
herbaceous species and bryophytes were considered. Forest tree spe-
cies were excluded in order to ensure the independence of the response
variable and the explanatory variables.
2.4. Multivariate analyses of vegetal communities
Two correspondence analyses (CA) were used to identify soil
resources and climatic variables that have the greatest influence on tree
species and other plant species communities respectively. CA were run
on presence/absence species-by-plots tables with species present in
more than 1% of the plots. The CA of tree species (CA
T
) was run with
16 different tree species divided into two layers: overstory and under-
story tree species. The analysed data matrix, T, was constituted with
325 rows (plots) and 30 columns. The CA of shrubs, herbaceous spe-
cies and bryophytes (CA
SHB
) was run with the same 325 plots and
110 species in one layer. CA showed no arch effects that justify not
using detrended correspondence analysis [66, 70].
Based on the hypothesis that environmental factors control the dis-
tribution of species and communities, the ecological interpretation of
CA ordination axes was assessed by (multiple) linear regressions
between plot scores and plot nutritional and climatic variables [57, 66].
Four canonical correspondence analyses (CCA) [63] were used
as a direct means of explaining stand composition, according to soil
nutrient availability and climatic variables. For each CCA, the data
analysed were present in two tables: (i) the presence/absence tree spe-
cies-by-plots table, T, with n rows (n = 325) and p columns (p = 30);
(ii) the ecological table, E, with n rows and q columns: the ith row in
E as well as in T correspond to the same plot, each column in E cor-
respond to an ecological measured or estimated variable. In order to
compare the efficiency of measured variables and plant indicator var-
iables, CCA was performed on four pair of tables T (unchanged) and
E, where four different series of environmental variables were
selected: E
1,
measured variables: BS, C:N ratio and WB
June
; E
2
, plot
scores on CA
SHB
for axis 1 and axis 2; E
3
, EcoPlant indicator values
estimations: IV
C:N
, IV
BS
, IV
AI
; E
4
, Ellenberg indicator values esti-
mations: R, F and N.
As shown by Lebreton et al. [44] and Gégout and Houllier [30],
the following ratio can be used as a means of assessing the relative
efficiency of CCA versus CA:
(1)
where, λ is the eigenvalue associated to the kth ordination axis of CCA
or CA and e
m
can be considered as the empirical index that measures
the efficiency of the ecological variables used in E for predicting the
composition of the vegetation. The closer the eigenvalues of the m first
axes of CCA are to the m first axes of CA, the greater the efficiency
of environmental variables and the closer e
m
is to 1. The efficiency of
the different sets of environmental variables to explain tree composi-
tion of plots was achieved by means of this e
m
ratio.
2.5. Modelling of tree species behaviour
The ecological response of the eight most frequent tree species was
derived from multiple logistic regression models [65]. Logistic regres-
sion is a generalized linear modelling approach [48], with a logit link
function and binomial error distribution, and is one of the most popular
models for characterizing species presence/absence as a function of
environment [4, 35]. The goal of logistic regressions was to define the
environmental response of the most frequent tree species in the Vosges
natural forest, according to the key environmental predictors explain-
ing stand composition and tree species distribution. The probability
of occurrence of each tree species was determined using the 4 sets of
ecological variables used in the CCA, either measured directly or esti-
mated by plant species. For all variables of each set (E
1
, E
2
, E
3
, E
4
),
we tested the significance (at the 0.05 level) of the Gaussian logit
model (bell-shaped unimodal response curve) against the linear logit
model (increasing or decreasing sigmoidal response curve), or against
the null model (no reaction and flat response curve). A residual devi-
ance test, based on the Akaike Information Criterion (AIC) [1], was
then achieved for all the significant models including one or several
variables simultaneously. The selected model, for each of the 4 sets
of variables, was the one that minimized AIC. All computations were
performed with S-PLUS 2000 statistical package [46].
Based on the resulting logistic regression equations we then could
model the response surface for each tree species. This shape is a first
approximation to define the environmental behaviour of tree species
according to both nutritional and climatic factors.
3. RESULTS
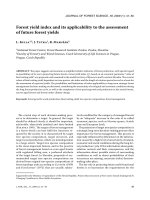
3.1. CA of tree species and gradient interpretations
The first two axes of tree species CA have a significant eco-
logical meaning. A strong correlation was observed between
the first axis and nutritional variables, either base saturation or
C:N ratio (Tab. I). The multiple regression model including
both variables demonstrated that this major gradient is a min-
eral and nitrogen resources gradient (R
2
= 0.50; p < 0.0001 or
R
2
= 0.61; p < 0.0001 with integration of humus forms), ranging
from oligotrophic forests with low BS values and a high C:N
ratio to forests with good nutrient availability, high BS and a
low C:N ratio. According to this gradient, coniferous species,
especially Pinus sylvestris, are present on the oligotrophic soils,
as opposed to Acer spp., Fraxinus excelsior and more generally
broadleaved species that occur on rich soils (Fig. 1).
Axis 2 is correlated with summer water availability mainly
represented by water balance of June (r
= 0.66; p < 0.0001) and
aridity index of June (r
= 0.64; p < 0.0001). Its link with tem-
perature variables or elevation is less important (Tab. I). Axis
2 covers a vegetation moisture gradient ranging from low water
availability and elevation with Quercus petraea, Carpinus bet-
ulus and Castanea sativa to humid forest stands with Acer spp.
and Picea abies (Fig. 1).
3.2. CA of other plant species communities
and ecological interpretation
Although not presented in detail, the CA concerning shrubs,
herbaceous species and bryophytes (CA
SHB
) also showed two
axes with a clear ecological meaning. Species known to occur
on oligotrophic soils, like Vaccinium myrtillus, Deschampsia
e
m
λ
CCA,k
k 1=
m
∑
=
/
λ
CA,k
k 1=
m
∑
1≤
764 P.E. Pinto, J C. Gégout
flexuosa, Calluna vulgaris or the bryophytes Bazzania trilo-
bata and Leucobryum glaucum, had low scores on the first CA
axis. In contrast, nutrient-demanding species, like Geum urba-
num, Primula elatior, Mercurialis perennis or Euphorbia amy-
gdaloides had positive scores on this axis. Multiple regression
analyses between environmental variables and plot scores
(Tab. I) revealed that the first gradient was greatly determined
by base saturation and C:N ratio (R
2
= 0.67; p < 0.0001) with
humus form offering complementary information (R
2
= 0.70;
p < 0.0001 for the model with BS, C:N ratio and humus forms).
As for tree species’ CA, the second axis of CA
SHB
was cor-
related to climatic factors (Tab. I). It showed a gradient from
colline to montane species such as Rumex arifolius, Lonicera
nigra, Adenostyles alliariae or Cicerbita alpina. However, as
opposed to tree species results, plot scores here were more cor-
related to temperature (R
2
= 0.40 with T annual; p < 0.0001)
than to water-related variables (R
2
= 0.28 with WB
June
; p <
0.0001).
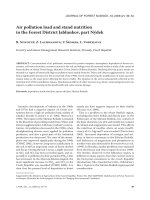
3.3. CCA and effect of main ecological variables
on stand composition
The CCA used with measured ecological variables (E
1
) con-
firmed the importance of both nutrient and water availability
factors to explain the composition of tree communities
(Tab. II). The first ordination axis was a mineral and nitrogen
nutrient gradient, fairly similar to the first axis of CA (e
1
= 0.62
with measured variables). The second CCA axis, linked to
WB
June
, clearly accounted for summer water availability and
also confirmed the gradient obtained with the CA (e
2
= 0.57).
The CCA ordination diagram provides an overview of tree
species behaviour according to measured soil resources (BS
and C:N ratio) and climatic variables (WB
June
) (Fig. 2). Five
tree species are found in the driest conditions. The arrangement
of these species along the nutrient gradient (axis 1) ranged from
Pinus sylvestris through Quercus petraea, Castanea sativa and
Carpinus betulus to Prunus avium. Only one species, Sorbus
aucuparia (in the tree strata) is found at the highest WB values.
It is always found, in the tree layer, at more than 800 m in
Table I. Correlation coefficients between environmental variables
and CA plot scores for: CA
T
, correspondence analysis of tree spe-
cies; CA
SHB
, correspondence analysis of shrubs, herbaceous species
and bryophytes. T, mean temperature; P, mean precipitation. Bold
indicates variables included in the multiple regression models. n.s.,
non-significant at p < 0.0001.
Variable
CA
T
CA
SHB
Axis 1 Axis 2 Axis 1 Axis 2
Nutritional:
Base Saturation 0.65 n.s. 0.74 n.s.
ln(Ca) 0.60 n.s. 0.75 n.s.
ln(Mg) 0.58 n.s. 0.58 n.s.
ln(K) 0.33 n.s. 0.28 n.s.
ln(Al) –0.52 n.s. –0.51 0.27
ln(H) –0.48 n.s. –0.57 0.23
pH 0.58 n.s. 0.59 –0.34
C:N ratio –0.52 n.s. –0.63 n.s.
Eumull humus form 0.66 n.s. 0.47 –0.34
Dysmoder-Eumoder humus form –0.42 n.s. –0.57 n.s.
Climatic:
Elevation n.s. 0.59 n.s. 0.60
Water balance of June n.s. 0.66 n.s. 0.53
Aridity index of June n.s. 0.64 n.s. 0.53
P annual n.s. 0.52 n.s. 0.26
P June n.s. 0.64 n.s. 0.46
T annual n.s. –0.59 n.s. –0.63
Table II. Efficiency of measured variables (E
1
) and estimated varia-
bles by indicator plants (E
2
, E
3
, E
4
) to predict tree species composi-
tion.
Analyses Constrain variables Eigenvalue Efficiency
index
λ
1
λ
2
e
1
* e
2
*
CA
T
0.41 0.36
CCA on (T,E
1
)BS, C:N ratio, WB
June
0.25 0.19 0.62 0.57
CCA on (T,E
2
)CA
SHB
axis 1, CA
SHB
axis 2 0.27 0.14 0.65 0.53
CCA on (T,E
3
)IV
BS
, IV
C:N
, IV
AI
0.26 0.14 0.64 0.51
CCA on (T,E
4
) R, N, F 0.25 0.12 0.61 0.48
*
See formula (1).
Figure 1. Tree species on correspondence analysis (CA
T
) ordination
diagram 1-2. Tree species abbreviations: 1, tree layer; 2, understory
tree layer; abal, Abies alba; acpl, Acer platanoides; acps, Acer pseu-
doplatanus; bepe, Betula pendula; cabe, Carpinus betulus; casa, Cas-
tanea sativa; fasy, Fagus sylvatica; frex, Fraxinus excelsior; piab,
Picea abies; pisy, Pinus sylvestris; prav, Prunus avium; qupe, Quer-
cus petraea; quro, Quercus robur; saca, Salix caprea; soar, Sorbus
aria; soau, Sorbus aucuparia.
Ecological response of tree species in the Vosges Mountains 765
elevation with annual rainfall above 1450 mm and often found
among the timberline species. For other favourable WB con-
ditions (null values for axis 2 and middle elevation forests),
Acer pseudoplatanus, Acer platanoides and Fraxinus excelsior
occur in fertile soils and Abies alba, Fagus sylvatica and Picea
abies are found in more acidic soils. Compared to CA, Quercus
robur and Salix caprea seemed to move towards more acidic
soils in CCA and Sorbus aria and Castanea sativa moved to
more extreme water balance conditions. These four species are
poorly represented in the data set (frequency < 10) and their
ecological requirements cannot be specified accurately.
In order to investigate the relevance of ground vegetation as
surrogate of measured variables, the first two axes of the
CA
SHB
were used in CCA as environmental variables to
explain tree stand composition. Estimated nutritional and cli-
matic variables with species indicator values for Central
Europe (Ellenberg IV) and indicator values from the EcoPlant
database, respectively, were also used as instrumental variables
in CCA. According to CCA results reported in Table II, the pre-
diction quality of tree species composition according to both
nutrient (axis 1) and climatic gradient (axis 2), allowed of rank
the 4 groups of predictors as follows for axis 1: CA
SHB
Axis
1-2 > EcoPlant IV > measured variables > Ellenberg IV; for axis
1 + 2: measured variables > CA
SHB
Axis 1-2 > EcoPlant IV >
Ellenberg IV. Differences between methods are not important
and as compared to variables measured directly, variables esti-
mated by plant species showed similar efficiency to predict tree
species composition.
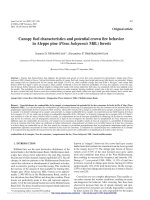
3.4. Nutritional and climatic behaviour of main tree
species
The behaviour of the 8 most frequent tree species in the Vos-
ges Mountains – silver fir, European beech, Norway spruce,
sessile oak, Scots pine, sycamore, hornbeam and ash – was
modelled with logistic regression according to the three main
environmental variables determining the distribution of tree
species: measured base saturation, C:N ratio and June water
balance (Tab. III).
Three tree species – Scots pine, Norway spruce and espe-
cially European beech – did not appear to be strongly linked to
the variables studied. The opposite was clearly observed for
sycamore, hornbeam, ash and sessile oak that occur only in a
narrow range of ecological conditions in the Vosges Mountains
(Tab. IV).
As shown in Figure 3, Norway spruce, sessile oak and Scots
pine are frequent on oligotrophic sites (low BS values), Norway
spruce in wet sites, and sessile oak and Scots pine in dry con-
ditions. The occurrence probability of this last species was
highest in the worse conditions of mineral, nitrogen and water
availability. European beech and silver fir prefer intermediate
nitrogen availability. However, both species have low nutri-
tional requirements, as evidenced by their high probability of
occurrence along the whole nutrient gradient. European beech
is present along the full WB gradient, while silver fir presents
a quadratic response with a preference for sites where WB
June
is positive. In hornbeam, ash and sycamore models, the nutri-
tional factor (BS) was highly significant (Tab. III). These tree
Figure 2. Tree species on CCA ordination diagram 1-2. (see Fig. 1
legend for abbreviations).
Table III. Coefficient of logit models predicting the occurrence of main tree species in the Vosges Mountains, according to measured environ-
mental variables. BS is base saturation; C:N is C:N ratio and WB is June Water Balance. Max. p is the maximum probability value of the t sta-
tistic associated to the variables.
Species Terms of model suggested Max p
Intercept BS BS
2
C:N C:N
2
WB WB
2
Abies alba –6.3297 0.0153 0.5768 –0.0112 0.0310 –0.0008 < 0.01
Acer pseudoplatanus –0.2637 0.0268 –0.1784 0.0218 < 0.01
Carpinus betulus 1.8667 0.0165 –0.3216 –0.0737 –0.0012 < 0.05
Pinus sylvestris –3.6536 –0.0187 0.1219 –0.0304 < 0.05
Picea abies –0.2577 –0.0150 0.0195 < 0.01
Quercus petraea –0.8093 –0.0137 –0.0699 < 0.05
Fraxinus excelsior 1.2048 0.0388 –0.4002 < 0.01
Fagus sylvatica –3.6276 0.4223 –0.0093 < 0.01
766 P.E. Pinto, J C. Gégout
species preferred sites with high levels of exchangeable base
cations (Ca, Mg, K), favourable nitrogen nutrition (low C:N
ratio) and low Al toxicity. Sycamore, at lower elevations (lower
values of WB) was only predicted at rich sites (BS > 80%),
while its presence was predicted throughout the entire range of
BS at the highest elevations (> 1000 m, high WB) with the high-
est values of occurrence probability in highest nutrient availa-
bility sites. With the same preference for a favourable nutrient
supply, hornbeam is located on more dry sites. Ash clearly has
the narrowest nutrient availability range: it occurs only when
BS > 30% and C:N ratio < 15 (Fig. 3).
Although not present in detail, the models obtained with esti-
mated variables based on vegetation provided similar results to
those found with measured variables: the positive or negative
effect of significant variables was the same for both types of
model. Differences were observed due to the ecological mean-
ing of climatic variables: for example, climatic variables had a
significant effect (at 0.01 p-level) on the sycamore occurrence
model only when they clearly indicated a climatic water avail-
ability gradient (measured WB and EcoPlant IV for aridity
index). A thermic gradient (axis 2 of CA
SHB
) or a soil moisture
gradient (F value of Ellenberg) did not have any significant
effect on the response curve of this species. Furthermore, mod-
els do not always incorporate the same nutritional variables:
nitrogen availability assessed by vegetation was thus signifi-
cant in the 8 tree species models whereas measured C:N, as
shown in Table III, was significant for 6 species.
Table IV shows the efficiency, based on the Akaike Infor-
mation Criterion (AIC), of measured variables and plant indi-
cator variables to model tree species occurrence. Clear
differences between measured variables and those estimated by
plant species predictors were only obtained for Quercus
petraea and Fraxinus excelsior, while for the 5 species Abies
alba, Fagus sylvatica, Picea abies, Pinus sylvestris and Acer
pseudoplatanus, both methods gave equivalent results. As
compared with measured variables, the results for Carpinus
betulus are clearly better for EcoPlant IV and CA plot scores
while Ellenberg IV showed worse results.
4. DISCUSSION
4.1. Factors determining species occurrence
Gradient analyses carried out in our study to determine eco-
logical factors responsible for shrub, herbaceous and bryo-
phytes composition showed a first gradient correlated with both
nitrogen nutrition (evaluated by C:N ratio) and soil base satu-
ration that is a direct measure of exchangeable cation pools.
This result confirmed the importance of changing soil proper-
ties along the acid-base gradient with nitrogen nutrition, alu-
minium and proton toxicity influencing the composition of
European forest plant communities [27], previously observed
in Norway [24], Sweden [14, 20], Britain [28], Denmark [34],
and northern Germany [37]. Furthermore, our study showed
that the same direct nutritional factors also explain the main
gradient of tree species distribution of mature deciduous, mixed
or coniferous forests in the Vosges Mountains. It completes
previous investigations that have shown a link between tree
species and indirect soil-related variables, such as geology or
soil types [55, 60]. However, our results could be more detailed
with the integration of other nutritional variables such as phos-
phorus, which has been determinant to species distribution in
other areas [24, 50]. Complementary investigations could also
be carried out with direct measures of mineralization rates of
N, such as incubation methods that are probably better indica-
tors of N availability than C:N ratio.
The weaker relationship between nutritional factors and tree
species composition as compared to the relationship linking
nutritional factors to other plant species can probably be
accounted for by silvicultural practices that influence stand
composition. As plantations were avoided in this study, silvi-
cultural practices could only modify stands by selective cutting
that decreases the occurrence probability of tree species. How-
ever, under the reasonable assumption of homogeneous prac-
tices along ecological gradients, this does not modify their
ecological optimum, but reduces the ecological interpretation
and the projected dispersion on the CCA axes. On the other
Table IV. Akaike Information criteria (AIC) of models predicting the occurrence of tree species (tree layer) in the study area. Four models are
shown by tree species in relation to different predicted variables used: measured variables (BS, C:N ratio, WB
June
); locally estimated variables
by plant species (CA
H
-axis 1, CA
H
-axis 2); estimated variables by EcoPlant IV (IV
BS
, IV
C:N
, IV
AI
); estimated variables by Ellenberg IV (R,
N, F).
Species Deviance null model
* AIC of models according to predicted variables
Measured
variables
Estimated variables
CA
SHB
Axes EcoPlant IV Ellenberg IV
Abies alba 448 43.4 41.1 41.3 31.0
Acer pseudoplatanus 299 65.4 68.8 64.2 67.9
Carpinus betulus 195 51.5 91.8 80.3 40.0
Fagus sylvatica 421 8.1 11.8 15.1 13.7
Fraxinus excelsior 209 79.4 92.2 84.9 86.7
Picea abies 420 23.8 18.0 25.8 32.9
Pinus sylvestris 242 29.4 23.9 25.3 22.7
Quercus petraea 367 97.4 73.2 78.7 83.6
* AIC = Null deviance – Residual deviance – 2
× (number of parameters).
Ecological response of tree species in the Vosges Mountains 767
hand, the better relationship between the composition of
shrubs, herbaceous species and bryophytes and the nutritional
variables measured at the A-horizon may be due to their higher
dependence on upper horizon nutrition than for tree species.
Their root system is, in fact, not very deep in relation to that of
tree species.
The other main gradient for both trees and other plant species
composition is related to climatic variables. The relevance of
these variables to vegetation composition was always shown
in mountainous areas [10, 55]. With separate analyses of trees
and other plant species on the same set of plots, we showed that
water availability was the main climatic factor determining tree
species, while it was temperature for shrubs, herbaceous spe-
cies and bryophytes. This difference is consistent with the
higher water requirements of tree species as compared to those
of shrubs, herbaceous species and bryophytes, and it is probable
that water availability is a stronger limiting factor for tree spe-
cies than for herbaceous species. The evaluation of soil water
(a)
Pinus sylvestris
(b)
Picea abies
(b)
Quercus petraea
10 30 50 70 90
-50
-30
-10
10
30
50
0
.
2
0
.
4
0
.
6
0
.
6
0
.
8
10 30 50 70 90
-50
-30
-10
10
30
50
0.
1
0.5
10 30 50 70 90
-50
-30
-10
10
30
50
0
.
0
5
0
.
1
0
0.
1
5
0
.
2
0
0
.
2
5
10 30 50 70 90
-50
-30
-10
10
30
50
0
.
1
0.2
0
.3
0
.
4
10 30 50 70 90
-50
-30
-10
10
30
50
0
.
2
0
.
4
0
.
6
0
.
8
(a)
Acer pseudoplatanus
(a)
Abies alba
(a)
Carpinus betulus
Base Saturation (%)
10 30 50 70 90
10
15
20
25
30
0
.
2
0
0
.
4
0
0
.
6
0
(c)
Fraxinus excelsior
Base Saturation (%)
(d)
Fagus sylvatica
10 30 50 70 90
10
15
20
25
30
0.4
0.4
0.5
0.5
0.6
10 30 50 70 90
-50
-30
-10
10
30
50
0
.
2
0
.
3
0
.
4
0
.
5
0
.
6
Figure 3. Predicted probability of occurrence for eight tree species according to main ecological factors structuring tree species composition.
(a) models with Base Saturation (BS), C:N ratio and June Water Balance (WB
June
) where C:N ratio = 17; (b) models with Base Saturation and
June Water Balance (WB
June
); (c) model with Base Saturation (BS) and C:N ratio; (d) model with C:N ratio.
768 P.E. Pinto, J C. Gégout
content available for roots is difficult to measure on a great
number of plots, but the taking into account of this variable in
addition to climate could improve the modelling of tree species
distribution.
4.2. Ecological response of tree species
The ecological response of tree species showed, for the
entire nutritional range, the decreasing occurrence of silver fir
and a simultaneous increase in the occurrence of sessile oak
below –10 to –30 mm WB deficit in June. These values give
the transition between sessile oak- European beech forest in the
colline zone and silver fir-European beech forest in the moun-
tain zone. Cachan [15], confirmed by the AURELHY model of
Météo France, showed for the Vosges mountains that precipi-
tation values are higher in the west of the mountain crest than
in the eastern side, leading at a value of –20 mm of WB deficit
in June for 400 m of altitude in the west side of the crest and
550 m of altitude in the east side. Similar transitions took place
for the same level of WB on oligotrophic soils between Scots
pine at low altitude and Norway spruce, and on nutrient-rich
soils between hornbeam at low altitude and sycamore at high
altitude. The relevant factors and limit values that control these
transitions must be verified in a larger geographical and eco-
logical context. In the Swiss Alps, for example, European beech
and silver fir seemed to have similar water balance require-
ments [11], while at low values of WB in the Vosges Moun-
tains, European beech extends with sessile oak in the absence
of silver fir.
Conifers, European beech and sessile oak occur on soils with
low BS values in the Vosges Mountains, as compared to horn-
beam, ash and sycamore that require fertile sites. The high
nutrient requirements of ash were observed in other field stud-
ies of realized niche, carried out in Sweden [18] and in Denmark
[42]. These different nutrient requirements between species are
consistent with experiments carried out to analyse Al toxicity
or Ca, Mg deficiency effects [62, 71]. They are also consistent
with the nutrient contents of tree species: higher for the most
nutrient demanding species such as sycamore, hornbeam and
ash than for low relative nutrient requirement species such as
Scots pine or Norway spruce [2, 3, 36, 56]. Because of their
lower nutrient requirements, Scots pine and Norway spruce can
endure more oligotrophic conditions, which can explain their
higher occurrence in acid soils in the Vosges context. However,
they can grow in a wide range of mineral soil conditions (i.e.
base saturation ratio and pH) in other mountainous areas and
in particular in the inner Alps [7, 33, 52]. In this area, it has been
shown that, in contrast to the Vosges mountains, the available
N and P content can be low in neutral and basic soils as well
as in very acidic soils [50]. The consistency between our field
results and those provided by previous field studies and exper-
iments suggests that the different responses of tree species
according to mineral soil characteristics can be extended over
the Vosges Mountains context.
Nutritional behaviour was related to climatic behaviour for
some tree species, such as sycamore, which is present in neg-
ative water balance sites only in areas with high nutritional lev-
els. On the contrary, this species is present throughout the entire
nutrient gradient for high water balance conditions. This can
be explained by the strong competition from hornbeam, ash and
sessile oak in sites with low water availability (at low eleva-
tion). The taking into account of both nutrient and climatic
effects on species distribution provides a better understanding
of their response to environmental factors.
4.3. Efficiency of measured and estimated variables
to explain tree species occurrence
Plant bioindication of ecological factors has been tradition-
ally widely used by forest managers to assess site quality, par-
ticularly soil moisture and nutrient availability, in order to
satisfy sustainable management objectives [8, 16, 69, 72]. The
herbaceous vegetation was also used in forest management to
predict tree species productivity, either directly [40, 53], after
a multivariate analysis [54] or using ecological groups of plant
species [68]. Our study tested the efficiency of understory veg-
etation to predict stand composition and occurrence probability
of native commercial tree species, which is also of great impor-
tance in forest management.
Understory vegetation, through CA sites scores, Ellenberg
or EcoPlant indicator values, gave results that were as effective
as measured ecological variables to predict forest composition
or species niche. Indicator values established on a national
scale, such as indicator values from EcoPlant database or Ellen-
berg indicator values, seem to be more interesting than multi-
variate ordination scores extracted from regional floristic
analysis, because they can be used over a broader area with a
fairly similar efficiency. The formalization and reproducibility
of EcoPlant IV construction represent their main interest as
compared to Ellenberg values. The high level of IV efficiency
confirms the approaches of Diekmann [18] and Laweson and
Oksanen [42], who derived the nutritional realized niche of tree
species using plant indicator characteristics. The estimation of
nutrient availability in sites using the plant indicator approach,
matched with GIS extraction of climatic variables, would allow
the use of numerous plots to assess realized niche of tree species
over wide areas according to the main ecological factors.
Acknowledgements: The authors wish to thank J C. Hervé for his
help and useful suggestions on an earlier version of this manuscript,
as well as D. Lopez and anonymous reviewers for their appropriate
comments. This study was financed through grant to Paulina Pinto by
the French Government. EcoPlant is a phytoecological database sup-
ported by the French Institute of Agricultural Forest and Environmen-
tal Engineering (ENGREF), the French Ministry of Agriculture
(DERF) and the French Agency for Environment and Energy Man-
agement (ADEME).
REFERENCES
[1] Akaike H., Information theory as an extension of the maximum
likelihood principle, in: Petrov B.N., Csaki F. (Eds.), Second Sym-
posium on Information Theory, Akademiai Kiai, Budapest, 1973,
pp. 267–281.
[2] André F., Ponette Q., Comparison of biomass and nutrient content
between oak (Quercus petraea) and hornbeam (Carpinus betulus)
trees in a coppice-with-standards stand in Chimay (Belgium), Ann.
For. Sci. 60 (2003) 489–502.
[3] Augusto L., Ranger J., Ponette Q., Rapp M., Relationships between
forest tree species, stand production and stand nutrient amount,
Ann. For. Sci. 57 (2000) 313–324.
Ecological response of tree species in the Vosges Mountains 769
[4] Austin M.P., Spatial prediction of species distribution: An interface
between ecological theory and statistical modelling, Ecol. Model.
157 (2002) 101–118.
[5] Austin M.P., Meyers J.A., Current approaches to modelling the
environmental niche of eucalyptus: implication for management of
forest biodiversity, For. Ecol. Manage. 85 (1996) 95–106.
[6] Austin M.P., Cunningham R.B., Fleming P.M., New approaches to
direct gradient analysis using environmental scalars and statistical
curve-fitting procedures, Vegetatio 55 (1984) 11–27.
[7] Bartoli C., Étude écologique sur les associations forestières de la
Haute-Maurienne, Ann. Sci. For. 23 (1966) 432–761.
[8] Becker M., Le Goff N., Diagnostic stationnel et potentiel de pro-
duction, Rev. For. Fr. 40 (1988) 29–43.
[9] Benichou P., Le Breton O., Prise en compte de la topographie pour
la cartographie des champs pluviométriques statistiques, Météoro-
logie 7 (1987) 23–34.
[10] Bergmeier E., Dimopoulos P., Fagus sylvatica forest vegetation in
Greece: Syntaxonomy and gradient analysis, J. Veg. Sci. 12 (2001)
109–126.
[11] Bolliger J., Kienast F., Zimmermann N.E., Risks of global warming
on montane and subalpine forests in Switzerland – a modeling
study, Reg. Environ. Change. 1 (2000) 99–111.
[12] Bonneau M., Evolution of the mineral fertility of an acidic soil
during a period of ten years in the Vosges mountains (France).
Impact of humus mineralisation, Ann. For. Sci. 62 (2005) 253–260.
[13] Brêthes A., Brun J.J., Jabiol B., Ponge J.F., Toutain F., Classifica-
tion of forest humus forms: a French proposal, Ann. Sci. For. 52
(1995) 535–546.
[14] Brunet J., Falkengren-Grerup U., Tyler G., Pattern and dynamics of
the ground vegetation in south Swedish Carpinus betulus forests:
Importance of soil chemistry and management, Ecography 20
(1997) 513–520.
[15] Cachan P., Étude bioclimatique du Massif Vosgien, Bull.
E.N.S.A.I.A. Nancy 16 (1974) 1–45.
[16] Cajander A.K., The theory of forest types, Acta For. Fenn. 29
(1926) 1–108.
[17] De Martonne E., Une nouvelle fonction climatologique: l’indice
d’aridité, Météorologie 2 (1926) 449–458.
[18] Diekmann M., Ecological behaviour of deciduous hardwood trees
in Boreo-nemoral Sweden in relation to light and soil conditions,
For. Ecol. Manage. 86 (1996) 1–14.
[19] Diekmann M., Species indicator values as an important tool in
applied plant ecology: A review, Basic Appl. Ecol. 4 (2003) 493–
506.
[20] Diekmann M., Falkengren-Grerup U., A new species index for
forest vascular plants: development of functional indices based on
mineralization rates of various forms of soil nitrogen, J. Ecol. 86
(1998) 269–283.
[21] Duchaufour P., Pédologie et groupes écologiques. I. Rôle du type
d’humus et du pH, Bull. Ecol. 20 (1989) 1–6.
[22] Duchaufour P., Pédologie et groupes écologiques. II. Rôle des fac-
teurs physiques : aération et nutrition en eau, Bull. Ecol. 20 (1989)
99–107.
[23] Duchaufour P., Toutain F., Apport de la pédologie à l’étude des
écosystèmes, Bull. Ecol. 17 (1985) 1–9.
[24] Elgersma A.M., Dhillion S.S., Geographical variability of rela-
tionships between forest communities and soil nutrients along a
temperature-fertility gradient in Norway, For. Ecol. Manage. 158
(2002) 155–168.
[25] Ellenberg H., Vegetation ecology of Central Europe, Cambridge
University Press, Cambridge, 1988.
[26] Ellenberg H., Weber H.E., Düll R., Wirth V., Werner W., Paulißen
D., Zeigerwerte von Pflanzen in Mitteleuropa, 1992.
[27] Falkengren-Grerup U., Brunet J., Quist M.E., Sensitivity of plants
to acidic soils exemplified by the forest grass Bromus benekenii,
Water Air Soil Pollut. 85 (1995) 1233–1238.
[28] Ferris R., Peace A.J., Humphrey J.W., Broome A.C., Relationships
between vegetation, site type and stand structure in coniferous plan-
tations in Britain, For. Ecol. Manage. 136 (2000) 35–51.
[29] Gégout J C., Étude des relations entre les ressources minérales du
sol et la végétation forestière dans les Vosges, thèse de l’Université
de Nancy I, Nancy, 1995, 215 p.
[30] Gégout J C., Houllier F., Canonical correspondance analysis for
forest site classification. A case study, Ann. Sci. For. 53 (1996)
981–990.
[31] Gégout J C., Coudun C., Brisse H., Bergès L., Comportement éco-
logique des espèces forestières vis-à-vis du climat et du sol en
France: application à l’évaluation des charges critiques d’acidité et
d’azote, Rapport final de la convention de recherche ADEM/
ENGREF n° 9962003, ENGREF, Nancy-France, 2002, 51 p.
[32] Gégout J C., Coudun C., Bailly G., Jabiol B., EcoPlant: A forest
site database linking floristic data with soil and climatic variables,
J. Veg. Sci. 16 (2005) 257–260.
[33] Gensac P., Les forêts d’épicéa de Tarentaise. Recherche de diffé-
rents types de Pessières, Rév. Gén. Bot. 74 (1967) 425–528.
[34] Graae B.J., Heskjaer V.S., A comparison of understorey vegetation
between untouched and managed deciduous forest in Denmark,
For. Ecol. Manage. 96 (1997) 111–123.
[35] Guisan A., Zimmermann N.E., Predictive habitat distribution
models in ecology, Ecol. Model. 135 (2000) 147–186.
[36] Hagen-Thorn A., Armolaitis K., Callesen I., Stjernquist I., Macro-
nutrients in tree stems and foliage: a comparative study of six tem-
perate forest species planted at the same sites, Ann. For. Sci. 61
(2004) 489–498.
[37] Härdtle W., Von Oheimb G., Westphal C., The effects of light and
soil conditions on the species richness of the ground vegetation of
deciduous forests in northern Germany (Schleswig-Holstein), For.
Ecol. Manage. 182 (2003) 327–338.
[38] Iverson L.R., Prasad A.M., Predicting abundance of 80 tree species
following climate change in the eastern United States, Ecol.
Monogr. 68 (1998) 465–485.
[39] Klinka K., Wang Q., Carter R.E., Relationships among humus
forms, forest floor nutrient properties, and understory vegetation,
For. Sci. 36 (1990) 564–581.
[40] Lahti T., Understorey vegetation as an indicator of forest site poten-
tial in southern Finland, Acta For. Fenn. 246 (1995) 2–69.
[41] Landolt E., Ökologische zeigerwerte zur Schweizer flora, Veröff.
Geobot. Inst. ETH, Zürich, 1977.
[42] Lawesson J.E., Oksanen J., Niche characteristics of Danish woody
species as derived from coenoclines, J. Veg. Sci. 13 (2002) 279–
290.
[43] Leathwick J.R., Austin M.P., Competitive interactions between tree
species in New Zealand’s old growth indigenous forests, Ecology
82 (2001) 2560–2573.
[44] Lebreton J.D., Chessel D., Prodon R., Yoccoz N., L’analyse des
relations espèces-milieu par l’analyse canonique des correspondances.
I. Variables de milieu quantitatives, Acta Oecol. 9 (1988) 53–67.
[45] Lenihan J.M., Ecological response surfaces for North American
boreal tree species and their use in forest classification, J. Veg. Sci.
4 (1993) 667–680.
[46] Mathsoft I., S-Plus 2000, Programmer’s Guide, MathSoft, Inc.,
Seattle, 1999.
[47] Mayer H., Waldbau auf sociologisch-ökologischer Grundlage,
Gustav Fisher, Stuttgart, Germany, 1992.
[48] Mccullagh P., Nelder J.A., Generalized linear models, Chapman &
Hall, London, UK, 1989.
[49] Mckenzie D., Peterson D.W., Peterson D.L., Thornton P.E., Clima-
tic and biophysical controls on conifer species distributions in
mountain forests of Washington State, USA, J. Biogeogr. 30 (2003)
1093–1108.
[50] Michalet R., Gandoy C., Joud D., Pages J.P., Choler P., Plant com-
munity composition and biomass on calcareous and siliceous subs-
trates in the northern French Alps: Comparative effects of soil che-
mistry and water status, Arct. Antarct. Alp. Res. 34 (2002) 102–113.
770 P.E. Pinto, J C. Gégout
[51] Michalet R., Rolland C., Joud D., Gafta D., Callaway R.M., Asso-
ciations between canopy and understory species increase along a
rainshadow gradient in the Alps: habitat heterogeneity or facilita-
tion? Plant Ecol. 165 (2002) 145–160.
[52] Michalet R., Cadel G., Joud D., Pache G., Pautou G., Richard L.,
Synthèse phytoécologique des forêts de l’arc alpin, Ecologie 29
(1998) 99–104.
[53] Nieppola J., Understorey plants as indicators of site productivity in
Pinus sylvestris L. stands, Scand. J. For. Res. 8 (1993) 49–65.
[54] Nieppola J., Carleton T.J., Relations between understorey vegeta-
tion, site productivity, and environmental factors in Pinus sylvestris
L. stands in southern Finland, Vegetatio 93 (1991) 52–72.
[55] Ohmann J.L., Spiess T.A., Regional gradient analysis and spatial
pattern of woody plant communities of Oregon forests, Ecol.
Monogr. 68 (1998) 151–182.
[56] Pagès J.P., Pache G., Joud D., Magnan N., Michalet R., Direct and
indirect effects of shade on four forest tree seedlings in the French
Alps, Ecology 84 (2003) 2741–2750.
[57] Prodon R., Lebreton J D., Breeding avifauna of a Mediterranean
succession: the holm oak and cork oak series in the eastern Pyré-
nées. 1. Analysis and modelling of the structure gradient, Oikos 37
(1981) 21–38.
[58] Rameau J C., Mansion D., Dumé G., Flore forestière française.
Guide écologique illustré. Tome 2 : Montagnes, Institut pour le
Développement Forestier, Paris, 1993.
[59] Rameau J C., Mansion D., Dumé G., Timbal J., Lecointe A.,
Dupont P., Keller R., Flore forestière française. Guide écologique
illustré. Tome 1 : Plaines et collines, Institut pour le Développe-
ment Forestier, Paris, 1989.
[60] Roche P., Tatoni T., Médail F., Relative importance of abiotic and
land use factors in explaining variation in woody vegetation in a
French rural landscape, J. Veg. Sci. 9 (1998) 221–228.
[61] Rol R., Contribution à l’étude de la répartition du sapin (Abies alba
Mill.), Ann. Éc. Natl. Eaux For. 7 (1937) 1–68.
[62] Sverdrup H., Warfvinge P., The effect of soil acidification on the
growth of trees, grass and herbs as expressed by the (Ca+Mg+K)/
Al ratio, Lund University, Department of Chemical Engineering,
Lund-Sweden, 1993, 108 p.
[63] Ter Braak C.J.F., Canonical correspondence analysis: a new eigen-
vector technique for multivariate direct gradient analysis, Ecology
67 (1986) 1167–1179.
[64] Ter Braak C.J.F., Barendregt L.G., Weighted averaging of species
indicator values: its efficiency in environmental calibration, Math.
Biosci. 78 (1986) 57–72.
[65] Ter Braak C.J.F., Looman C.W.N., Weighted averaging, logistic
regression and the Gaussian response model, Vegetatio 65 (1986)
3–11.
[66] Ter Braak C.J.F., Prentice I.C., A theory of gradient analysis, Adv.
Ecol. Res. 18 (1988) 271–317.
[67] Thornthwaite C.W., Mather J.R., Instructions and tables for compu-
ting potential evapotranspiration and the water balance, Publica-
tions in Climatology 10 (1957) 183–311.
[68] Wang G.G., White spruce site index in relation to soil, understory
vegetation, and foliar nutrients, Can. J. For. Res. 25 (1995) 29–38.
[69] Wang G.G., Use of understory vegetation in classifying soil mois-
ture and nutrient regimes, For. Ecol. Manage. 129 (2000) 93–100.
[70] Wartenberg D., Ferson F., Rohlf F., Putting things in order: A cri-
tique of detrended correspondence analyses, Am. Nat. 129 (1987)
434–448.
[71] Weber-Blasschke G., Claus M., Rehfuess K.E., Growth and nutri-
tion of ash (Fraxinus exelsior L.) and sycamore (Acer pseudoplata-
nus L.) on soils of different base saturation in pot experiments, For.
Ecol. Manage. 167 (2002) 43–56.
[72] Wilson S.M., Pyatt D.G., Malcolm D.C., Connolly T., The use of
ground vegetation and humus type as indicators of soil nutrient
regime for an ecological site classification of British forests, For.
Ecol. Manage. 40 (2001) 101–116.
To access this journal online:
www.edpsciences.org