Báo cáo lâm nghiệp: "Growing stock-based assessment of the carbon stock in the Belgian forest biomass" ppsx
Bạn đang xem bản rút gọn của tài liệu. Xem và tải ngay bản đầy đủ của tài liệu tại đây (209.3 KB, 12 trang )
853
Ann. For. Sci. 62 (2005) 853–864
© INRA, EDP Sciences, 2005
DOI: 10.1051/forest:2005076
Original article
Growing stock-based assessment of the carbon stock
in the Belgian forest biomass
Inge VANDE WALLE
a
*, Nancy VAN CAMP
b
, Dominique PERRIN
c
, Raoul LEMEUR
a
, Kris VERHEYEN
b
,
Bas VAN WESEMAEL
d
, Eric LAITAT
c
a
Laboratory of Plant Ecology, Ghent University, Coupure links 653, 9000 Gent, Belgium
b
Laboratory of Forestry, Ghent University, Geraardsbergse Steenweg 267, 9090 Melle, Belgium
c
Plant Biology Unit, Gembloux Agricultural Sciences University, passage des Déportés 2, 5030 Gembloux, Belgium
d
Department of Geography, Louvain-la-Neuve University, bât. Mercator, place Pasteur 3, 1348 Louvain-la-Neuve, Belgium
(Received 13 April 2004; accepted 22 March 2005)
Abstract – Belgian forests covered 693 181 ha in 2000, representing 22.7% of the total land area. As no biomass or carbon stock data are
included in the Flemish and Walloon regional forest inventories, species-specific wood densities, biomass expansion factors s.s. and carbon
content values were critically selected from the literature. Based on these conversion and expansion factors, and on data from the forest
inventories, the total C-stock in the living biomass of productive Belgian forests was assessed at 60.9 Mt C in the year 2000. The overall mean
C-stock amounted to 101.0 t C ha
–1
. This value was in the higher range of values reported for the neighbouring countries, mainly due to a high
mean growing stock in the Belgian forests (261.9 m
3
ha
–1
). The conversion from wood volume to wood biomass based on wood density values
reported in the literature appeared to introduce the largest variability in the assessment of the carbon stocks. Additional measurements of wood
densities in Belgian forests could help to reduce the uncertainty related to this factor. Because of the time-consuming and destructive character
of the determination of biomass expansion factors s.s. (BEFs), the establishment of new BEFs does not have the highest priority in the
framework of improving the assessment of the biomass carbon stock in the Belgian forests. As the median C-content value for all species except
beech was equal to the default IPCC-value of 50% carbon in dry matter, it seems appropriate to use this value for future calculations.
forest inventory / carbon stock / biomass expansion factor / wood density / aboveground and belowground biomass / carbon content
Résumé – Estimation des stocks de carbone dans la biomasse des forêts en Belgique. La forêt belge couvrait 693 181 ha en 2000, ce qui
représente 22,7 % de la surface totale du pays. Les inventaires forestiers flamands et wallons n’incluent pas de mesures directes de biomasse
ou de stock de carbone. Pour calculer les stocks de carbone dans les arbres forestiers à partir des volumes de bois fort, les infradensités du bois,
les facteurs d’expansion de la biomasse et les teneurs en carbone ont été sélectionnés dans la littérature. En 2000, les stocks de carbone dans la
biomasse des forêts belges productives étaient de 60,9 Mt C, soit 101,0 t C ha
–1
. Cette dernière valeur est relativement haute comparée avec
celles observées dans les forêts des pays avoisinants, à cause d’un grand volume de bois fort dans les forêts belges (261,9 m
3
ha
–1
).
L’infradensité du bois semble être le facteur qui introduit la plus importante variabilité dans le calcul des stocks de carbone dans la biomasse.
Des mesures complémentaires des infradensités du bois des essences les plus communes en Belgique pourraient aider à réduire
significativement les incertitudes sur les mesures des stocks de carbone dans les forêts. La détermination expérimentale des facteurs
d’expansion est coûteuse en temps et se base sur des analyses destructives. Ainsi, l’obtention de facteurs d’expansion propre à la situation belge
n’est pas prioritaire. La valeur par défaut de la teneur en carbone dans la matière sèche proposée par l’IPCC (50 %) semble appropriée dans le
calcul des stocks de carbone dans la biomasse forestière.
inventaire forestier / stock de carbone / facteur d’expansion de la biomasse / infradensité du bois / biomasse aérienne et souterraine /
teneur en carbone
Abbreviations: AG: aboveground; BEF: biomass expansion factor s.s. (t DM t
–1
DM); BEF s.l.: biomass expansion factor s.l. (collective
expression for WD, BEF and CC); BG: belowground; C: carbon; CC: carbon content (t C t
–1
DM); DM: dry mass; IM: impact factor; ResX:
result of scenario X; TSW: total solid wood; WD: wood density (t DM m
–3
).
* Corresponding author:
Article published by EDP Sciences and available at or />854 I. Vande Walle et al.
1. INTRODUCTION
All over the world, countries try to fulfil their commitments
under the United Nations Framework Convention on Climate
Change (UNFCCC), and they seek to achieve the national
engagements of the Kyoto Protocol (KP). Countries are
allowed to offset their emission reduction targets by increasing
biological carbon (C) sequestration in terrestrial ecosystems, as
indicated in Art. 3.3 (Afforestation, Reforestation and Defor-
estation) and Art. 3.4 (Additional human-induced activities) of
the KP [49]. Consequently, an increasing interest exists in the
accurate measurement of forest carbon stocks [8, 9, 26]. Glo-
bally, forests represent important carbon stocks: while only
occupying 27% of the world’s area covered by terrestrial eco-
systems, they contain 77% of the carbon stored in the biomass
and 46% of all soil-C [8, 24].
The Intergovernmental Panel on Climate Change (IPCC)
foresees through the so-called “bottom-up approach” for the
calculation of the stock changes over the first commitment
period (2008–2012). This approach is based on the use of data
available in national or regional forest inventories. Most forest
inventories are firstly meant for sound forest management prac-
tices and are intended to monitor the wood volumes of econom-
ical interest. Biomass measurements are usually not included
in the sampling procedure [12]. An exhaustive review of the
various forest inventories conducted by the member states in
the European Union and an analysis of their potentials to meet
the requirements under the KP were developed in 2000, as rep-
resented in a synoptic table by Laitat et al. [31]. However, if
the inventory-based carbon budgeting method has to be
applied, then calculation techniques are needed to convert and
expand stemwood volume into total aboveground and below-
ground carbon stocks [48]. If tree-wise data are available, bio-
mass equations can be applied [26, 51]. Otherwise, the use of
a conversion procedure based on so-called biomass expansion
factors s.l. (BEFs s.l.) is proposed by the IPCC guidelines for
the cases where no biomass information is readily available
[21]. Within this context, the question remains which of the
conversion and expansion factors reported in literature repre-
sent the most suitable values to apply for a specific region or
country.
In Belgium, climate policy is formulated at the federal level,
requiring co-operation between regional and federal adminis-
trations. Belgian forests covered 693 181 ha in 2000 [2, 42].
This represented 22.7% of the total land surface. The Flemish
and the Walloon region used a similar sampling strategy for
their forest inventory [1, 33]. As is the case for other countries,
the Belgian forest inventories are not considering tree biomass
or carbon stocks. Therefore, values were selected from the lit-
erature for: (i) the wood density per tree species, (ii) the species-
specific expansion factors to calculate the total aboveground
and belowground biomass starting from the stem biomass, and
(iii) the carbon content value for conversion of biomass into
carbon stock.
The objectives of this work were: (i) to critically select bio-
mass expansion factors s.l. applicable for the most important
tree species in the Belgian forests, (ii) to calculate the total car-
bon stock in the living biomass of the Belgian forests for the
year 2000 and (iii) to identify the biomass expansion factors s.l.
which introduce the largest variability in the carbon stock cal-
culations.
2. MATERIALS AND METHODS
Belgium has a temperate maritime climate, with moderate temper-
ature variability, prevailing westerly winds, heavy cloud cover and
regular rain. The definitions of “forest” in the Belgian inventories are
based on minimum requirements: an area of 0.5 ha and 0.3 ha, a width
of 25 m and 9 m and a canopy closure of 20% and 10% in Flanders
and the Walloon provinces (= Wallonia) respectively [1, 33]. These
slight differences are due to specific aspects of the two regional poli-
cies on land use management. The consequences on the total wood vol-
ume however are negligible. The distribution of forests in Belgium is
shown in Table I. The total forest area in Flanders amounted to 146 381 ha
in 2000, based on the regional forest mapping [2], while Walloon for-
ests covered 544 800 ha [42]. The data presented hereafter do not
include the forests in the Brussels-Capital Region. Moreover, the study
was focussed on productive forests only, and as such, data on non-pro-
ductive or so-called “Forests not available for wood supply” or
FNAWS [16] were excluded from the analysis.
2.1. The regional forest inventories of Belgium
The sampling points of the regional forest inventories were selected
according to a 1.0 km × 0.5 km grid oriented from the east to the west
on the National Geographic Institute (NGI) maps at a scale of 1/25 000.
The rectangular grid had the advantage of going against the orientation
of the relief elements oriented along a southwest-northeast axis and
against ecological and geological gradients predominant in the N-S
orientation. Each grid intersection, located in a forest, represented the
centre of a sampling plot. For plots at edges or borders, the plot centre
was moved towards the inside of the forest [1, 33].
Table I . Distribution of forests over the three Belgian regions: Flanders, Brussels-Capital and Wallonia; forest cover gives the ratio of the
regional forest area to the total regional area.
Region Total area Forest area Forest cover % of the total
(km
2
)(km
2
) (%) Belgian forest area
Flanders 13 521 1 463 10.8 21.1
Brussels Capital 162 20 12.3 0.3
Wallonia 16 845 5 448 32.3 78.6
Belgium 30 528 6 931 22.7 100.0
Carbon stock in Belgian forests 855
Sampling plots are circular and of 1000 m
2
each. The following
information was collected: category of property (private or public:
state, region or province), municipality, forest type, stand structure and
development stage, commercial quality for broadleaf species with a
section exceeding 22 cm circumference, evidence of damage caused
by game and the health and condition for harvest (these two last cat-
egories are only available for the Walloon forests). Topography (expo-
sition and slope), soil texture and drainage class, age (class), canopy
closure, tree species, circumference at 1.5 m and total and dominant
heights were also collected. Basic information in the Flemish and the
Walloon inventories was therefore very similar. Moreover, the same
volume tables were applied to calculate the total solid wood (TSW)
volume from tree circumference and tree height. The terminology
“total solid wood” refers to the combination of stem and branches with
a circumference exceeding 22 cm [14].
In Flanders, 2 665 plots were sampled in the framework of the first
forest inventory, which was constituted in the period 1997–1999 [1].
This regional inventory is intended to be repeated every 10 years, to
allow e.g. the calculation of growth rates in the Flemish forests. The
first Walloon forest inventory was completed in 1984. For this study,
the current permanent systematic sampling was used. This second
inventory started in 1994 and covers each year 10% of the approxi-
mately 11 000 sampling points [33]. In 2000 (reference year for this
study), 50% of the sample points of the second inventory were measured.
With more than 13 000 plots over a territory of 30 528 km
2
, forest
inventories in Belgium have one of the highest sampling rates in
Europe. Compared to other countries or regions, the Belgian sampling
grid, with each sampling point representing 50 ha of forest, is very
dense [15, 31]. In comparison, one plot represents 2 400 ha of forest
land in the USA [9].
Based on the information of the regional forest inventories, the total
area (ha) and the total solid wood volumes (m
3
) of different species
were calculated for the Flemish and Walloon productive forests, or so-
called forests available for wood supply (FAWS) [16]. Summation of
these values, given in Table II, gives the total area and volume for Bel-
gium. Flanders represented 24.0% of the Belgian productive forest
area, and Wallonia 76.0%. In total, 75.9% of the coniferous forest area
and 76.2% of the deciduous forest area were found in Wallonia, com-
pared to 24.1% and 23.8% respectively for Flanders.
2.2. Biomass expansion factors s.l.
The calculation of the amount of carbon stored in the biomass of
trees is usually based on biomass expansion factors s.l. [7, 9, 18, 41].
Conversion factors are used to calculate amounts of dry mass (t DM)
from information on the volume (m
3
), or to convert dry mass (t DM)
into carbon stock (t C). Expansion factors on the other hand give the
possibility to scale up information from a smaller to a higher level, e.g.
from stem volume to total aboveground and belowground volume. In
this study, “biomass expansion factors s.l.” (BEFs s.l.) is used as the
collective name for both conversion factors and expansion factors.
Three categories of BEFs s.l. were distinguished here. In the first place,
this concerned the wood density (WD), in order to convert fresh wood
volume to wood dry mass. Secondly, biomass expansion factors s.s.
(BEFs) were used to calculate (i) aboveground (AG) dry mass from
solid wood dry mass, (ii) belowground (BG) dry mass from above-
ground dry mass, or (iii) total aboveground and belowground dry mass
from solid wood dry mass. Finally, the carbon content (CC) enabled
the conversion from total dry mass to total carbon stock.
As the aim of our study was to improve the methodology for the
calculation of the total carbon stock in the living biomass of Belgian
forests, some explicit conditions were applied for the selection of biomass
expansion factors s.l. from the literature. For the expansion factors s.s.,
foliage had to be included, in accordance with the IPCC-methodology
[25]. The analysis was limited to data reported for Belgium, Denmark,
France, Germany, Great Britain, Ireland and the Netherlands. These
countries all belong to the Central-Western European or North-West-
ern European group of countries as indicated in the TBFRA report of
the FAO [16]. Values were selected for ten (groups of) species occur-
ring in the Belgian forests: pines (Pinus sp.), Douglas fir (Pseudotsuga
Table II. Area and total solid wood volume for different tree species in Flanders and Wallonia, for the year 2000; information deduced from
the Flemish and Walloon forest inventories [1, 3] (Hugues Lecomte, personal communication).
Species
Flanders Wallonia
Area Volume % of total Area Volume % of total
(ha) (1 000 m
3
) volume (ha) (1 000 m
3
)volume
Pine 63 550 12 867.2 39.9 14 800 3 743.4 3.0
Douglas fir 1 280 371.0 1.2 10 800 2 387.2 1.9
Larch 3 060 782.3 2.4 8 200 2 081.2 1.7
Spruce 2 860 527.1 1.6 171 700 52 502.8 41.8
Other coniferous 910 174.0 0.5 19 600 4 955.4 3.9
Total coniferous 71 660 14 721.5 45.7 225 100 65 669.9 52.2
Beech 7 790 2 500.5 7.8 42 200 12 278.0 9.8
Oak 14 320 3 696.4 11.5 81 600 20 372.4 16.2
Mixed noble 10 250 2 357.0 7.3 57 100 15 041.4 12.0
Poplar 19 060 5 217.2 16.2 9 500 2 703.9 2.2
Other deciduous 21 650 3 753.1 11.6 43 200 9 661.7 7.7
Total deciduous 73 070 17 524.1 54.3 233 600 60 057.3 47.8
TOTAL 144 730 32 245.5 100.0 458 700 125 727.1 100.0
856 I. Vande Walle et al.
menziesii (Mirb.) Franco), larches (Larix sp.), Norway spruce (Picea
abies (L.) Karst.), beech (Fagus sylvatica L.), oaks (Quercus robur L.
and Q. petraea L.), mixed “noble” species (including maple (Acer
pseudoplatanus L.), elms (Ulmus sp.), ash (Fraxinus excelsior L.) and
red oak (Quercus rubra L.)) and poplars (Populus sp.). Other species
were grouped in the “other coniferous” or “other deciduous” species
class. The intention was to select BEFs s.l. for three age classes:
1–20 years, 21–40 years and more than 40 years, and to define a min-
imum, a maximum and a median value for each category of BEF s.l.
2.3. Total carbon stock in Belgian forests
The total aboveground and belowground carbon stock for a specific
species can be calculated by formula (1) or (2):
total (AG + BG) C = TSW-volume × WD × BEF1 × (1 + BEF2) × CC
(1)
or
total (AG + BG) C = TSW-volume × WD × BEF3 × CC (2)
with:
total (AG + BG) C: total C-stock in the aboveground and below-
ground biomass (t C),
TSW-volume: total volume of the solid wood (m
3
),
WD: wood density (t DM m
–3
),
BEF1: ratio aboveground dry mass to total solid wood dry mass
(t AG DM t
–1
TSW DM),
BEF2: ratio belowground dry mass to aboveground dry mass
(t BG DM t
–1
AG DM),
BEF3: ratio aboveground and belowground dry mass to total solid
wood dry mass (t (AG + BG) DM t
–1
TSW DM),
and CC: carbon content (t C t
–1
DM).
For all species, species-specific BEF3 values were found in the lit-
erature. Therefore, the total carbon stock in the Belgian forest biomass
was calculated by applying formula (2). Carbon stocks were calculated
by species, for Flanders and for Wallonia, and were then summed to
give the total C-stock for Belgium. To acknowledge the uncertainty
linked with the use of biomass expansion factors s.l., C-stocks were
calculated based on minimum, median and maximum values of the
expansion factors s.l. found in the literature.
2.4. Predominant expansion factor category
In a first test, the difference between formula (1) and (2) was
assessed. For pine, Douglas fir, “other coniferous”, beech and “other
deciduous”, species-specific values for BEF1, BEF2 and BEF3 were
available (see Tab. III). For these five (groups of) species, the total car-
bon stock was calculated by using both formula (1) (with BEF1 and
BEF2) and formula (2) (with BEF3), and this for the minimum, median
and maximum BEFs s.l. The ratio of the result of formula (1) to the
result of formula (2), expressed in terms of percentage, represented the
difference between both formulas.
In a second analysis, eight scenarios were established, to analyse
all possible combinations of the minimum and maximum values of
WD, BEF and CC (see Tab. IV). For each scenario, the total carbon
stock was calculated for each species. The resulting carbon stocks are
indicated as Res1, Res2, Res3, etc., with the number referring to the
scenario applied. As for all species species-specific values for BEF3
were found in the literature, formula (2) was used for this second test.
The impact factors of the wood density (IM-WD), the biomass expan-
sion factor s.s. (IM-BEF) and the carbon content (IM-CC) on the total
carbon stock for Belgium as a whole, for all conifers and all deciduous
species, and for a specific species were calculated as follows:
(3)
(4)
.(5)
The impact factors calculated with formula (3), (4) and (5) gave
the mean ratio between the results obtained with the maximum and
minimum values of the expansion factor category under consideration,
expressed in terms of percentage. These impact factors were then used
to find the expansion factor category introducing the largest variability
in the calculation of the total C-stock.
3. RESULTS
3.1. Biomass expansion factors s.l.
Table III gives an overview of the selected minimum, max-
imum and median biomass expansion factors s.l. for each spe-
cies (group). In addition, the number of available values for
each species and each expansion factor category are indicated.
These BEFs s.l. fulfilled the conditions stated above, and were
reported by (at least one of) the following authors: Baritz and
Strich [4], Bartelink [5, 6], COST-E21 [13], Dieter and Elsasser
[15], Grote [19], Guilley et al. [20], Houghton et al. [21], IPCC
[25], Janssens et al. [27], Joosten and Schulte [28], Joosten et al.
[29], Lebaube et al. [32], Lefèvre et al. [34], Levy et al. [36],
Löwe et al. [37], Milne and Brown [38], Mund et al. [39],
Nabuurs et al. [41], Pignard et al. [43], Ponette et al. [44],
Pontailler et al. [45], Schalck et al. [47], Vande Walle and
Lemeur [52], Vande Walle et al. [53]. BEFs s.l. from other stud-
ies that were inconsistent with (one of) the above-mentioned
selection conditions (e.g. [9, 35]), were not taken into consid-
eration. As can be seen from Table III, no age classes were dis-
tinguished in the end, although it is widely known (e.g. [26, 35,
39, 46]) that BEFs s.l. are age-dependent. However, we
couldn’t find enough species-specific BEF s.l. values with a
clear indication of tree age to make the distinction of three age
classes meaningful in the framework of this study.
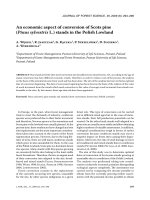
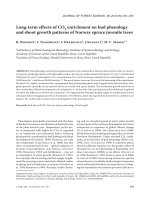
From Figure 1, it can be seen that wood density (WD) values
were in general significantly lower for coniferous than for
deciduous tree species, except for poplar. minimum values ranged
from 0.34 t DM m
–3
for spruce and poplar to 0.55 t DM m
–3
for beech (Tab. III). The range of the maximum values spanned
from 0.45 t DM m
–3
for spruce to 0.77 t DM m
–3
for “other
deciduous” species. Median values varied between 0.38 t DM
m
–3
for spruce and 0.60 t DM m
–3
for oak.
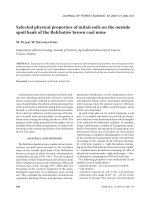
For all species except poplar, species-specific values were
found for the first biomass expansion factor s.s., the ratio of the
aboveground biomass to total solid wood biomass (BEF1). Box
plots of the BEF1 values are shown in Figure 2 for those species
for which at least 5 values were available. Minimum values
ranged from 1.14 t DM t
–1
DM for pine, larch, spruce and other
IM WD–
Res5
Res1
-
Res6
Res2
-
Res7
Res3
-
Res8
Res4
-+++
4
100×
100–=
IM BEF–
Res3
Res1
-
Res4
Res2
-
Res7
Res5
-
Res8
Res6
-+++
4
100×
100–=
IM CC–
Res2
Res1
-
Res4
Res3
-
Res6
Res5
-
Res8
Res7
-+++
4
100×
100–=
Carbon stock in Belgian forests 857
Table III. Minimum (min.), maximum (max.) and median (med.) values of biomass expansion factors (BEFs) s.l. of different tree species; DM = dry matter; TSW = total solid
wood biomass (stems and branches with a diameter > 7 cm); AG = aboveground biomass, foliage included; BG = belowground biomass; “noble species” = maple, ash, elm and red
oak; # gives the number of values found for a particular tree species and expansion factor category; see text for references.
Species
Wood density
(t DM m
–3
)
Carbon content
(t C t
–1
DM)
AG / TSW or BEF1
(t DM t
–1
DM)
BG / AG or BEF2
(t DM t
–1
DM)
AG + BG / TSW or BEF3
(t DM t
–1
DM)
min. max. med. # min. max. med. # min. max. med. # min. max. med. # min. max. med. #
Pine 0.39 0.60 0.48 13 0.40 0.55 0.50 9 1.14 1.40 1.32 5 0.16 0.16 0.16 1 1.43 2.00 1.50 7
Douglas fir 0.37 0.54 0.45 7 0.50 0.50 0.50 1 1.18 2.24 1.28 10 0.17 0.17 0.17 1 1.50 2.00 1.71 3
Larch 0.41 0.55 0.47 8 0.40 0.50 0.50 3 1.14 1.36 1.30 3 1.50 2.00 1.75 4
Spruce 0.34 0.45 0.38 15 0.40 0.51 0.50 5 1.14 1.71 1.29 9 1.50 2.00 1.75 2
Other coniferous 0.35 0.50 0.40 20 0.40 0.50 0.50 7 1.14 1.71 1.33 5 0.18 0.25 0.20 3 1.50 2.00 1.75 4
Beech 0.55 0.72 0.56 11 0.44 0.51 0.49 10 1.16 2.04 1.34 9 0.23 0.25 0.24 2 1.50 1.75 1.67 3
Oak 0.50 0.72 0.60 9 0.45 0.50 0.50 3 1.24 1.39 1.32 2 1.50 1.50 1.50 1
Mixed noble 0.52 0.69 0.59 9 0.50 0.50 0.50 1 1.29 1.29 1.29 1 1.50 1.50 1.50 3
Poplar 0.34 0.55 0.41 48 0.50 0.50 0.50 1 1.50 1.50 1.50 1
Other deciduous 0.38 0.77 0.55 34 0.45 0.50 0.50 6 1.24 1.40 1.32 2 0.20 0.22 0.21 2 1.50 1.50 1.50 1
858 I. Vande Walle et al.
conifers, to 1.29 t DM t
–1
DM for noble species (Tab. III).
While the range of the maximum BEF1 values was rather large,
from 1.29 t DM t
–1
DM for mixed noble species to 2.24 t DM t
–1
DM for Douglas fir, the median values for all species ranged
only from 1.28 t DM t
–1
DM for Douglas fir to 1.34 t DM t
–1
DM for beech. For the ratio belowground biomass to above-
ground biomass (BEF2), values were found only for 5 of the
10 species categories considered. A review study for all major
biomes [11] showed that most values for BEF2 are found to be
between 0.20 and 0.30. Values found here fitted the lower half
of this range, or were lower. For each of the selected species,
values were found for the ratio total (aboveground and below-
ground) biomass to solid wood biomass (BEF3). Median values
for BEF3 were in general higher for coniferous than for decid-
uous species (Tab. III), except for pine and beech.
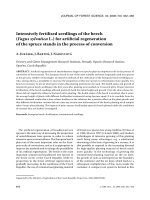
The median values for carbon content, graphically presented
in Figure 3, were 0.50 t C t
–1
DM for all species, except for
beech, which had a median value of 0.49 t C t
–1
DM. Remark-
able is the high range of CC values reported for coniferous tree
species (Tab. III).
Table I V. Eight scenarios applied for the impact study of three cate-
gories of biomass expansion factors s.l.: wood density (WD), bio-
mass expansion factor s.s. (BEF) and carbon content (CC).
Scenario
WD BEF CC
(t DM m
–3
)(t DM t
–1
DM) (t C t
–1
DM)
1 Min. Min. Min.
2Min.Min.Max.
3Min.Max.Min.
4 Min. Max. Max.
5 Max. Min. Min.
6Max.Min.Max.
7Max.Max.Min.
8 Max. Max. Max.
pine
Douglas fir
larch
spruce
conifers
beech
oak
mixed noble
poplar
deciduou
s
Wood density (t DM m
-3
)
0.3
0.4
0.5
0.6
0.7
0.
8
Figure 1. Box plots of wood density values for different tree species
(groups); the horizontal line within each box represents the median
value for each species (group). Each box contains 50% of the observed
values within the limits of the first and the third quartile. Error bars
indicate 10 and 90% quartiles.
Figure 2. Box plots (see Fig. 1 for detailed description) of BEF1
values for different tree species (groups); only species for which more
than 5 BEF1 values were available are presented.
Figure 3. Box plots (see Fig. 1 for detailed description) of carbon con-
tent values for different tree species (groups); only species for which
more than 5 CC values were available are presented.
Carbon stock in Belgian forests 859
3.2. Total carbon stocks in the Belgian forest biomass
The total carbon stocks in the living biomass of the Flemish
and the Walloon productive forests are given in Table V. Sum-
mation of the Flemish and Walloon stocks gave the total carbon
stock in the productive forests of Belgium for the year 2000,
also presented in Table V. Based on the use of median expan-
sion factors for all species, the total carbon stock in Belgian for-
ests amounted to 60.9 Mt C. In total, 20.2% of the Belgian living
forest biomass carbon stock was located in the Flemish forests,
while the Walloon forests contained 79.8% of the forest carbon
of Belgium. The minimum BEF s.l. scenario resulted in a value
of 42.8 Mt C for the total carbon stock in Belgium, while the
maximum scenario result amounted to 83.5 Mt C.
Based on the total carbon stocks resulting from the median
expansion factor scenario on the one hand (Tab. V), and the
total forest area in both Flanders and Wallonia on the other hand
(Tab. II), the mean carbon stock per area unit was calculated.
In Flanders, productive forests contained 85.2 t C ha
–1
on aver-
age. The mean value for the Walloon forests amounted to
105.9 t C ha
–1
. When all Belgian productive forests were con-
sidered together, a mean carbon stock of 101.0 t C ha
–1
was
found.
3.3. Predominant expansion factor category
The results of the first test, comparing the application of for-
mula (1) and formula (2) for five (groups of) species, are given
in Table VI. The ratios were lower than 100% for the minimum
BEF s.l. scenario and higher than 100% for the maximum sce-
nario (except for pine). When the median BEF s.l. values were
used, both ratios lower (Douglas fir, other coniferous species
and beech) and higher (pine and other deciduous species) than
100% were found.
The impact factors for wood density, biomass expansion fac-
tor s.s. and carbon content calculated with formula (3), (4) and
(5) are given in Table VII. Wood density had the highest impact
factor regarding the calculation of the total C-stock in Belgium
(42.9%), while the impact factors of the carbon content (17.4%)
and the biomass expansion factors s.s. (17.1%) were compara-
ble. When coniferous and deciduous trees were considered sep-
arately, it became clear that for both species types, WD had the
highest IM: 38.5% for coniferous trees, and 46.8% for decid-
uous species. The IM of BEF3 was almost ten times higher for
conifers than for deciduous species (34.9% and 3.7% respec-
tively). Moreover, the IM of the carbon content for coniferous
species (28.6%) was more than threefold the IM found for
deciduous species (8.5%).
Table V. Total carbon stock (Mt C) in the living biomass of Belgian
productive forests in the year 2000; calculations based on minimum
(min.), median (med.) and maximum (max.) biomass expansion fac-
tors s.l.
Min. Med. Max.
Flanders
Coniferous 3.3 5.3 9.5
Deciduous 5.3 6.9 9.0
Coppice 0.06 0.09 0.13
Total Flanders 8.7 12.3 18.6
Wallonia
Coniferous 13.8 22.3 31.5
Deciduous 18.5 23.9 30.4
Coppice 1.8 2.4 3.0
Total Wallonia 34.1 48.6 64.9
Belgium
Coniferous 17.1 27.6 41.0
Deciduous 23.9 30.8 39.4
Coppice 1.9 2.5 3.1
Total Belgium 42.8 60.9 83.5
Table VI. Comparison of the carbon stock calculated by formula (1)
(using BEF1 and BEF2) and formula (2) (based on BEF3); ratios in
%, giving the outcome of (result formula (1) / result formula (2)) ×
100.
Min. Med. Max.
Pine 92.5 101.9 81.0
Douglas fir 92.0 87.6 131.0
Other coniferous 89.7 91.4 107.0
Beech 95.1 99.5 145.7
Other deciduous 99.2 106.5 113.9
Table VII. Impact factor (IM) of wood density (WD), biomass
expansion factor s.s. (BEF) and carbon content (CC) on the total car-
bon stock of Belgian forests.
IM-WD IM-BEF IM-CC
Belgium 42.9 17.1 17.4
Coniferous 38.6 34.9 28.6
Deciduous 46.9 3.7 8.5
Spruce 32.5 33.3 27.7
Douglas fir 46.0 33.3 0.0
1
Larch 34.2 33.3 25.0
Pine 53.9 40.0 38.0
Other coniferous 42.9 33.3 25.0
Beech 30.9 16.7 15.9
Oak 44.0 0.0
1
11.1
“Noble” species 32.7 0.0 0.0
1
Poplar 61.8 0.0
1
0.0
1
Other deciduous 102.6 0.0
1
11.1
1
Indicates that only one value was available for this BEF s.l. category.
860 I. Vande Walle et al.
The impact factors of wood density, biomass expansion fac-
tors s.s. and carbon content were also calculated for the tree spe-
cies separately (Tab. VII). In some cases, the minimum and
maximum values of the parameters were the same (see
Tab. III), which resulted in an impact factor equal to zero.
Wood density had the highest impact factor regarding the C-
stock assessment of all species except spruce. For spruce, the
IM of BEF3 was slightly higher (33.3%) than the IM of wood
density (32.4%). From Table VII, it can also be seen that the
impact factor of BEF3 was higher for the coniferous species
than for the deciduous species. However, for three of the five
groups of deciduous species, only one species-specific BEF3
value was found.
4. DISCUSSION
For the calculation of the total carbon stock in the Belgian
forest biomass, formula (2) was used. In this study, our strict
selection conditions for biomass expansion factors s.l. should
sustain the assumption that the carbon stock assessed by apply-
ing these BEFs s.l. is reasonable for Belgium. This means that
the carbon stock in the living biomass of the Belgian forests in
the year 2000 amounted to 60.9 Mt C, or was at least expected
to fall within the range between 42.8 Mt C and 83.5 Mt C.
Shrubs and very small trees were not included in this value.
Schroeder et al. [48] reported that small trees contained as much
as 75% of the biomass in trees with a diameter at breast height
greater than 10 cm, in stands with a low aboveground biomass
stock. However, it can be assumed that in most Belgian forests,
this shrub and small tree pool represents only a very small car-
bon stock [1, 33]. Another pool that was neglected in this study,
was the dead wood in the forests. In the Flemish and Walloon
inventories, information on dimensions of standing and laying
dead wood is available. However, the decomposition phase of
the dead wood is not noted. This information is crucial to assess
the dead wood density from literature values [9, 12]. A specific
study on the determination of the C-stock in this dead wood
compartment is therefore needed.
In Flanders, 49.3% of the forests are younger than 40 years,
while in Wallonia, only 26.1% have an age lower than 40 years.
This explains the lower mean carbon stock per area unit in Flan-
ders (85.2 t C ha
–1
) compared to Wallonia (105.9 t C ha
–1
). This
lower carbon stock is also linked with a lower mean standing
volume in the Flemish forests (222.8 m
3
ha
–1
), compared to the
Walloon forests (274.1 m
3
ha
–1
). Mean standing volumes and
mean carbon stocks for neighbouring countries are listed in
Table VIII. The mean carbon stock in the biomass of Belgian
forests, 101.0 t C ha
–1
, was considerably higher than the values
reported for Great Britain (36.8 t C ha
–1
), Ireland (38.3 t C ha
–1
),
Denmark (56.6 t C ha
–1
), the Netherlands and France (both
59.0 t C ha
–1
). German forests on the other hand had a carbon
stock of 105.7 t C ha
–1
, which is slightly higher than the value
for Belgium. There are several explanations for the differences
in mean carbon stock. The main reason is the difference in mean
standing volume, which can on its turn be due to various causes.
Forests in Ireland for example are mainly planted since 1950.
This results in a predominance of young forests, mainly on peat
soils, with a related low standing stock [10]. The lower standing
stock in Dutch forests compared to Belgium can be attributed
to the fact that forests in the Netherlands are mainly concen-
trated on poor, dry sandy soils [40], while in Belgium, forests
are located on richer sandy-loam and loamy soils too. The good
agreement between the standing stock in German productive
forests (276.0 m
3
ha
–1
) and in Wallonia (274.1 m
3
ha
–1
) is
reflected in an almost identical mean C-stock (105.7 t C ha
–1
for Germany, 105.9 t C ha
–1
for Wallonia).
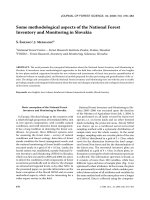
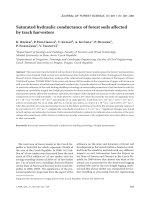
Besides the difference in standing stock, the choice of the
BEFs s.l. used for the carbon stock calculation explains the dif-
ferences in mean carbon stock. The solid line in Figure 4 indi-
cates the relation between standing stock and mean carbon
content based on the overall Belgian BEF of 0.39 t C m
–3
TSW.
The overall BEF for the Netherlands (0.35 t C m
–3
TSW) and
Ireland (0.25 t C m
–3
TSW) were lower than the ones used for
the carbon stock assessment in Belgium, Germany and France,
which were all close to 0.39 t C m
–3
TSW. Wood density values
used by Nabuurs and Mohren [40] were comparable to the min-
imum values used in our study. The mean carbon stock in Bel-
gium based on the minimum BEF s.l. parameter scenario
Table VIII. Total solid wood volume (TSW) and mean carbon stock per ha forest area in Belgium and neighbouring countries.
TSW
(m
3
ha
–1
)
C-stock
(t C ha
–1
)
Reference
Great Britain (G.B.) 36.8 Milne and Brown [38]
conifers 21.1 Milne and Brown [38]
deciduous 61.9 Milne and Brown [38]
Ireland 152.4 38.3 Gallagher et al. [17]
Denmark 132.4 56.6 Vesterdal [54]
France 151.0 59.0 IFN [22] and Pignard et al. [43]
The Netherlands 170.0 59.0 Nabuurs and Mohren [40]
Belgium 261.9 101.0 This study
Flanders 222.8 85.2 This study
Wallonia 274.1 105.9 This study
Germany 276.0 105.7 Baritz and Strich [4]
Carbon stock in Belgian forests 861
amounted to 70.9 t C ha
–1
, which is much closer to the Dutch
C-stock of 59.0 t C ha
–1
. The overall BEF for Denmark was
0.43 t C m
–3
TSW, which is 10% higher than the Belgian one.
This high Danish BEF confirms the statement of Vesterdal [54]
that Danish wood densities differ from IPCC default factors
because of a lower volume to dry weight ratio.
In our study, shrubs, forest floor vegetation and dead wood
are not considered. In the German study of Baritz and Strich
[4] however, these carbon pools were taken into account. Nabuurs
and Mohren [40] only refer to living biomass, while it is not
clear if foliage and fine roots were included in the work of Milne
and Brown [38]. The fact that some studies consider more com-
partments of the forest ecosystems than other studies, can also
contribute to differences in mean carbon stocks when starting
from the same basic information, being total standing solid
wood volume. And even this last concept should be handled
with some caution, as the definition of “total solid wood” is not
always the same [14, 16].
From our study, it cannot be concluded unambiguously if
using formula (1) (with BEF1 and BEF2) always gives lower
or higher C-stock values than formula (2) (with only BEF3),
as ratios were both higher and lower than 100% for the five
(groups of) species studied (Tab. VI). As it is advised by the
IPCC [25] to use species-specific BEF values, it seems appro-
priate to apply formula (2), as for each species, species-specific
BEF3 values are available. However, if one really wants to
know the division between aboveground and belowground bio-
mass, formula (1), and as such, BEF1 and BEF2, has to be used.
From Table III, it can also be seen that in total, 31 species-spe-
cific values for BEF1 were found, compared to only 18 BEF3
values. This could be a reason to prefer to use the first formula,
where the “other coniferous” and the “other deciduous” species
values for BEF2 can be used in these cases where no species-
specific values for this parameter were found. However, one
should always keep in mind that the choice of the formula influ-
ences the final result of the carbon stock assessment.
In general, wood density appeared to introduce the largest
variability in the calculation of the carbon stock. This result
confirms the study of Bascietto and Scarascia-Mugnozza [7],
who found that the major contributor to carbon increment error
was the variability of the wood density measures, and not the
variation in carbon content. In total, we selected 174 wood den-
sity values from the literature. The range of these values was
large, which is due to the geographical dependence of this
parameter [12, 23, 30, 46]. This large range could possibly also
be the consequence of the fact that different methods were
applied to measure the wood density. Information on the meas-
urement method however was only rarely available.
The lower impact factors of the biomass expansion factors
s.s. compared to wood density can be due to the low number
of values found for this category, or to the fact that this expan-
sion factor category is less related to the geographical location
within Belgium than wood density. This last assumption is con-
firmed by the study of Cairns et al. [11], who found no apparent
relation between BEF2 and soil texture, precipitation, temper-
ature or latitudinal class. Species-specific values of BEF3 were
found for all species, which was not the case for BEF1 and
BEF2. Although some sources mention the age-related charac-
ter of these BEFs (e.g. [44, 48, 56]), it was not possible to find
BEF1, BEF2 or BEF3 values for the three age classes of the
distinguished species, because of the explicit conditions
applied in our study. Moreover, the volume and age class for
which the BEFs were established were not communicated in
most cases, a problem also signalled by Van Camp et al. [51].
Generally, the impact factor of the carbon content was only
slightly lower than the IM of the BEFs (Tab. VII). For this car-
bon content category, 46 values were available, compared to
only 29 values for BEF3. So, the range of carbon content
seemed to be less pronounced than the range of BEFs. As it
appeared (Tab. III) that the median CC value for all species
except beech was equal to the default IPCC-value of 50% car-
bon in dry matter [21, 55], it seems appropriate to use this value
for all species.
The results of the second test indicated that improving wood
density assessment by additional measurements is certainly the
most efficient way to improve the C-stock assessment in Bel-
gian forests. This means that in an ideal situation, the wood den-
sity should be measured at the sampling plot level, as this would
eliminate the uncertainty due to the geographical variation of
this parameter. Our results also confirmed the IPCC guidelines
[21], which stated clearly that average default wood density
values can only be used for initial calculations, and that it is
much better to use actual measured average values. However,
the method used to determine the wood density (X-ray densit-
ometry, volumetric-gravimetric method) should be well-described
and harmonised, to eliminate this factor of uncertainty as well.
Simpson [50] emphasised that an exact description of the pro-
cedure followed to determine wood density is indispensable for
a correct application of published values. A similar nationwide
study is going on in Australia, where the aim is to establish a
database with wood density values for all relevant tree species
[23]. In the Australian study, the geographic distribution of
wood densities is taken into account. The relation between the
wood density and the age of the tree is not so clear, as results
from studies are sometimes contradictory to each other [23, 46].
Figure 4. Relation between standing stock (m
3
ha
–1
) and carbon stock
(t C ha
–1
) for Belgium and neighbouring countries; the solid line gives
the C-stock when the overall Belgian BEF s.l. is used.
862 I. Vande Walle et al.
Determination of biomass expansion factors s.s. is a time-
consuming, laborious and destructive activity [19, 57]. There-
fore, the establishment of new BEFs should not have the highest
priority for future forest inventories in Belgium. However,
more detailed investigations on biomass expansion factors s.s.
can undoubtedly contribute to the improvement of the forest
carbon stock assessment for Belgium, as also mentioned by
Van Camp et al. [51].
5. CONCLUSION
In Belgium, data of two regional forest inventories are avail-
able. However, these inventories do not provide biomass or car-
bon stock information. The IPCC guidelines advise to use
species-specific BEFs s.l. to convert information from forest
inventories into carbon stocks. For Belgium, no country-spe-
cific biomass expansion factors s.l. are available. Therefore, we
selected wood densities, biomass expansion factors s.s. and car-
bon content values from the literature, applying specific selec-
tion conditions. Using the selected species-specific expansion
factors, the total carbon stock in the living biomass of the Bel-
gian productive forests was calculated for the year 2000. In a
final analysis, the BEF s.l. category that introduces the largest
variability in the calculation of the C-stocks in the Belgian for-
est biomass was detected.
According to our methodology, the total carbon stock in the
living biomass of the Belgian forests amounted to 60.9 Mt C
in the year 2000, with a minimum value of 42.8 Mt C and a max-
imum value of 83.5 Mt C. Shrubs and dead wood were excluded
from this calculation. The mean value of 101.1 t C ha
–1
for the
Belgian forests was only slightly lower than the value reported
for Germany, and was considerably higher than values for other
neighbouring countries as the Netherlands, France, Ireland and
Great Britain. These differences were on the one hand due to
a different standing stock volume, and on the other hand to
another overall BEF s.l.
From our analysis, it was not possible to conclude if using
two biomass expansion factors s.s. (BEF1 and BEF2) results
systematically in a higher or lower C-stock value than when
only one expansion factor s.s. (BEF3) is applied. The IPCC
guidelines recommend the use of species-specific values
instead of more general ones when possible. As such, it is rec-
ommended to use formula (2). When one specifically wants to
know the partitioning of the carbon stock over the above- and
the belowground biomass compartments in detail, two separate
BEFs should of course be used.
From a second test, it became clear that wood density intro-
duces the largest variability in the C-stock calculations. There-
fore, more research is needed concerning this BEF s.l. category.
Ideally, the wood density should be measured at plot level in
the regional forest inventories, by a well-described and harmo-
nised method.
The exact definition of reported biomass expansion factors
s.s. was sometimes missing, or it was not clear if the foliage
was included in the BEFs. These values were not selected for
our calculations. A more exact and complete description of bio-
mass expansion factors s.s. is therefore strongly recommended.
The determination of biomass expansion factors s.s. is a labo-
rious and time-consuming activity. Therefore, the establish-
ment of new BEF values is not of the highest priority for the
assessment of the C-stock in Belgian forests. Detailed studies
however, could help to reduce the uncertainty related to this
type of biomass expansion factor.
The impact factor of the carbon content on the C-stock
assessment was higher for coniferous than for deciduous spe-
cies. As the median value for all species (except beech) was
equal to the IPCC default value of 50% carbon in dry mass, we
propose to use this value for future carbon stock calculations.
Acknowledgements: The authors are participating in two research
projects, CASTEC and METAGE, financed under the SPSD II, Global
Change and Sustainable Development programme of the Belgian Fed-
eral Science Policy Office. The authors acknowledge helpful discus-
sions with Martine Waterinckx (AMINAL, Afdeling Bos & Groen),
Hugues Lecomte and Christian Laurent (DGRNE, Division de la
Nature et des Forêts), in charge of the Standing Forest Inventory. The
input of foreign experts concerning the carbon stock in the biomass
of forests in neighbouring countries is also gratefully appreciated.
REFERENCES
[1] Afdeling Bos & Groen (AB&G), De bosinventarisatie van het
Vlaamse Gewest. Resultaten van de eerste inventarisatie 1997–
2000, Ministry of the Flemish Community, 2001 (in Dutch).
[2] Afdeling Bos & Groen (AB&G), Boskartering 2004, available at
/>frmsetbos.htm [16/12/2004].
[3] Afdeling Bos & Groen (AB&G), Bosreservaten 2004, available at
/>frmsetbos.htm [16/12/2004].
[4] Baritz R., Strich S., Forests and the National Greenhouse Gas
Inventory of Germany, Biotechnol. Agron. Soc. Environ. 4 (2000)
267–271.
[5] Bartelink H.H., Allometric relationships on biomass and needle
area of Douglas-fir, For. Ecol. Manage. 86 (1996) 193–203.
[6] Bartelink H.H., Allometric relationships for biomass and leaf area
of beech (Fagus sylvatica L.), Ann. Sci. For. 54 (1997) 39–50.
[7] Bascietto M., Scarascia-Mugnozza G., A collection of functions to
determine annual tree carbon increment via stem-analysis, Ann.
For. Sci. 61 (2004) 597–602.
[8] Bolin B., Sukumar R., Global perspective, in: Watson R.T., Noble
I.R., Bolin B., Ravindranath N.H., Verardo D.J., Dokken D.J.
(Eds.), Land use, land-use change and forestry. A special report of
the IPCC, Cambridge University Press, Cambridge, 2000, pp. 23–51.
[9] Brown S., Measuring carbon in forests: current status and future
challenges, Environ. Pollut. 116 (2002) 363–372.
[10] Byrne K.A., Perks M., Possibilities for carbon sequestration in Irish
forests, Biotechnol. Agron. Soc. Environ. 4 (2000) 300–302.
[11] Cairns M.A., Brown S., Helmer E.H., Baumgardner G.A., Root
biomass allocation in the world’s upland forests, Oecologia 111
(1997) 1–11.
[12] Coomes D.A., Allen R.B., Scott N.A., Goulding C., Beets P., Desi-
gning systems to monitor carbon stocks in forests and shrublands,
For. Ecol. Manage. 164 (2002) 89–108.
[13] COST-E21, Questionnaire about carbon stocks inventory methods
in the forest/wood products sector. COST-E21 Working Group 1,
evaluation and improvement of inventory/accounting systems of
Carbon stock in Belgian forests 863
carbon pools and fluxes in forests, 2001, available at http://
www.bib.fsagx.ac.be/coste21/info/plan/wg1-questionnaire.html
[16/12/2004].
[14] Dagnelie P., Palm R., Rondeux J., Thill A., Tables de cubage des
arbres et des peuplements forestiers, Presses agronomiques de
Gembloux, 2
e
éd. 1999.
[15] Dieter M., Elsasser P., Carbon stocks and carbon stock changes in
the tree biomass of Germany’s forests, Forstw. Cbl. 121 (2002)
195–210.
[16] FAO, Forest Resources of Europe, CIS, North America, Australia,
Japan and New Zealand (industrialized temperate/boreal coun-
tries). UN-ECE/FAO Contribution to the Global Forest Resources
Assessment 2000, Main report, Rome, Timber and Forest Study
Papers, No. 17, United Nations Economic Commission for Europe
(Geneva), Food and Agricultural Organization of the United
Nations, 2000.
[17] Gallagher G., Hendrick E., Byrne K.A., Preliminary estimates of
biomass carbon stock changes in managed forests in the Republic
of Ireland over the period 1990–2000, Irish Forestry 61 (2004) 35–49.
[18] Gracia C., Sabaté S., Report of the COST E21 WG 1 Expert mee-
ting on Biomass Expansion Factors (BEF), Besalú, COST E21,
WG1-biomass Workshop, 2002, available at .
fsagx.ac.be/COSTE21/ [16/12/2004].
[19] Grote R., Foliage and branch biomass estimation of coniferous and
deciduous tree species, Silva Fenn. 36 (2002) 779–788.
[20] Guilley E., Hervé J C., Huber F., Nepveu G., Modelling variability
of within-ring density components in Quercus petraea Liebl. with
mixed-effect models and simulating the influence of contrasting sil-
vicultures on wood density, Ann. For. Sci. 56 (1999) 449–458.
[21] Houghton J.T., Meira Filho L.G., Lim B., Tréanton K., Mamaty I.,
Bonduki Y., Griggs D.J., Callander B.A., Greenhouse Gas Inven-
tory Reference Manual / Vol. 3 of the Revised IPCC Guidelines for
National Greenhouse Gas Inventories, Chap. 5 (LUCF), 1997.
[22] IFN, National Forest Inventory Web site of France, 2004, available
at [22/10/2004].
[23] Ilic J., Boland D., McDonald M., Downes G., Blackmore P., Wood
density phase 1 – state of knowledge, Australian Greenhouse
Office, CSIRO Forestry and Forest Products, National Carbon
Accounting System – Technical Report No.18, 2000.
[24] IPCC, Climate Change 2001: The Scientific Basis. Contribution of
Working Group I to the Third Assessment Report of the IPCC,
Cambridge University Press, Cambridge, 2001.
[25] IPCC, Good Practice Guidance for land use, land-use change and
forestry, IPCC National Greenhouse Gas Inventories Programme,
IGES (Eds.), 2003, available at
[16/12/2004].
[26] Jalkanen A., Mäkipää R., Ståhl G., Lehtonen A., Petersson H., Esti-
mation of the biomass stock of trees in Sweden: comparison of bio-
mass equations and age-dependent biomass expansion factors,
Ann. For. Sci. 62 (2005) 845–851.
[27] Janssens I.A., Sampson D.A., Cermak J., Meiresonne L., Riguzzi
F., Overloop S., Ceulemans R., Above- and belowground phyto-
mass and carbon storage in a Belgian Scots pine stand, Ann. For.
Sci. 56 (1999) 81–90.
[28] Joosten R., Schulte A., Possible effects of altered growth behaviour
of Norway spruce (Picea abies) on carbon accounting, Climatic
Change 55 (2002) 115–129.
[29] Joosten R., Schumacher J., Wirth C., Schulte A., Evaluating tree
carbon predictions for beech (Fagus sylvatica L.) in western Ger-
many, For. Ecol. Manage. 189 (2004) 87–96.
[30] Ketterings Q.M., Coe R., van Noordwijk M., Ambagau Y., Palm
C.A., Reducing uncertainty in the use of allometric biomass equa-
tions for predicting above-ground tree biomass in mixed secondary
forests, For. Ecol. Manage. 146 (2001) 199–209.
[31] Laitat E., Karjalainen T., Lousteau D., Lindner M., Towards an
integrated scientific approach for carbon accounting in forestry,
Biotechnol. Agron. Soc. Environ. 4 (2000) 241–251.
[32] Lebaube S., Le Goff N., Ottorini J.M., Granier A., Carbon balance
and tree growth in a Fagus sylvatica stand, Ann. For. Sci. 57 (2000)
49–61.
[33] Lecomte H., Rondeux J., L’inventaire forestier régional wallon :
brève présentation méthodologique, Silva Belgica 101 (1994) 9–16.
[34] Lefèvre F., Laitat E., Medlyn B., Aubinet M., Longdoz B., Carbon
pools and annual carbon fluxes in the beech forest sub-plot at the
Vielsalm pilot station, in: Ceulemans R.J.M., Veroustraete F.,
Gond V., Van Rensbergen J.B.H.F. (Eds.), Forest ecosystem
modelling, upscaling and remote sensing, SPB Academic
Publishing bv., The Hague, 2000, pp. 137–153.
[35] Lehtonen A., Mäkipää R., Heikkinen J., Sievänen R., Liski J., Bio-
mass expansion factors (BEFs) for Scots pine, Norway spruce and
birch according to stand age for boreal forests, For. Ecol. Manage.
188 (2004) 211–224.
[36] Levy P.E., Hale S.E., Nicoll B.C., Biomass expansion factors and
root:shoot ratios for coniferous tree species in Great Britain, Fores-
try 77 (2004) 421–430.
[37] Löwe H., Seufert G., Raes G., Comparison of methods used within
Member States for estimating CO
2
emissions and sinks according
to UNFCCC and EU Monitoring Mechanisms: forest and other
wooded land, Biotechnol. Agron. Soc. Environ. 4 (2000) 315–319.
[38] Milne R., Brown T.A., Carbon in the vegetation and soils of Great
Britain, J. Environ. Manage. 49 (1997) 413–433.
[39] Mund M., Kummetz E., Hein M., Bauer G.A., Schulze E D.,
Growth and carbon stocks of a spruce forest chronosequence in
central Europe, For. Ecol. Manage. 171 (2002) 275–296.
[40] Nabuurs G.J., Mohren G.M.J., Carbon in Dutch forest ecosystems,
Neth. J. Agr. Sci. 41 (1993) 309–326.
[41] Nabuurs G.J., Mohren F., Dolman H., Monitoring and reporting
carbon stocks and fluxes in Dutch forests, Biotechnol. Agron. Soc.
Environ. 4 (2000) 308–310.
[42] Perrin D., Temmerman M., Laitat E., Calculation on the impacts of
forestation, afforestation and reforestation on the C-sequestration
potential in Belgian forests ecosystems, Biotechnol. Agron. Soc.
Environ. 4 (2000) 259–262.
[43] Pignard G., Dupouey J.L., Arrouays D., Loustau D., Carbon stocks
estimates for French forests, Biotechnol. Agron. Soc. Environ. 4
(2000) 285–289.
[44] Ponette Q., Ranger J., Ottorini J M., Ulrich E., Aboveground bio-
mass and nutrient content of five Douglas-fir stands in France, For.
Ecol. Manage. 142 (2001) 109–127.
[45] Pontailler J.Y., Ceulemans R., Guittet J., Mau F., Linear and non-
linear functions of volume index to estimate woody biomass in high
density young poplar stands, Ann. Sci. For. 54 (1997) 335–345.
[46] Porté A., Trichet P., Bert D., Loustau D., Allometric relationships
for branch and tree woody biomass of Maritime pine (Pinus pinas-
ter Aït.), For. Ecol. Manage. 158 (2002) 71–83.
[47] Schalck J., Lejeune J., Stevens M., Dichtheid en lignificatie van het
houtweefsel bij nieuwe hybriden in een populieren ecosysteem.
Puyenbroeck populieren ecosysteem project, rapport nr. 6. Rijksu-
niversiteit Gent, Universitaire instelling Antwerpen, Vrije Univer-
siteit Brussel, report to the “Fonds voor kollektief fundamenteel
onderzoek”, 1978.
864 I. Vande Walle et al.
[48] Schroeder P., Brown S., Mo J., Birdsey R., Cieszewski C., Biomass
estimation for temperate broadleaf forests of the United States
using inventory data, For. Sci. 43 (1997) 424–434.
[49] Schulze E D., Valentini R., Sanz M J., The long way from Kyoto
to Marrakesh: implications of the Kyoto Protocol negotiations for
global ecology, Glob. Change Biol. 8 (2002) 505–518.
[50] Simpson W., Specific gravity, moisture content and density rela-
tionship for wood, USDA, For. Serv., Forest Products Laboratory,
Gen. Tech. Rep. FPL-GTR-76, 1993.
[51] Van Camp N., Vande Walle I., Mertens J., De Neve S., Samson R.,
Lust N., Lemeur R., Boeckx P., Lootens P., Beheydt D., Mestdagh
I., Sleutel S., Verbeeck H., Van Cleemput O., Hofman G., Carlier
L., Inventory-based carbon stock of Flemish forests: a comparison
of European biomass expansion factors, Ann. For. Sci. 61 (2004)
677–682.
[52] Vande Walle I., Lemeur R. (Eds.), Biogeochemical cycles of Bel-
gian forest ecosystems related to Global Change and sustainable
development, Final report to the OSTC/DWTC, contract CG/DD/
05, 2001.
[53] Vande Walle I., Mussche S., Samson R., Lust N., Lemeur R., The
above- and belowground carbon pools of two mixed deciduous
forest stands located in East-Flanders (Belgium), Ann. For. Sci. 58
(2001) 507–517.
[54] Vesterdal L., Carbon sequestration in Danish forests, Biotechnol.
Agron. Soc. Environ. 4 (2000) 272–274.
[55] Watson R.T., Noble I., Bolin B., Ravindranath N.H., Verardo D.J.,
Dokken D.J. (Eds.), Land use, land-use change and forestry, A spe-
cial report by the IPCC, Cambridge University Press, Cambridge,
2000.
[56] Wirth C., Schumacher J., Schulze E D., Generic biomass functions
for Norway spruce in Central Europe – a meta-analysis approach
toward prediction and uncertainty estimation, Tree Physiol. 24
(2004) 121–139.
[57] Zianis D., Mencuccini M., On simplifying allometric analyses of
forest biomass, For. Ecol. Manage. 187 (2004) 311–332.
To access this journal online:
www.edpsciences.org