Báo cáo lâm nghiệp: "A comparison of two modelling studies of environmental effects on forest carbon stocks across Europe" ppsx
Bạn đang xem bản rút gọn của tài liệu. Xem và tải ngay bản đầy đủ của tài liệu tại đây (1.65 MB, 13 trang )
911
Ann. For. Sci. 62 (2005) 911–923
© INRA, EDP Sciences, 2005
DOI: 10.1051/forest:2005082
Original article
A comparison of two modelling studies of environmental effects
on forest carbon stocks across Europe
Ronnie MILNE*, Marcel VAN OIJEN
Centre for Ecology & Hydrology, Bush Estate, Penicuik, Midlothian, EH26 0QB, United Kingdom
(Received 13 April 2004; accepted 15 April 2005)
Abstract – Two modelling approaches to describing the variation in the carbon balance of forests in different parts of Europe are presented. A
forest growth model (Eurobiota) was parameterised for 3 eco-climatic zones. The parameter values were derived from process-based forest
growth models developed to describe the situation at forest locations within each zone. The model was separately run for conifers and
broadleaves on a 30’ grid across Europe. Daily climate data covering the period from 1830 to the present and then projected to 2100 were used.
European forests were shown to be a net sink of carbon of 0.06 Pg y
–1
at present. The Boreal and Temperate zones are likely to continue at their
present rate or more for the next century but the net sink in the Mediterranean zone may become smaller due to projected drier conditions. The
effect of temperature using the surrogate of latitude on net ecosystem productivity is also discussed. A complex forest growth model (EFM)
was parameterised for Norway spruce and Scots pine, and tested against measurements from 22 forest locations across Europe. This second
model showed that the main driver of increased forest growth in the 20th century has been increased nitrogen deposition, rather than increased
[CO
2
] or climate change, as indicated by EuroBiota. Increased growth has led to increased carbon storage in the system, but most of it in tree
biomass rather than stably sequestered in recalcitrant soil organic matter. Carbon stocks were increased more in Central Europe than in
Scandinavia, except for some high-fertility sites where N-deposition had little impact. The EFM model was also used to predict the effects of
future environmental change, and suggested that climate change and [CO
2
] may become the dominant environmental drivers for forest carbon
exchange. The two models thus give similar results when considering only climate change and [CO
2
] but EFM can in addition describe the
effects of N-deposition when appropriate.
European forests / carbon balance / modelling / climate change
Résumé – Comparer les impacts de facteurs environnementaux sur les stocks de carbone des forêts européennes : deux exercices de
modélisation. Cette étude présente deux approches de modélisation permettant de décrire la variabilité du bilan de carbone des forêts
européennes. En premier lieu, le modèle de croissance d’arbres, Eurobiota, fut paramétré pour trois zones éco-climatiques différentes. Les
valeurs des paramètres furent dérivées de modèles basés sur les processus simulant la croissance d’arbres dans chacune ces zones. Le modèle
fut exécuté séparément pour les conifères et les feuillus, sur une grille de modélisation de 30’ à travers l’Europe. Une base de données climatique
à échelle quotidienne fut utilisée, couvrant une période de 1830 jusqu’à maintenant, et projetée jusqu’en 2100. Cet exercice de modélisation
démontre que les forêts européennes actuelles représentent un puits de carbone de 0.06 Pg an
–1
. Dans les zones boréales et tempérées, il est
probable que ce taux d’accumulation demeure ainsi mais pourrait aussi s’accroître au siècle prochain. Cependant, dû aux conditions climatiques
prévues plus arides, le puits net méditerranéen pourrait décroître. Une discussion sur les effets occasionnés par la substitution de la température
par la latitude pour simuler la productivité nette est aussi présentée. En second lieu, un modèle complexe basé sur les processus (EFM) fut
paramétré pour l’épicéa (Norway spruce) et le pin sylvestre (Scots pine) et testé à partir de données en provenance de 22 forêts européennes.
Ce dernier modèle démontre qu’au
XX
e
siècle, le dépôt d’azote plutôt que les changements climatiques ou l’accroissement de CO
2
, tel que
suggéré par Eurobiota, détermine principalement l’augmentation du taux de croissance des forêts. De plus, cette augmentation conduit à une
accumulation de carbone dans le système se retrouvant principalement dans la biomasse des arbres plutôt que de manière stable dans la matière
organique récalcitrante du sol. Les stocks de carbone de l’Europe centrale s’accroissent plus que ceux de Scandinavie, à l’exception des sites
scandinaves hautement fertiles, où le dépôt d’azote influence peu la croissance. EFM fut aussi exécuté afin de prédire les impacts des
changements climatiques futurs sur les échanges de carbone. Celui-ci indique que dans le futur, ce sont les changements climatiques ainsi que
le CO
2
qui risquent de devenir les principaux facteurs déterminant de ces échanges. Les deux modèles démontrent des résultats similaires en ce
qui a trait aux changements climatiques et au CO
2
. Cependant, EFM permet également de décrire l’influence du dépôt d’azote.
forêts européennes / bilan de carbone / modélisation / changement climatique
1. INTRODUCTION
Assessing the effect of climatic and environmental variables
on forest growth and hence carbon exchange can be approached
in a number of ways. Penman et al. [14] have described methods
for preparing annual inventories of changes in stocks of carbon
in forests in the context of the UN Framework Convention on
Climate Change (UNFCCC). In their guidance they presented
* Corresponding author:
Article published by EDP Sciences and available at or />912 R. Milne, M. Van Oijen
approaches that were labelled as Tier 1 to Tier 3. Tiers 1 and 2
are methods that are based on forest volume statistics converted
to carbon stocks using biomass expansion factors. Jalkanen et al.
[6] in this issue discuss estimation of these factors for Sweden.
Tier 3 methods as defined by Penman et al. [14] include process
based models of forest growth. Such mathematical models of
growth capture our understanding of how the carbon cycle
operates but for the output from models to be believable they
must be based on good field data. Here we describe two differ-
ent approaches using data for Europe.
In the first approach an ecosystem model with little com-
plexity is parameterized i.e. the value of its parameters are cho-
sen, from the parameters of site specific growth models from
a range of geographical locations. These site-specific models
had previously been optimized to describe forest growth for its
location. The ecosystem model is then used to describe the
effect of temperature and carbon dioxide variation in time and
space on forest growth and carbon exchange throughout Europe
at multiple locations on a grid. Forest area and age structure
from industry data were combined with the basic ecosystem
model to provide country and regional totals for carbon
exchange. Further information on the site-specific models and
a comparison with other approaches using other ecosystem
models are given by Kramer and Mohren [9].
In the second approach a complex forest growth model was
directly parameterised for 22 specific locations in Europe. This
model included the effect of many more variables e.g. nitrogen
deposition, than the ecosystem model which allowed a more
detailed assessment of the relative importance of the variables
and of source of uncertainty.
Characteristics of the two models are compared in Table I.
2. CASE STUDY 1: THE EUROBIOTA FOREST
SYSTEM MODEL
2.1. The model
The EuroBiota forest ecosystem model primarily describes
the effect of changing temperature and atmospheric carbon
dioxide concentration on productivity. The model is based on
the work of Wang and Polglase [21]. They described the struc-
ture of a carbon cycle model in some detail and presented results
of applying it to uniform age forest with characteristics and cli-
mate appropriate to three different biomes. Their treatment of
soil respiration used the method of Jenkinson [7] within which
turnover is influenced by three variables: temperature, soil
moisture and cation exchange capacity of the soil. Wang and
Polglase [21] assumed all areas of each biome had the same cli-
mate, plant and soil conditions but here we wish to consider
how geographical variation of these conditions influences the
carbon cycle. Additionally their model did not take into account
spatial or temporal variation in soil moisture. The model con-
cepts of Wang and Polglase [21] were therefore developed fur-
ther to construct EuroBiota within which the influence of
geographical variation in weather, the coverage of evergreen
and deciduous forest at different locations and time series of
afforestation is explicitly taken into account. The soil water bal-
ance was calculated on a daily time step using a two-layer
model based upon the four-root-layer model of Ragab et al.
[15]. Two links between carbon and moisture were written into
Eurobiota. Soil moisture from the water balance model was
used as an influence on soil carbon turnover in the carbon cycle
model and canopy conductance from the carbon modelled con-
trolled forest transpiration in the water model.
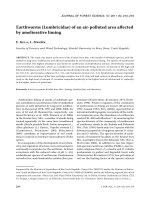
The overall structure of EuroBiota model is shown in Figure 1a
and the carbon pools and fluxes in more detail in Figure 1b.
The model has 7 state variables for carbon and about 40 param-
eters.
For application to European forests the model was run for
each of about 4000 land locations on a 0.5° × 0.5° grid across
the region. The input data for each cell or groups of cells were
used as follows. The basic scale of application for the model
was for each 0.5° × 0.5° latitude by longitude grid cell covering
land in Europe between 34° N, 25° W to about 72.5° N, 36° E.
A baseline daily pattern of weather was developed from the
mean monthly climatology of the Climate Research Unit for the
period 1961 to 1990 and the daily weather generator of Friend
et al. [4]. This daily pattern has maximum and minimum air
temperature, water vapour pressure deficit, solar radiation and
precipitation and was assumed to apply for each year from 1860
to 2100.
The effect of changing air temperature was described using
a version of the data of the analysis of HADCM2 GCM output
(at decadal scale) and CRU 1901–1995 climate data gridded to
the 0.5° cell size required by EuroBiota. This gave monthly
temperature anomalies for each cell for each year from 1830 to
2100 with reference to the 1961 to 1990 baseline weather pattern.
Changes in carbon dioxide concentration throughout Europe
followed the IS92a emission scenario and are as estimated by
University of Bern for the IPCC Second Assessment Report.
Table I. Comparison of methodology and complexity of EFM and
Biota models.
EFM Biota
Model type Deterministic,
non-spatial, pool-based
Deterministic, spatial,
pool-based
No. State variables 50 7
No. Parameters 261 40
Time step < hourly daily
Input variables CO
2
, Radiation, T
max
,
T
min
, Rain, RH, wind,
N-deposition
CO
2
, Radiation, T
max
,
T
min
, Rain, vpd
Ecosystem fluxes C, N, water C, water
C-input submodel NPP = Photosynthesis
– Respiration
NPP = Photosynthesis
– Respiration
No. Tree C pools 10 3
No. Tree N pools 10 0
No. Soil pools
(C, N, SOM, microbes)
10 4
No. Surface litter pools 3 0
Modelling European forest carbon stocks 913
The location and area of forests were estimated from the
USGS/IGBP-DIS Global Land Cover Characteristics 1 km
scale data projected to latitude/longitude and gridded into 0.5
o
× 0.5
o
cells. Conifer and deciduous forests are distinguished.
Bio-Climatic zones (Boreal, Temperate and Mediterranean)
were also defined.
For each Bio-Climatic zone the physiological parameters
relevant to European evergreen and deciduous forests were
selected from the results from LTEEF II process-based models
(Gotilwa, Hydrall, Forgro etc.) and from the ECOCRAFT
Database [10]. Appropriate soil characteristics (clay content,
rooting and overall depth) for each zone were chosen from the
Global Environment Database [22]. For each country the age
structure of forests was taken from the EFISCEN database and
model. International boundaries were taken from ESRI Arc-
world.
EuroBiota was run for European forests in 3 stages. (1) The
carbon pools were initialised with effectively zero value and
1860 weather and carbon dioxide conditions assumed for each
subsequent year and the model run to equilibrium carbon
stocks. (2) Using these equilibrium tree and soil carbon stocks
as new starting values the model was rerun with changing tem-
perature and carbon dioxide for the years from 1860 to 2100.
(3) To assess the effect on productivity of the different age
structure in different countries, and for times in the future, this
transient run was recalculated, but in each country all forests
had a simulated felling and replanting in the year indicated by
the average age of forest for the year under consideration. The
average of forest age for each country was calculated from the
distribution of ages used in the EFISCEN model. For 1990 the
EFISCEN base data was used and for later years the age dis-
tribution predicted by the Business As Usual Scenario was
taken. This felling and replanting was modelled by removing
in the appropriate year all stem carbon from the model and
transferring leaf and root carbon to the litter pools. The forest
was then forced to re-establish. The result of this approach is
that productivities will be different in different countries, not
only due to local weather conditions, but also due to the stage
of recovery that the model forest has reached since the simu-
lated felling/regrowth.
Here we describe results from this model when driven by ris-
ing atmospheric CO
2
values and the pattern of change from
1860 to 2099 in mean monthly temperature for each 0.5
o
× 0.5
o
cell in Europe. Carbon stocks in trees and soils are discussed
as well as net primary productivity (NPP), soil respiration (Rs)
and net ecosystem productivity (NEP) for individual countries,
boreal, temperate and Mediterranean eco-climatic zones and
Europe as a whole.
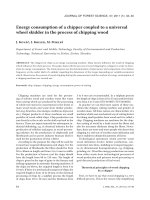
The carbon dioxide concentrations and the average annual
temperature anomaly for Europe, implied by the GCM data
used to drive EuroBiota, are shown in Figure 2. Temperature
anomalies are actually applied in EuroBiota to the mean 1961
to 1990 daily climatology for each month in each separate 0.5°
cell separately. An illustration of the climatology is given in
Figure 3 for a representative cell for each of the boreal, tem-
perate and Mediterranean eco-climatic zones.
Figure 1. (a) Structure of the EuroBiota model showing links between carbon and water sub-models. P is photosynthesis, S
R
is solar radiation,
T is temperature, θ is soil moisture content, CEC is cation exchange capacity of soil, g is canopy conductance, T
C
is transpiration, A is net
radiation. (b) Carbon pools and flows in the EuroBiota model. Pn is the net primary productivity. The seven other blocks represent the stock
of carbon in leaves, stems, roots, recalcitrant plant matter (RPM) and decomposable plant matter (DPM) in litter or soil, biological (BIO) and
humic (HUM) material in the soil. The litter and soil carbon pools are as defined by Jenkinson [7].
(a)
(b)
914 R. Milne, M. Van Oijen
Figure 2. Mean European, boreal, temperate
and Mediterranean average annual temperature
anomaly (relative to 1961 to 1990 average) and
variation in atmospheric CO
2
concentration
from EuroBiota input climate data. Legend text
refers to ‘Eu’ – Europe, ‘Med’ – Mediterranean
zone, ‘Tmp’ - Temperate zone, ‘Bor’ – Boreal
zone, “Temp” – Temperature.
Figure 3. Mean 1960 to 1989 climatology of cells representative of boreal (Lat 66.0°, Long. 19.0°), Temperate (Lat. 48.0°, Long. 13.0°), Medi-
terranean (Lat. 38.0°, Long. –4.0°).
Modelling European forest carbon stocks 915
2.2. EuroBiota results
The productivity of the forests of each eco-climatic zone
(boreal, temperate, Mediterranean) of Europe as estimated by
the EuroBiota model are presented in Figure 4 for Net Primary
Productivity (NPP) and Soil Respiration (Rs) and Figure 5 for
Net Ecosystem Productivity (NEP). The weighted averages for
all of Europe are also shown.
The estimates of NEP (Fig. 5) show an overall increase in
carbon uptake rate per unit area by European forest in the period
from 1990 to 2050. This overall increase is however predom-
inantly due to increases in the boreal zone whilst forests in both
the temperate and Mediterranean zones have been estimated to
have a reducing uptake rate per area of carbon. The contribution
of changes in NPP and Rs in the different zones to the NEP
changes is better shown in Table II. We can see that in the boreal
zone NPP increases more than Rs which results in the increase
in NEP of Figure 5, in the temperate zone an increase in NPP
is offset by a larger increase in Rs and in the Mediterranean zone
a fairly large increase in NPP is heavily offset by the increase
in Rs producing the large reduction in NEP.
These changes are likely to be due to the relative response
to differing changes of temperature in the trees and soils of the
three zones. In the Mediterranean zone the increase in temper-
ature has caused a relatively greater increase in turnover of soil
carbon compared to other zones and to the increase in produc-
tivity. It should be noted here that the soil carbon turnover
model in EuroBiota has four separate compartments each with
individual rate constants (ranging from days to many decades)
that depend on temperature. It is therefore not influenced by
problems associated with assumption in some other studies
where a single soil carbon component has the effect of temperature
on the rate for carbon turnover determined by short-term exper-
iments.
Figure 4. Productivity of European forest ecosystems from EuroBiota model for decades from the 1990s to the 2050s (abbreviations in legend
text as in Fig. 2 and Tab. II).
Figure 5. Net Ecosystem Productivity from EuroBiota model for European eco-climatic zones (abbreviations in legend text as in Fig. 2 and
Tab. II).
916 R. Milne, M. Van Oijen
The overall change in the stock of tree and soil carbon per
unit area in the period 1990 to 2050 as predicted by EuroBiota
is shown in Table III, assuming a fixed forest area intermediate
in the range of forest areas available from different sources as
described in Kramer and Mohren [9].
As the grid cell size (0.5
o
) is sufficiently small it was pos-
sibly to summarise the outputs of EuroBiota in terms of most
European countries (except for a few cases where the country
was too small or the model had computational problems). These
data are presented in Table IV and mapped in Figure 6.
The country data can also be used to show the effect of lat-
itude on productivity. For a subset of the countries in Table IV
the mean net ecosystem productivity of the cells falling within
Their Boundaries In 1990 Was Calculated. These Values Are
Plotted against the latitude of the centroid of the country in Fig-
ure 7. NEP becomes less at higher latitude but the effect is con-
fused by the effect of the different age structure of the forests
in each country. An estimate of relative productivity without
the effect of age structure across Europe in 1990 can be obtained
by using the output from EuroBiota at stage 1 of the sequence
described above. These data describe the carbon flows in even
aged coniferous and deciduous forests having grown to equi-
librium in the climate since 1860. The data for this situation is
shown for Net Ecosystem Productivity and Net Primary Pro-
ductivity is presented in Figure 8.
2.3. EuroBiota case study: Summary
The calculations of EuroBiota show the broad trend in pro-
ductivity across Europe at different periods. The simplicity of
the model precludes much detailed analysis of the relative
importance of different environmental variables on productivity.
Changes with time only take into account changes in temperature
Table II. Changes predicted by EuroBiota in forest Net primary productivity (NPP), soil respiration (Rs) and Net Ecosystem Productivity
(NEP) between 1990 and 2050 in each of the three European eco-climatic zones compared to the European average (“Eu” – Europe, “Bor” –
Boreal, “Tmp” – Temperate, “Med” – Mediterranean).
MgC ha
–1
y
–1
EuNPP EuRs BorNPP BorRs TmpNPP TmpRs MedNPP MedRs
1990 6.06 –5.52 6.76 –6.19 3.53 –3.18 5.50 –4.75
2050 6.41 –5.86 7.14 –6.55 3.74 –3.41 5.84 –5.19
Change in NPP or Rs 0.35 –0.33 0.38 –0.35 0.21 –0.23 0.34 –0.44
Change in NEP 0.01 0.03 –0.02 –0.10
Table III. Future changes in total carbon stock, Net primary produc-
tivity (NPP), soil respiration (Rs) and Net Ecosystem Productivity
(NEP) in European ecosystems as predicted by EuroBiota. Forest
area unchanged.
1990 2050
Forest area (km
2
) 1 250 000 1 250 000
Tree carbon stock (TgC) 17.6 18.7
Soil carbon stock (TgC) 16.0 16.6
NPP (TgC y
–1
)0.760.80
NEP (TgC y
–1
)0.070.07
Rs (TgC y
–1
) –0.69 –0.73
Table IV. Future change in Net Ecosystem productivity (NEP) of
forest ecosystems in European countries as estimated by EuroBiota.
These estimates are of MgC ha
–1
y
–1
and hence do not include
effects of expansion in forest area but do include the effect of chan-
ging age structure as predicted in the EFISCEN “Business as Usual”
scenario.
Flux MgC ha
–1
y
–1
NEP 1990 NEP 2050 Change
Albania 1.39 0.81 –0.58
Austria 0.08 0.14 0.07
Belgium 0.74 0.82 0.08
Bosnia 0.14 0.20 0.06
Bulgaria 0.12 0.17 0.05
Belarus 0.04 0.12 0.08
Croatia 1.12 0.81 –0.31
Czech Republic 0.66 0.50 –0.16
Denmark 0.70 0.45 –0.25
Estonia 0.21 0.27 0.06
Finland 1.05 1.13 0.08
France 0.80 0.90 0.10
Germany 0.55 0.47 –0.08
Greece 0.17 0.20 0.04
Hungary 1.05 0.74 –0.32
Iceland 0.17 0.24 0.08
Ireland 0.49 0.30 –0.19
Italy 1.27 0.95 –0.32
Latvia 0.13 0.21 0.08
Lithuania 0.10 0.15 0.06
Macedonia 1.35 1.05 –0.30
Netherlands 0.10 0.16 0.07
Norway 0.93 0.92 –0.01
Poland 0.61 0.51 –0.10
Romania 0.86 0.61 –0.25
Russia 0.24 0.24 0.01
Slovakia 0.83 0.67 –0.16
Slovenia 0.73 0.71 –0.03
Spain 0.14 0.25 0.11
Sweden 0.21 0.23 0.02
Switzerland 0.33 0.27 –0.07
Turkey 0.17 0.24 0.08
Ukraine 0.03 0.14 0.12
United Kingdom 0.72 0.50 –0.22
Modelling European forest carbon stocks 917
and carbon dioxide concentration whilst the trend with latitude
for a specific year will be a combination of temperature with
other climate variables. In addition the model does not include
any assessment of the nitrogen cycle or how it has been affected
by nitrogen pollution. In the next section a different model and
approach is described to address some of these issues.
3. CASE STUDY 2: PROJECT RECOGNITION
3.1. The project
Recent studies have shown that many forests across Europe
have started to grow faster during the second half of the 20th
century [16]. The pattern of growth acceleration has not been
homogeneous: sites in Scandinavia showed smaller increases
in growth rate than Central-European sites, but there were some
sites in Germany and Austria where forest growth had not
changed much either [16]. Project RECOGNITION was initi-
ated in 1999 to identify the causes for the observed changes in
forest growth, and to assess whether the growth trends would
continue. Twenty four project partners were involved in
14 countries. Most of the partners focused on collecting and
statistically analysing data on trees, soils and climate, and four
partners studied the problem by means of different process-
based models [8, 11]. Here we focus on the process-based
Figure 6. Net Ecosystem Productivity (NEP) (MgC ha
–1
y
–1
) in 1990 and change predicted by 2050 by EuroBiota model of ecosystem produc-
tivity and EFISCEN ‘Business as Usual’ production scenario. (Countries marked with stippled shading have no data or the forest area data
caused computational difficulties.)
Figure 7. Variation of mean country Net Ecosystem Productivity with
latitude of centroid of country including the effect of different age
structure.
918 R. Milne, M. Van Oijen
modelling, and particularly on the results acquired by means
of the Edinburgh Forest Model (EFM) [17–19], which repre-
sented the biogeochemical fluxes through the forest in greatest
detail. The EFM has 261 parameters and 50 state variables, rep-
resenting tree volume and height as well as pools of water and
various C- and N-containing materials in soil and tree organs.
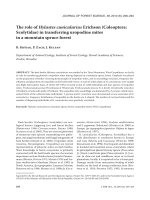
The process-based modelling in RECOGNITION focused
on 22 sites across Europe (Fig. 9), 9 planted to Norway spruce
(Picea abies L.) and 13 to Scots pine (Pinus sylvestris L.) [11].
The twenty-two sites were selected because they represented
important conifer growing areas across Europe, at latitudes
ranging from 48.29 to 67.25 ºN, and because data on growing
conditions were available for the sites. The sites varied in car-
bon content of the top 50 cm of soil from 37 000 to 310 000 kg
C ha
–1
, and in nitrogen content from 1 100 to 10 400 kg N ha
–1
.
Average yearly temperature (1975–1990) ranged from –0.6 ºC
at the most northerly site Kolari (67.15 °N) to 10.0 ºC at three
sites in South-eastern Germany.
Process-based modelling requires input scenarios that
define the time courses of the external conditions that are input
to the models. In RECOGNITION, the scenarios needed to
cover three environmental factors, changes in which had been
put forward as possible causes of the observed acceleration of
forest growth: weather conditions, atmospheric concentration
Figure 8. Variation of mean country
Net Ecosystem Productivity with
latitude of centre of country exclu-
ding the effect of different age struc-
ture. Variation of country mean Net
Primary Productivity is inset.
Figure 9. Sites used in project RECOGNITION for process-based
modelling. Squares: Norway spruce (n = 9), Circles: Scots pine
(n = 13).
Modelling European forest carbon stocks 919
of CO
2
and N-deposition. Two types of scenarios were defined
for each of the 22 sites: “reference scenarios” and “environ-
mental change scenarios” [11]. In simulations using the refer-
ence scenarios, forest growth was simulated for a period of
80 years but with CO
2
and N-deposition kept at the values they
had in 1920, and weather conditions cycling through values for
1920–1927. In contrast, the environmental change scenarios
represented the changes actually observed between 1920 and
2000 in one or more of the environmental factors. Atmospheric
CO
2
concentration increased from 302 to 370 µmol mol
–1
, with
little variation between sites. N-deposition increased from a 22-
site average of 4.2 ± 1.5 (SD across sites) kg N ha
–1
y
–1
in 1920
to an average N-deposition over the whole period 1920–2000
of 10.5 ± 5.2 kg N ha
–1
y
–1
, i.e. an increase of about 150%. Tem-
perature increased 0.52 ± 0.24 ºC from its 1920–1927 reference
level, but other weather variables changed little. Analysis of the
differences in simulated forest growth between reference con-
ditions and environmental change allowed identification of the
major growth-changing factors.
So far, most of the analysis of the results of the process-based
modelling study in RECOGNITION has focused on the iden-
tification of the key environmental drivers, on the comparison
between the four different process-based models, and on compar-
ison between process-based modelling and empirical analysis
[12, 13]. Here, we will analyse the results more deeply, focus-
ing on the results for carbon stocks and biogeochemical
cycling, and on how they may explain the differences between
sites in growth and in growth response to the changing envi-
ronment.
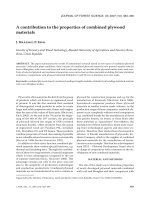
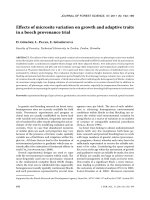
3.2. RECOGNITION: Simulations of changes
in growth and carbon stocks
Simulations using reference scenarios for the environmental
conditions confirmed common observation in that average net
primary productivity over 80 years of forest growth (NPP; t DM
ha
–1
y
–1
) decreased with latitude (Fig. 10, top left panel). The
correlation was well explained by differences between sites in
temperature (affecting both growing season duration and
within-season growth rate) and in soil fertility (Fig. 10, left col-
umn, middle and bottom panel). Both temperature and soil fer-
tility decrease with latitude, the latter partly because of
differences in N-deposition. The simulations using complete
environmental change scenarios (i.e. all of weather, CO
2
and
N-deposition changing as observed between 1920 and 2000)
showed increases in NPP on all 22 sites (Fig. 10, right column,
top right panel) which suggests that the model was able to
explain the observed changes in forest growth rate across
Europe [16]. Like NPP itself, the change in NPP varied with
latitude. NPP increased least at higher latitudes, although some
lower-latitude sites showed little increase in NPP in response
to environmental change (Fig. 10, top right panel). The latitu-
dinal trend in NPP-change and the exceptional response of
some Central European sites were in general agreement with
the observations of Spiecker et al. [16]. The sensitivity of NPP
to changes in the growing environment generally increased
with temperature but decreased with soil fertility (Fig. 10, right
column, middle and bottom panel).
3.3. RECOGNITION: Simulations of changes
in C- and N-cycling
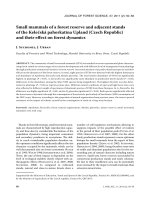
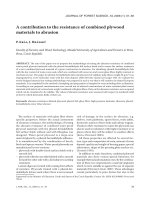
The increase in NPP because of environmental change led
to an increase in carbon stock in tree and soil at the end of the
simulated 80-year growing periods (Fig. 11). The average
increase in end-of-growing-period carbon stock was 4.3 kg C
m
–2
, corresponding to an average sink of 0.54 Mg C ha
–1
y
–1
.
Increased N-deposition was identified as the major environ-
mental factor causing the increase in C-stock (Fig. 11). The car-
bon-sink of tree biomass increased more (0.51 ± 0.33 Mg C ha
–1
y
–1
) than that the soil carbon sink (0.03 ± 0.02 Mg C ha
–1
y
–1
).
The nature of the sink, i.e. tree or soil, is of importance because
tree biomass is removed in the form of forest products whereas
soil carbon may represent a longer-lived sink. We therefore
analysed the simulated effects on the flows of carbon through
the system in more detail (Fig. 12, left column). C-cycling at
reference growing conditions was characterised by an increase
in tree carbon and a decrease in soil carbon during the 80-year
growing period (Fig. 12, top left panel), but note that the sim-
ulations did not account for thinning, and both effects could fur-
ther be negated by subsequent tree felling which would remove
tree carbon and add to soil litter. Environmental change, either
increased N-deposition by itself (Fig. 12, middle left panel) or
all three changes combined (bottom left panel) increased tree
carbon but did not proportionately increase the flow of tree litter
to soil. This result was at first surprising, as litter production
through senescence of leaves, branches and roots is of necessity
dependent on the amount of source material present. However,
further analysis of the model results showed that environmental
change affected carbon allocation in the trees, with especially
increased N-deposition leading to a decrease in the amount of
fine roots of 16–18%. These model results reflect the functional
equilibrium between roots and shoot [1]. So, litter-C production
is not enhanced significantly by environmental change because
the biomass-pool with the highest turnover rate, i.e. fine roots,
is decreased in size. These results emphasize the dangers of
using simple linear carbon cycling in models in which any bio-
mass increase leads to an equivalent increase in all flows
between model components, including carbon-sequestration in
soil. Neither EFM nor EuroBiota model adopts this approach
because each treats the change in soil carbon as a balance
between inputs from the plants and losses due to soil organic
matter turnover.
The environmental effects on C-partitioning emphasise that
changes in the C-cycle are linked to, but not necessarily pro-
portional to, concurrent changes in the N-cycle. The default
values for the major flows in the forest N-cycle, under reference
conditions, are shown in Figure 12 (top right panel). The lower
panels show the response of the N-cycle to increased N-depo-
sition alone and in combination with changes in weather and
CO
2
. In contrast to the C-cycle, environmental change does sig-
nificantly increase the flow of litter-nitrogen from trees to soil.
Taken together, this means that total litter production is not
enhanced much but its quality, i.e. nitrogen content, is. These
results are consistent with the findings of Hendricks et al. [5],
who found fine root nitrogen content to increase markedly with
soil nitrate availability in a study of 27 forests in the northern
United States, and conjectured that this might enhance root
decomposition and nitrogen cycling in the system. The higher
920 R. Milne, M. Van Oijen
litter quality stimulates mineralization (as confirmed recently
by Colin-Belgrand et al. [2]), so N-uptake by the trees is facilitated
as well. In fact, the increase in the rate of N-cycling between
trees and soil is about four times as high as the increase in N-
deposition that triggered it in the first place (Fig. 12, bottom
right panel). In summary, environmental change, particularly
increased N-deposition, triggers accelerated N-cycling between
trees and soil, mediated by production of litter at about normal
rates but of higher quality, thereby sustaining high NPP.
The preceding analysis of the N-cycle suggests that at sites
where the soil-tree N-cycle is already approaching a limit, and
thus cannot be enhanced much further by N-deposition, NPP
and forest C-stock may not respond to even a strong increase
in N-deposition. On such sites, N-leaching is more likely to
increase than growth [3]. Returning to Figure 10, right column,
we saw that environmental change indeed stimulated NPP less
at fertile sites (r
2
= 0.40). More importantly, soil fertility was
a better predictor of response to environmental change, than
Figure 10. Simulation results from the
Edinburgh Forest Model: NPP at
22 sites. Left column: NPP (t DM ha
–1
y
–1
);
right column: changes in NPP (%). The
lines are linear regression lines of simu-
lation results on site-variables: latitude,
average yearly temperature (1975–1990)
and soil N-content.
Modelling European forest carbon stocks 921
absolute or relative increase in N-deposition itself (r
2
= 0.21;
r
2
= 0.25), even though N-deposition was the major factor of
environmental change (Fig. 11).
3.4. RECOGNITION: Summary
The simulations confirm the results of Spiecker et al. [16]
in various ways: the growth enhancement itself, the less-
increased growth at high latitudes because of lower tempera-
tures and lower rates of N-deposition, and the small increase
at some more southerly sites because of N-saturation. The sim-
ulations suggested that the growth enhancement of European
forests may not lead to equivalent increases in C-sequestration
because: (1) the majority of the sink enhancement is in tree bio-
mass rather than in possibly more stably sequestered soil com-
ponents, (2) the fraction of tree biomass that does find its way
to the soil is of high quality and can easily be decomposed.
4. DISCUSSION
The two case studies presented in this paper both addressed
the impact of environmental change on the carbon stock in for-
ests in different regions of Europe. However, the methods that
were used differed strongly. Case study 1 applied a simple
model, EuroBiota, which has, although similar in its philosophy
for tracking carbon flow through the system, about seven times
fewer parameters and state variables than the EFM model used
in the second study. The use of different models dictated the
way they were applied to the issue of environmental change
impacts. The simple EuroBiota model is comparatively fast and
could be applied on a high-resolution grid across Europe, with
4000 cells in total. The EFM model, on the other hand, is slow
(current running time for an 80-year forest rotation is 7 min)
and data-demanding and was therefore only applied to 22 sites
across Europe for which much quantitative information on
soils, weather and forest management was available. Running
speed is not the only determinant of the number of sites to which
a model can be applied. The EFM model has detailed algo-
rithms of the linkage between the carbon and nitrogen cycle and
could therefore also be used to investigate the impact of change
in atmospheric nitrogen deposition, which led to a doubling of
the numbers of calculated scenarios per site.
In spite of the differences between the models and their
application, it is still possible to compare the results of the two
studies, in terms of identified latitudinal and temporal trends,
and with regard to the identification of key environmental driv-
ers. Both models were able to reproduce the negative correla-
tion of latitude with forest productivity (NEP in EuroBiota,
NPP in EFM) that has been observed, for example, by Valentini
et al. [20]. The models also agreed in that they indicated a pos-
itive impact of elevated CO
2
and climate change on forest car-
bon stock across Europe, at least until the present day. The
models did differ in their assessment of the geographical dis-
tribution of the impact of environmental change e.g. EFM
showed a greater increase in the past of C-stocks in Central
Europe compared to EuroBiota. However this difference is
explained by the presence of nitrogen deposition in EFM that
Figure 11. Simulation results from the Edinburgh Forest Model: Carbon stocks at 22 sites. Effects of changes in [CO
2
], climate and N-deposition
on carbon stocks in conifer forests at 22 sites across Europe between 1920 and 2000. The bars show the effect of environmental conditions
(CO
2
, climate and N-deposition) on carbon stocks. Sites are ordered from lowest latitude (HOG = Höglwald, southern Germany, 48.18 ° N) to
highest (KOL = Kolari, northern Finland, 67.15 °N). Triangles indicate the cumulative effect of the three environmental changes, the combined
effect of CO
2
, climate and N generally being slightly more than additive.
922 R. Milne, M. Van Oijen
had strong impact in central Europe. If we consider the future
projections of the two models they both suggest the greatest
response in higher latitudes because future nitrogen deposition
is not expected to continue increasing. Moreover, both models
showed a larger fractional increase in tree biomass than in soil
organic matter. The underlying mechanism in both cases was
that the stimulated flow of carbon into the soils, caused by stim-
ulated tree growth, was partly offset by increased decomposi-
tion in the soils because of increases in soil temperature. Note
that these differences in simulated behaviour between trees and
soils show that EuroBiota, in spite of its simplicity, is like the
EFM not a linear model.
Clearly, the results of the second study, using the EFM and
only 22 sites, cannot be used to make any statements about the
carbon stock of individual countries. However, the strength of
the EFM-study lies in its larger range of environmental factors
that could be examined. The EFM-study thus showed that the
increases in European forest growth observed in recent decades
Figure 12. Simulation results from the Edinburgh Forest Model: the average yearly flow rates of carbon and nitrogen between trees, soil and
environment during 80-year periods of simulated forest growth on 22 sites across Europe. Left column: C-cycle, right column: N-cycle. Top
row: flow rates for simulations under reference (1920s) conditions. Second row: changes in flow rates, relative to the reference flows, because
of increased atmospheric N-deposition. Bottom row: as second row but for changes in N-deposition, [CO
2
] and weather.
Modelling European forest carbon stocks 923
[16], was due mainly to increased nitrogen deposition, with
smaller contributions from elevated CO
2
and climate change,
EuroBiota did not show this effect of nitrogen deposition
because it was restricted to these two latter factors. However,
the EFM-study also indicated that the key drivers in future envi-
ronmental changes are likely to be CO
2
and climate change,
thereby justifying the use of the simpler model for prediction.
The strength of the EuroBiota study lies in its high spatial
resolution, and that of the EFM study in its more detailed con-
sideration of environmental drivers, in particular nitrogen. As
the strengths of each model correspond to relative weaknesses
in the other, we feel that it is may be best to combine models
of widely different levels of complexity in studies of environ-
mental change, rather than just use one model.
5. CONCLUSIONS FROM THE TWO STUDIES
• Observations of increased forest growth across Europe
were explained by analyses using a simple 40-parameter
growth model, EuroBiota, and a complex 261-parameter forest
ecosystem model, EFM.
• Both models showed that forest growth in many parts of
Europe will have benefited from increased atmospheric CO
2
concentrations and climate change, but only the EFM highli-
ghted the role of enhanced N-deposition.
• Both models showed that carbon stocks are likely to have
increased more in tree biomass than in soils.
• Unlike the EuroBiota and EFM models used here, linear
models cannot be used to assess the different roles of standing
biomass and soil organic matter in carbon sequestration.
• Simple dynamic models can be useful for broad assess-
ment of regional variation in forest productivity, whereas com-
plex dynamic models with many parameters can be used most
easily for specific sites where detailed information is available
for parameterisation.
• Complex models can consider a wider variety of environ-
mental drivers and are therefore more useful for apportioning
the effects of different environmental variables on productivity.
Acknowledgements: The EuroBiota work was funded by the EU
under the Environment programme as project LTEEF-II (ENV4-
CT97-0577). Project RECOGNITION was funded by the EU under
the FAIR programme, CT98-4124. We thank all our colleagues for
data on model parameters, soil carbon and nitrogen and for discussion
and collaboration regarding process-based modelling. Special thanks
go to Deena Mobbs for formatting work with the manuscript.
REFERENCES
[1] Brouwer R., Functional equilibrium – Sense or nonsense? Neth. J.
Agric. Sci. 31 (1983) 335–348.
[2] Colin-Belgrand M., Dambrine E., Bienaime S., Nys C., Turpault
M.P., Influence of tree roots on nitrogen mineralization, Scand. J.
Forest Res. 18 (2003) 260–268.
[3] Corre M.D., Beese F.O., Brumme R., Soil nitrogen cycle in high
nitrogen deposition forest: Changes under nitrogen saturation and
liming, Ecol. Appl. 13 (2003) 287–298.
[4] Friend A.D., Parameterisation of a global daily weather generator
for terrestrial ecosystem modelling, Ecol. Model. 109 (1998) 121–140.
[5] Hendricks J.J., Aber J.D., Nadelhoffer K.J., Hallett R.D., Nitrogen
controls on fine root substrate quality in temperate forest ecosys-
tems, Ecosystems 3 (2000) 57–69.
[6] Jalkanen A., Mäkipää R., Ståhl G., Lehtonen A., Petersson H., Esti-
mation of the biomass stock of trees in Sweden: comparison of bio-
mass equations and age-dependent biomass expansion factors,
Ann. For. Sci. 62 (2005) 845–851.
[7] Jenkinson D.S., The turnover of organic-carbon and nitrogen in
Soil, Philos. Trans. R. Soc. Lond. Ser. B-Biol. Sci. 329 (1990)
361–368.
[8] Karjalainen T., Schuck A., Introduction, in: Karjalainen T., Schuck
A. (Eds.), Causes and Consequences of Forest Growth Trends in
Europe – Results of the RECOGNITION Project, Chapter 1, Leiden,
Brill, Leiden (in press).
[9] Kramer K., Mohren G., Long-term effects of climate change on car-
bon budgets of forests in Europe, in: Final report of EU-funded pro-
ject Long-term regional effects of climate change on European
forests: impact assessment and consequences for carbon budgets
(LTEEF-II, ENV4-CT97-0577) (2001).
[10] Medlyn B.E., Jarvis P.G., Design and use of a database of model
parameters from elevated CO2 experiments, Ecol. Model. 124
(1999) 69–83.
[11] Oijen M.V., Ågren G., Chertov O. et al., Application of process-
based models to explain and predict changes in European forest
growth, in: Karjalainen T., Schuck A. (Eds.), Causes and Conse-
quences of Forest Growth Trends in Europe – Results of the RECO-
GNITION Project, Chapter 3.2, Leiden, Brill, Leiden (in press).
[12] Oijen M.V., Ågren G., Chertov O. et al., Evaluation of past and
future changes in European forest growth by means of four process-
based models, in: Karjalainen T., Schuck A. (Eds.), Causes and
Consequences of Forest Growth Trends in Europe – Results of the
RECOGNITION Project, Chapter 4.4, Leiden, Brill, Leiden (in press).
[13] Oijen M.V., Prietzel J., Ågren G. et al., A comparison of empirical
and process-based modelling methods for analysing changes in
European forest growth, in: Karjalainen T., Schuck A. (Eds.), Cau-
ses and Consequences of Forest Growth Trends in Europe - Results
of the RECOGNITION Project, Chapter 5.1, Leiden, Brill, Leiden
(in press).
[14] Penman J.O., IPCC Good Practice Guidance for Land Use, Land-
Use Change and Forestry, IGES, Hayama, 2003.
[15] Ragab R., Finch J., Harding R., Estimation of groundwater
recharge to chalk and sandstone aquifers using simple soil models,
J. Hydrol. 190 (1997) 19–41.
[16] Spiecker H. et al., Growth Trends in European Forests, EFI
Research Report 5, Springer, 1996.
[17] Thornley J.H.M., A transport-resistance model of forest growth and
partitioning, Ann. Bot. 68 (1991) 211–226.
[18] Thornley J.H.M., Cannell M.G.R., Nitrogen relations in a forest
plantation-soil organic-matter ecosystem model, Ann. Bot. 70
(1992) 137–151.
[19] Thornley J.H.M., Cannell M.G.R., Temperate forest responses to
carbon dioxide, temperature and nitrogen: A model analysis, Plant
Cell Environ. 19 (1996) 1331–1348.
[20] Valentini R., Matteucci G., Dolman A.J. et al., Respiration as the
main determinant of carbon balance in European forests, Nature
404 (2000) 861–865.
[21] Wang Y.P., Polglase P.J., Carbon balance in the tundra, Boreal
forest and humid tropical forest during climate-change – Scaling-up
from leaf physiology and soil carbon dynamics, Plant Cell Environ.
18 (1995) 1226–1244.
[22] Webb R.S., Rozenweig C.E., Levine E.R., Global Soil Particle Size
Properties. Digital raster data on a 1 degree geographic 180 × 360
grid, in: Kineman J.J., Ohrenschall M.A. (Eds.), Global Ecosystems
Database Ver 1.0, 1.0 ed, Boulder, United States Department of
Commerce, Boulder, 1992.