Báo cáo lâm nghiệp: "Effect of contrasting water supply on the diameter growth of Norway spruce and aspen in mixed stands: a case study from the southern Russian taiga" pot
Bạn đang xem bản rút gọn của tài liệu. Xem và tải ngay bản đầy đủ của tài liệu tại đây (1.45 MB, 10 trang )
807
Ann. For. Sci. 62 (2005) 807–816
© INRA, EDP Sciences, 2005
DOI: 10.1051/forest:2005086
Original article
Effect of contrasting water supply on the diameter growth
of Norway spruce and aspen in mixed stands:
a case study from the southern Russian taiga
Fyodor TATARINOV
a,b,c
*, Yury BOCHKAREV
d
, Alexander OLTCHEV
a,e
, Nadezhda NADEZHDINA
b
,
Jan CERMAK
b
a
Institute of Ecology and Evolution, Leninsky prospekt 33, Moscow, Russia
b
Institute of Forest Ecology, Mendel University of Agriculture and Forestry, Brno, Czech Republic
c
Present address: Institute of Forest Ecosystem Research (IFER), 1544 Jilove u Prahy, 254 01, Czech Republic
d
Faculty of Geography, Lomonosov Moscow State University, Russia
e
Institute of Bioclimatology, Georg-August University, Goettingen, Germany
(Received 21 June 2004; accepted 27 May 2005)
Abstract – Stem radial growth of Norway spruce (Picea abies (L.) Karst.), aspen (Populus tremula L.), birch (Betula alba L.), alder (Alnus
incana (L.) Moench) and mountain ash (Sorbus aucuparia L.) was measured in an unmanaged mixed uneven-aged tree stand in the southern
taiga of European Russia by band dendrometers during the growing seasons of 2000–2001. In addition woody cores were taken from sample
spruce and aspen trees using increment borers for dendrochronological analysis. Analysis of the tree rings was made for period from 1999 to
2002, the period while daily meteorological data were available. Spruce and aspen represented 40 and 44% of the entire stand basal area,
respectively. However, basal area has grown over 60% of the total in spruce and less than 15% in aspen for each year during the period of 1999–
2002. These results indicate the transformation processes of secondary aspen-spruce stands of the Southern European Taiga into a mixed spruce-
aspen-birch stands. The most intensive radial growth of the spruce trees was observed in 2000 with high over-watering conditions in summer,
whereas the highest radial growth in aspen was observed during the extremely dry growing season of 2002. The basal area growth for entire
forest stand ranged from 5.3 m
2
ha
–1
in 1999 to 11.4 m
2
ha
–1
in 2000. Annual increments of radial growth measured by dendrometers and by
microscopic evaluation of woody cores were quite similar in spruce. In contrast, this comparison was poor for aspen trees because zero growth
in some of aspen trees (measured by dendrometers) was occurred.
stem radial growth / Central Russia / dendrochronological analysis / Norway spruce / unmanaged forest
Résumé – Effets d’une alimentation en eau variée sur la croissance en diamètre de l’épicéa et du tremble dans des peuplements
mélangés étudiés dans le sud de la taïga russe. La croissance radiale saisonnière de l’épicéa (Picea abies (L.) Karst.), du tremble (Populus
tremula L.), du bouleau (Betula alba L.), de l’aulne (Alnus incana (L.) Moench) et du sorbier (Sorbus aucuparia L.) a été mesurée, dans une
forêt mixte non gérée dominée par l’épicéa et le tremble, et située dans la taïga du sud en Russie d’Europe. Les mesures ont été effectuées à
l’aide de dendromètres à ruban pendant les saisons 2000–2001 en parallèle avec les données météorologiques. En plus des carottes de bois ont
été prélevées sur tous les épicéas et trembles mesurés pour faire une analyse dendrochronologique. L’épicéa et le tremble représentaient 40 et
44 % de la surface terrière du peuplement. Néanmoins, annuellement dans la période 1999–2002, la croissance de la surface terrière de l’épicéa
représentait plus de 60 % de la croissance totale de la surface terrière contre moins de 15 % pour le tremble. Ces résultats révèlent la
transformation de la forêt secondaire de trembles en forêt mixte à dominance d’épicéa. La croissance la plus forte de l’épicéa été observée
pendant la saison 2000, caractérisée par une surabondance de l’eau dans le sol pendant l’été, tandis que la croissance maximale du tremble a
été observée pendant la saison extrêmement sèche du 2002. La croissance totale de la surface terrière du peuplement variait de 5.3 m
2
ha
–1
en
1999 jusqu’à 11.4 m
2
ha
–1
en 2000. La croissance annuelle radiale mesurée par les dendromètres et par la mesure des accroissements annuels
sur les carottes de sondage était similaire chez l’épicéa. En contraste chez le tremble, cette concordance était faible à cause de l’absence de
croissance radiale d’une partie des trembles mesurés par les dendromètres.
Russie centrale / analyse dendrochronologique / épicéa / tremble / forêt non gérée
1. INTRODUCTION
Norway spruce (Picea abies (L.) Karst.) is one of the most
important tree species for timber production in the entire zone
of the Southern European taiga in Russia. It is usually domi-
nated in the primary (non-managed) forest stands. Aspen (Pop-
ulus tremula L.) is the dominant tree species of secondary
forests (naturally regenerated after clear cutting, windthrow/
* Corresponding author:
Article published by EDP Sciences and available at or />808 F. Tatarinov et al.
break, etc.) especially on the loamy soils [17, 18]. Since many
forest stands in the region are practically unmanaged (in par-
ticular, in the case of clear-cut stands are often left for natural
regeneration), mixed stand with dominant spruce and aspen
trees in certain different proportions and with admixture of
some other deciduous species are typical in the region of the
southern European taiga.
The area of the southern European taiga is characterised by
moderate humid climate. Annual precipitation usually exceeds
the evapotranspiration [13]. Very high level of ground water
due to surplus precipitation, peat or loamy soils with low infil-
tration rate, flat landscape and low surface runoff results in
development of rather shallow root system in the different tree
species growing in this area [8].
Long-term meteorological data records indicate that the
recent global climatic changes resulted in significantly increase
of the frequency of summer droughts in the Central Russia.
According to the data of the meteorological station in the Cen-
tral Forest Biosphere Natural Reserve (CFBR, 56° 30’ N, 33°
00’ E, Tver region, Russia), during the 10-years period from
1992 to 2002 four strong summer droughts (in 1992, 1999, 2001
and 2002) were observed. This was indicated by precipitation
totals from May to September for these years were below the
confidence interval for long-term mean, whereas mean temper-
atures for the same period were within the corresponding con-
fidence interval. According to climatological data the strong
droughts in this area can be observed once per 5–7 years, only.
It can be expected that rapid decrease of ground water table
during such droughts can result in a lack of available soil water
in the tree root zone, root mortality and finally in significant
decrease of root water uptake, transpiration and photosynthesis
rates [13].
The different tree species respond differently to water stress
conditions [8, 9, 11, 20–22]. Spruce trees with shallow root sys-
tems may be more affected by short-term drought than aspens
with deeper root systems. For spruce trees it is manifested
through decrease of tree transpiration [14] and canopy gross
primary production (GPP) [20, 22]. However, the possible
response of different tree species to the climatic extremes is not
sufficiently known yet. In particular, the important question is,
what is the impact of climatic extremes on stem growth in
spruce and aspen as dominant tree species in the region?
Unique anomalous weather conditions favourable for such
studies occurred during the growing seasons 1999–2002: sum-
mers 1999 and especially 2002 were extremely dry, while 2000
was very wet (Tab. I). Growing season 2001 was close to mean
climatic conditions.
The measurements of stand biometry and tree stem growth
were carried out as a part of the complex research study in a
small forested watershed in the basin of Upper Volga within
the framework of international project “Volgaforest” [13].
The main goals of this paper are:
• to reveal the seasonal dynamics of radial growth of dif-
ferent tree species in a mixed unmanaged forest stand;
• to study, how the extreme moisture conditions (drought or
water surplus) affected the growth of main tree species, namely
spruce and aspen;
• to compare the stem radial growth as measured by den-
drometers and evaluated from analysis of tree rings.
2. MATERIALS AND METHODS
2.1. Site description
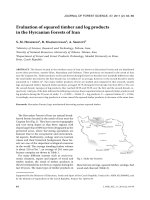
Experimental plot (1.046 ha) was selected in unmanaged uneven-
aged mixed forest stand situated 5 km from the town Peno in the region
of upper Volga (56° 58’ N, 32° 52’ E). Forest consists mostly from
Norway spruce (Picea abies (L.) Karst.) and aspen (Populus tremula
L.), with admixture of birch (Betula alba L.), mountain ash (Sorbus
aucuparia L.), alder (Alnus incana (L.) Moench) and some old Scots
pine (Pinus sylvestris L.) Experimental plot is characterised by very
rich herbaceous vegetation. About 70% of sample plot with 1–1.5 m
deep underground water table on the brown sandy-loam soils was cov-
ered by mixed uneven-aged forest stand and rich herbaceous layer. A
boggy area with underground water table rising up to 20 cm on the
dark-brown clayish-loam soils, with nettle in herb layer and sparse tree
vegetation consisting mainly from alder and aspen presented the rest
of plot [14].
2.2. Forest inventory and dendrometric measurements
Forest inventory included the measurement of the tree diameters
at breast height (DBH) and tree heights. The structure of the root sys-
tem and the size of root boles (diameter and depth), as well as tree
heights, were derived using the measurements of wind-fallen trees.
Root boles were measured in 4 spruces, 3 aspens and 2 birches. The
tree heights were measured in 18 spruces, 10 birches, 13 aspens,
5 alders and 1 mountain ash. The allometric relations between tree
height and DBH were thus derived.
During the growing season of 2000 the radial growth of stems was
measured in altogether 31 sample trees of 5 species: 13 Norway
spruces (Picea abies (L.) Karst.), 11 aspens (Populus tremula L.),
3birches (Betula alba L.), 2 mountain ashes (Sorbus aucuparia L.)
and 2 alders (Alnus incana (L.) Moench) by stainless steel band den-
drometers (EMS, Brno, Czech republic). All sample trees except one
aspen and one alder trees were taken from the dryer part of sample plot.
Observations were made from April to late October once per two
weeks (Tab. II). Number of sample trees per species was chosen
according to their portion in the stand basal area. Within each species
the sample trees were selected according to its tree basal area distri-
bution [4]. In addition, one observation was done in November 2001
(i.e. only the total seasonal growth for this year was obtained).
Table I. Meteorological characteristics of growing seasons 1999–
2002 in Central Russia. Data from Central Forest Biospheric Reserve
(56° 30’ N, 33°
00’ E).
Year Mean air temperature from
May to September
Precipitation total from
May to September
1999 14.1 242
2000 12.4 436
2001 14.0 249
2002 14.1 146
Mean
1970–2002
13.2 386
Std. deviation
1970–2002
1.0 111
Contrasting water supply and diameter growth 809
Subsequently the woody cores were taken by Suunto (Finland)
increment borers from two opposite sides, northern and southern, of
all sample spruce and aspen trees in October 2002 (except of two aspen
trees which died earlier) in order to evaluate the stem growth over a
longer period of time and compare two methods of radial growth meas-
urements. Totally 40 cores from 11 spruce and 9 aspen trees were proc-
essed. Annual ring widths were measured by scanning of cores and
further computer image analysis. Stand age was determined (1) by cal-
culating annual rings of the stumps found at the experimental plot, and
(2) by similar calculation on the tree rings on sample cores (for spruces only).
2.3. Meteorology
The whole set of main daily meteorological parameters (air tem-
perature and humidity, global radiation, wind speed and precipitation)
was measured at meteorological tower above a forest canopy during
the whole growing season of 2000 (from May to October). Devices
for measurements of the air temperature and humidity, wind speed and
wind direction were produced by Thedor Friedrichs GmbH
(Germany). For global solar radiation measurements the pyranometer
CM 11 (Kipp & Zonnen, The Netherlands) was used. Air temperature
and global radiation were also measured at the experimental plot in
1999 from mid June to early October using the other measuring equip-
ment (Schrenk, Austria) and stored to the datalogger EMS (Brno,
Czech Republic).
The water table was measured at the holes bored in four contrasting
points within the experimental plot from middle of June to early
November 1999 and from late May to mid September 2000. One point
was selected an existing well (about 30 m from plot), two others were
bored in the boggy part of the forest (at the same elevation as previous
and at place which was 0.4 m higher), and the last hole was bored at
the highest point of the plot 0.9 m above the well level. The depth of
the last hole was 140 cm; other holes reached the depth of 120 cm.
Measurements were performed with different time intervals from one
day to two weeks by tape measure (precision ± 10 mm).
2.4. Data processing
The following variables describing stem growth were calculated:
increment of stem circumference since the start of measurements in
the considered season (dC); corresponding radius increment dr =
dC/(2
π
); radial growth rate dr/dt = [dr(t
2
) – dr(t
1
)]/(t
2
– t
1
); basal area
growth dS =
π
[(DBH/2 + dr)
2
– DBH
2
/4]; relative basal area growth
dS
r
= dS/(
π
·DBH
2
/4). Growth of stand basal area from the beginning
of growing season was estimated in a similar manner as is generally
used in forestry [2, 3]:
(1) The equations relating tree basal area growth (since the beginning
of growing season) to tree DBH were derived separately for each spe-
cies under study and each particular day of measurement by means of
regression. Multiplicative model (y = a·x
b
) was applied for spruce
and aspen and linear model (y = a + b·x) was applied for other spe-
cies. Measured dendrometric data in sample trees were used for this
purpose.
(2) The obtained regression equations were applied to calculate the
basal area growth of mean trees for each 2-cm-DBH class. The
growth of stand basal area for each day of measurements was esti-
mated by two steps: multiplication of the mean basal area changes for
each class by corresponding numbers of trees for each period and
summarising afterwards. The equation for the basal area growth can
be written as:
,
where t and t
0
are the current day and the day of the first measurement
in the growing season, S(t) is the stand basal area (in m
2
ha
–1
), k and
m are numbers of species and DBH classes, n
ij
is the stocking density
of species i in the DBH class j, and f
t,i
(2·(j – 1) + 1) is the regression
equation between tree basal area growth and tree DBH for moment t
and species i. The similar scaling procedure was applied to the annual
growth data for 1999–2002 obtained from analysis of the tree rings.
The daily evapotranspiration (E
T
) was estimated using the model
“MixFor-SVAT” [12]. The model describes the following processes:
radiation transport within a mixed forest stand, turbulent exchange of
sensible heat, water vapour and CO
2
between soil, forest canopy and
the atmosphere, interception of precipitation by forest overstorey and
understorey, transpiration and water uptake by trees and understorey
plants, water infiltration in the soil, soil heat exchange, photosynthesis
and respiration of overstorey and understorey vegetation. The model
Table II . Characteristics of the sample trees. Environment: 1, dense
young alder - mountain ash cohort near the forest edge; 2, open boggy
place; 3, mixed relatively dry stand; 4, forest edge; 5, dense group of
aspens; 6, in a windfall near the border of boggy part.
Species DBH
(cm)
Crown
projected area
(m
2
)
Dendrochronol.
series
(years)
Environment
Alder 14.8 22.8 1
Mountain ash 9.4 6.2 1
Alder 31.2 2
Aspen 20.6 2
Aspen 32.7 29.2 18 2
Aspen 44.0 39.9 20 3
Aspen 51.2 113.1 12 3
Birch 27.0 3
Birch 38.7 45.3 3
Birch 60.8 3
Mountain ash 18.9 3
Spruce 11.7 5.3 22
*
3
Spruce 16.7 5.7 53
*
3
Spruce 20.1 62
*
3
Spruce 22.1 69
*
3
Spruce 25.3 52 3
Spruce 29.8 20 3
Spruce 33.6 97
*
3
Spruce 36.9 12.2 48 3
Spruce 39.8 3
Spruce 42.3 22.8 49 3
Spruce 45.7 43 3
Spruce 60.4 64.3 77 3
Spruce 66.2 64 4
Aspen 28.4 10.3 31 5
Aspen 34.8 20 5
Aspen 37.2 15.5 16 5
Aspen 42.3 29 5
Aspen 46.4 17 5
Aspen 46.6 12 5
Aspen 57.0 6
* Trees with core up to the middle of trunk.
S
t() St
0
() f
t, i
2· j 1–()1+()·n
ij
j 1=
m
∑
i 1=
k
∑
=–
810 F. Tatarinov et al.
uses the air temperature and humidity, wind speed, precipitation and
global radiation as input meteorological parameters. In our study the
daily meteorological data for all period of dendrological observation
were estimated using special model (SVAT-regio) of spatial interpo-
lation of the meteorological information. For spatial data interpolation
the model uses the modified method of universal kriging [10, 15]. For
interpolation procedure the meteorological data from two meteorolog-
ical stations (CFBR in 55 km to the south from our experimental plot
and Ostashkov in 20 km to the east), digital maps of relief and land-
use were used. Simulated daily evaporation values were used to cal-
culate the rainfall deficit (WD) as the cumulative difference between
daily precipitation amounts and E
T
[6].
3. RESULTS
3.1. Stand tree distribution and biometry
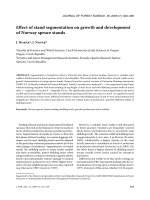
Diameter distribution of the spruces was typical for an
unmanaged stand: all diameter classes were presented and
stocking density decreased exponentially with increasing DBH
class (Fig. 1). Aspen, another dominant tree species, prevailed
in higher diameter classes (in the range from 25 to 50 cm). No
aspen trees with diameter smaller 20 cm were observed. Such
diameter distribution of the dominant tree species indicates
possible changes in succession from the secondary aspen stand
to the mixed spruce stand, which at present is very typical in
the region. Admixture of birches was presented in all diameter
classes, alder and mountain ash prevailed (together with
spruce) in the understorey.
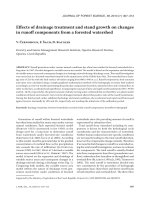
Age of aspen trees ranged between 55 to 75 years old; spruce
was presented in all age classes up to 100 years old. Aspen rep-
resented substantial fraction of entire stand in basal area, but
not in stocking density, due to relatively low number of large
trees (Fig. 2).
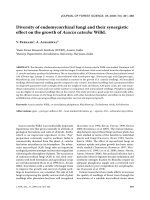
The dependence of tree height on DBH showed that spruce
trees were generally lower than deciduous trees of the same
diameter (Fig. 3). No any dependence of the DBH on the height
was observed for aspen trees with DBH larger than 30 cm.
3.2. Weather conditions during seasons 1999–2002
The growing season 2000 was characterised by very wet
summer. The growing seasons 1999 and 2001–2002 were very
Figure 1. Tree diameter distribution at the experimental stand in Peno.
Figure 2. Stocking density (a) and basal area (b) in the individual spe-
cies at the experimental stand in Peno.
Figure 3. Allometric relations between tree DBH and height (obtained
by measurement in wind-fallen trees).
Contrasting water supply and diameter growth 811
warm and dry (Fig. 4). In particular, drought stress in the sec-
ond part of summer 1999 was expressed at the experimental
plot by the considerable decreasing of stand transpiration
obtained by means of sap flow measurements in August [14].
Precipitation lack influenced dramatically the underground
water table (Fig. 5). The summer of 2002 was characterised by
extreme drought in the entire Central Russia region [16]. The
beginning of vegetation periods of 1999–2000 was characterised
by several strong frosts (approximately until May 20–25). They
resulted in significant reducing the foliage amount in aspens
comparing with other years.
3.3. Seasonal growth curves of individual trees
in the wet year 2000
In 2000 the radial stem growth of most selected sample trees
of different species began in early May and continued until mid-
dle of August (Fig. 6), what corresponds with the typical period
from the start of foliage development until the start of foliage
yellowishing in the region. However the smallest spruce trees
and some deciduous trees (especially birches) started their
growth later (in the second part of May or even in the middle
of June). The aspen trees with DBH less than 34 cm did not
grow in general during the whole season. As an exception, the
growth of 2 sample trees (spruce with DBH 46 cm and aspen
with DBH 46 cm) was observed during the whole vegetation
period until middle of October.
The seasonal patterns of stem radial growth rate (Fig. 7)
showed that intensive growth of deciduous tree species was
shifted to the second half of summer and reached maximum in
middle of July. The stem growth of the spruce had maximum
in early July and was significant since early May to the late
August. The mean growth rate of the spruce trees was several
(at least three) times higher comparing with birch and aspen
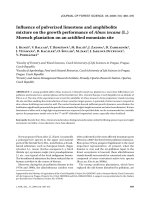
Figure 4. Changes of rainfall deficit during the growing seasons of 1999 to 2002 (data from Central Forest Biosphere Nature Reserve).
Figure 5. Seasonal dynamics of underground water table (lines) and precipitation (bars, data from Central Forest Nature Reserve) for two con-
trasting years of 1999 (a) and 2000 (b) with the schematic drawing of vertical cross-section of enveloping surfaces of tree rooted zones (taken
as rotation bodies) (c).
812 F. Tatarinov et al.
during the whole vegetation season (Fig. 7), whereas the mean
diameter of sample spruces was smaller than mean diameters
of aspens and birches. Mean spruce growth was also higher than
the growth of the alder in understorey layer, but only during the
first part of summer. “Strange” growth behaviour of mountain
ash was possibly evoked by insufficient number of sample trees.
3.4. Stand seasonal growth pattern in 2000
Seasonal increment of basal area in spruce represented over
80% of the entire stand basal area increment (as indicated by
scaling the data up to the stand level). Increment in aspen and
alder, each represented over 5% of the stand total seasonal
increment, while the total basal area of aspen was 10 times
higher compared to alder. Thus, the stand basal area dynamics
showed the transformation of secondary stand with domination
of aspens into the stand with dominant spruce and significant
admixture of alder in wet part of the experimental plot.
3.5. Comparison of seasonal increment in stem radius
measured by dendrometers and obtained
from analysis of tree rings
Comparison of seasonal tree radial growth measured by den-
drometers and obtained from analysis of tree rings showed sig-
nificantly better correlation between two methods for aspen
when for spruce (r
2
for spruce was 0.28 and 0.54 for 2000 and
2001, respectively and 0.17 and 0.16 for these years for aspen).
In particular, zero or very small growth rates were recorded in
four aspens with DBH 20.6, 28.4, 32.7 and 42.3 cm at meas-
urements made by dendrometers in 2000, whereas at analysis
of tree rings their growth rate reached values between 0.5 and
0.7 mm in the same year. One of the reasons of such differences
is a possible methodological error: if the actual tree growth is
close to zero, the corresponding annual ring is practically invis-
ible on the cores and consequently a ring from 1999 could be
erroneously identified as 2000. Another possible reason of this
contradiction could be a bark pressing by dendrometers, which
could evoke the underestimation of real growth by dendrome-
ters. The cross-dating showed, that relating the annual ring
widths of these aspen trees in 2000 to 1999 and taking the cor-
responding data of dendrometers as ring width for 2000
increased the mean correlation of their ring widths with ring
widths of other trees from 0.11 to 0.37. That is why the first
explanation (i.e. really zero or very small width of ring in 2000)
was considered. The exclusion of suspicious data from the anal-
ysis considerably improved the correlation between stem radial
growth estimated by dendrometers and from core analysis:
Figure 6. Growth of basal area in individual trees at the experimental
stand in Peno during the growing season 2000.
Figure 7. Mean growth rate of stem radius in different tree species at
the sample plot in 2000.
Contrasting water supply and diameter growth 813
r
2
for spruce was 0.59 and 0.54 for 2000 and 2001, respectively
and 0.73 and 0.69 for these years for aspen (Fig. 8).
3.6. Annual stem growth of different species
in 1999–2002
The aspen trees showed significantly lower growth of basal
area in absolute and relative terms when compared to spruce
during all period of measurements. This difference was
observed at both dendrometric and tree ring measurements.
This trend was more pronounced in 2000, when the relative
growth of spruce basal area (dS
r
) was from 1.5 to 12%, whereas
the relative growth of aspen was from 0.0 to 0.5%, only (Fig. 9).
Aspen showed the lowest dS
r
during the wet season of 2000
and the highest growth for the driest season of 2002 (Fig. 9).
The growth of spruce was more stable from year to year com-
pared to aspen (mean inter-annual variance of dS
r
was 30% for
spruce and 58% for aspen) and it was relatively independent
on moisture conditions. The reasons of low spruce growth in
1999 are unclear. Probably it can be explained by influence of
anomalous environmental conditions during the summer of
1998 characterised by extremely high over-watering: the total
precipitation for growing season (from May to September) was
210 mm (56%) higher, than long-term means. Higher annual
growth (measured by dendrometers) also occurred in other con-
sidered deciduous species, birch and mountain ash, during rel-
atively dry season 2001 compared to wet 2000. For example,
basal area growth of birch sample trees was 2–3 times higher
in 2001 than in 2000.
In spruce dS
r
decreased with DBH over all years under con-
sideration. In contrast in aspen dS
r
increased with DBH in the
wet season 2000, whereas in other seasons the dependence of
dS
r
on DBH had two peaks. No significant trend was observed
in aspen for other seasons. Basal area growth of the birch trees
decreased with increasing DBH (data from dendrometers for
2000 and 2001).
Figure 8. Comparison of annual radial increment as measured by den-
drometers and by evaluating of cores. Linear regression was calcu-
lated for spruce and aspen trees together.
Figure 9. Relative seasonal growth of basal area in spruce and aspen
in 1999–2002 as measured by microscopic evaluation of cores
(approximation by polynomials of fourth order). Applied paramete-
risations: for spruce – 1999: y = 7·10
–7
x
4
– 2E-05x
3
– 0.0036x
2
+
0.1617x + 1.0623, 2000: y = 7·10
–6
x
4
– 0.0014x
3
+ 0.0957x
2
–
2.8271x + 33.663, 2001: y = 1·10
–5
x
4
– 0.0025x
3
+ 0.1567x
2
–
4.1748x + 42.294, 2002: y = 9·10
–6
x
4
– 0.0017x
3
+ 0.1138x
2
–
3.1968x + 34.877; for aspen – 1999: y = –2·10
–5
x
4
+ 0.0035x
3
–
0.2285x
2
+ 6.3888x – 64.024, 2000: y = 3·10
–5
x
4
– 0.0045x
3
+
0.2676x
2
– 6.8663x + 64.692, 2001: y = –0.0001x
4
+ 0.0228x
3
–
1.3399x
2
+ 34.466x – 325.92, 2002: y = –0.0003x
4
+ 0.0492x
3
–
2.8735x
2
+ 73.383x – 689.54.
814 F. Tatarinov et al.
3.7. Stand seasonal growth in 1999–2002
Spruce absolutely dominated in the stand basal area growth
for all years under consideration (Fig. 10). This domination
was especially pronounced for wet season 2000, when the
spruce growth reached maximum and aspen growth felled to
minimum over the seasons 1999-2002. The total stand basal
area growth ranged from 5.3 m
2
ha
–1
in 1999 to 11.4 in m
2
ha
–1
in 2000.
4. DISCUSSION
Aspen is a pioneer tree species with high initial growth rate
and relatively short lifetime. In contrast, spruce is a dominant
species of primary forests in the region with slower growth and
longer life. That is why higher growth of aspen compared to
spruce in mixed spruce-aspen stands could be expected [7]. In
our case the seasonal radial growth for spruce was several times
higher than for aspen during all periods of measurements.
Nevertheless this difference was more pronounced in “wet”
growing season of 2000 when compared with “dry” 1999 and
2001–2002. The possible reasons of relatively low (compared
to spruce) growth of aspen are:
• Natural decreasing in growth rate of aspen with age ([23],
Fig. 11) and massive damage of aspen wood by pest and fungi
attacks.
• Over-watering especially of deeper soil layers resulted in
higher hypoxia in aspen with its deeper root system when com-
pared to spruce with its shallow root systems [5, 19].
• The frosts in the second part of May in 1999–2000 dama-
ged many young leaves of aspens at experimental plot and,
therefore, reduced potential carbon assimilation capacity of
aspens in these years.
The decreasing dependence of relative growth of basal area
(dS
r
) on DBH for spruce trees for all considered growing sea-
sons indicates that the growth conditions for all diameter
classes of spruce trees can be classified as optimal. In particular,
this dependence is typical for natural spruce regeneration, too.
The increasing dependence of dS
r
on DBH (i.e. small growth
of small trees) in aspen for growing season of 2000 (wet
weather conditions) corresponded to the observed diameter dis-
tribution (see Fig. 1) with aspen regeneration missing. Moreo-
ver the existing small aspen trees were dying rapidly (including
our smallest sample tree with DBH = 20.6 cm, which died dur-
ing the season 2002). Growth of aspen was significantly higher
during dry seasons, and not dependent on DBH, i.e., drought
was rather favourable for aspen. Beside of the soil water regime
Figure 10. Growth of stand basal area in 1999–2002 as measured by microscopic evaluation of cores.
Figure 11. Growth rate of spruce and aspen according to yield tables
(Zagreev, 1992).
Contrasting water supply and diameter growth 815
the within-species competition for light seems to be the main
factor limiting growth of aspens (see, for example, [18]), occur-
ring mostly in compact bio-groups, consisting of trees of similar
height (see Fig. 3). Shading of aspens by spruces which were
mostly of lower height was not significant (see Figs. 1 and 3).
A single solitary growing relatively small (DBH = 32.7 cm)
sample tree in the wet part of plot showed the highest radial
growth and dS
r
comparing with other sample aspens (Fig. 9).
The comparison of above discussed dendrochronological
measurements with similar measurements carried out in the
same time in the forest with similar species composition (on the
soil with similar texture, but drier than in Peno experimental
site) in CFBR [1] showed that although the growth of spruces
was slightly higher at Peno site (but this difference is not sig-
nificant by t-test with 95% confidence level), the aspen growth
is significantly higher at CFBR site (Fig. 12). Consequently, if
Figure 12. Medians of annual ring width of spruces (a) and aspens (b) in Peno and in Central Forest Biosphere Natural Reserve; seasonal and
annual precipitation totals (Reserve) (c).
(a)
(b)
(c)
816 F. Tatarinov et al.
at Peno site the annual radial increment of spruces was always
in 1.5 to 6 times higher than in aspens, at experimental site in
CFBR, in contrast, the aspen radial increment was higher, than
for spruce for all years since 1985, except 1999–2001. Aspen
growth reached minimum at both sites in 2000, when high
water table was combined with foliage damage by late spring
frost and it reached the local maximum in the extremely dry
growing season of 2002. Spruce growth reached maximum at
both sites in 2000 and decreased slightly only in 2001–2002,
whereas severe drought stress occurring in the CFBR at the
same time manifested in the mass decline of spruces (D. Kozlov
and F. Tatarinov, unpublished). Although many spruces were
fallen, the growth of survived trees did not reduce significantly
compared to previous year. In the over-wetted site Peno no
spruce decline was observed, but significant windfall of living
aspen trees (usually associated with breaking of stems evi-
dently damaged by fungi), was observed in 2001–2002.
5. CONCLUSIONS
1. Natural succession of spruce, which was gradually
replacing aspen, was observed at the experimental plot. Nev-
ertheless, repeated dry summers, give a certain advantage to
aspen (better soil water conditions) compared to spruce growth
(see also [14]).
2. Higher inter-annual and space variability of growth rates
during all period of observations was observed in spruce com-
pared to aspen. In particular, growth rates of spruce and aspen
were comparable under drier moisture conditions, on the other
hand spruce growth rate in the wet site was several times
higher than in aspen.
3. In 2002 during the drought stress the high growth of
aspens was observed both at dry and at wet sample plots.
Although this drought resulted in decline (fall) and death of
spruce trees in many regions of Central Russia (including
CFBR, but not in Peno sample plot), it did not affect the
growth rates of survived spruce trees.
Acknowledgments: These studies were founded by the European
Commission within the framework of the INCO-COPERNICUS
research program (Grant IC15-CT98-0120).
REFERENCES
[1] Vygodskaya N., Tatarinov F., Kurbatova J., Kozlov D., Bochkarev
Y., Puzachenko M., Varlagin A., Abrazko M., Schultze E D.,
Effects of extreme soil moisture events on mortality and annual
growth of spruce trees in South-European taiga, 12th International
Boreal Research Association Conference 3–7 May 2004, Fairbanks,
Alaska, Book of abstracts, 2004, p. 200.
[2] Cermak J., Kucera J., Transpiration of fully grown trees and stands
of spruce (Picea abies (L.) Karst.) estimated by the tree-trunk heat
balance method, in: Swanson R.H., Bernier P.Y., Woodward P.D.
(Eds.), Proc. Forest Hydrology and Watershed Measurements,
Vancouver, Canada Aug. 1987, Publ. No. 167, IAHS-AISH, Wal-
lingford, UK, 1987, pp. 311–317.
[3] Cermak J., Kucera J., Scaling up transpiration data between trees,
stands and watersheds, Silva Carelica 15 (1990) 101–120.
[4] Cermak J., Michalek J., Selection of sample trees in forest stands
using the “quantils of total” (in Czech), Lesnictvi (Forestry) 37
(1991) 49–60.
[5] Cermak J., Kucera J., Water uptake in healthy and ill trees, under
drought and hypoxia and non-invasive assessment of the effective
size of root systems, in: Persson H. (Ed.), Above and below-ground
interactions in forest trees in acidified soils, Uppsala, Sweden,
1990, pp. 185–195.
[6] Cermak J., Kucera J., Prax A., Tatarinov F., Nadyezhdin V., Long-
term course of transpiration in a floodplain forest in southern Mora-
via associated with changes of underground water table, Ekologia
(Bratislava), 20 Suppl. 1 (2001) 92–115.
[7] Kabzems R., Garcia O., Structure and dynamics of trembling aspen
– white spruce mixed stands near Fort Nelson, B.C., Can. J. For.
Res. 34 (2004) 384–395.
[8] Karpov V.G., Shaposhnikov E.S., Spruce forests of the territory, in:
Regulation factors of ecosystems of spruce forests, Nauka
publishers, Moscow, 1983, pp. 7–34 (in Russian).
[9] Lebourgeois F., Cousseau G., Ducos Y., Climate-tree-growth rela-
tionships of Quercus petraea Mill. Stand in the Forest of Bercé
(Futaie des Clos, Sarthe, France), Ann. For. Sci. 61 (2004) 361–372.
[10] Matheron G., Principles of geostatistics, Econ. Geol. 58 (1963)
1246–1266.
[11] Minayeva T.Y., Shaposhnikov E.S., Mass drying out of spruce
stands, in: Smirnova O.V., Shaposhnikov E.S. (Eds.), Forest suc-
cessions in protected areas of Russia and problems of biodiversity
conservation, St-Petersburg, Russian Botanical Society, 1999,
pp. 354–360 (in Russian).
[12] Oltchev A., Constantin J., Gravenhorst G., Ibrom A., Heinmann J.,
Schmidt J., Falk M., Morgenstern K., Richter I., Vygodskaya N.,
Application of six-layer SVAT model for simulation of evapotrans-
piration and water uptake in a spruce forest, J. Phys. Chem. Earth
21 (1996) 195–199.
[13] Oltchev A., Cermak J., Gurtz J., Kiely G., Nadezhdina N., Tishenko
A., Zappa M., Lebedeva N., Vitvar T., Albertson J.D., Tatarinov F.,
Tishenko D., Nadezhdin V., Kozlov B., Ibrom A., Vygodskaya N.,
Gravenhorst G., The response of the water fluxes of the boreal
forest region at the Volga’s source area to climatic and land-use
changes, J. Phys. Chem. Earth 27 (2002) 675–690.
[14] Oltchev A., Cermak J., Nadezhdina N., Tatarinov F., Tishenko A.,
Ibrom A., Gravenhorst G., Transpiration of a mixed forest stand:
field measurement and simulations using SVAT models, Boreal
Environ. Res. 7 (2002) 389–398.
[15] Oltchev A., Concept of an evaporation model for non-uniform
forest landscapes, J. Rus. For. Soc., 2003, pp. 55–64 (in Russian).
[16] Russian Hydrometeorological Center, Analysis of climate of Nor-
thern hemisphere in 2002, Informational bulletin, 2003, http://
hmc.hydromet.ru/ (in Russian).
[17] Sukachev V.N., Manual of investigation of forest types, Gosizdat,
Moscow, 1931 (in Russian).
[18] Tkachenko M.E., General forestry, Goslesbumizdat, Leningrad,
1952 (in Russian).
[19] Tripepi R.R., Mitchell C.A., Metabolic response of River birch and
European birch roots to hypoxia, Plant Physiol. 76 (1984) 31–35.
[20] Vygodskaya N., Milukova I., Tatarinov F., Varlagin A., et al.,
Adaptation peculiarities of Picea abies to changes of hydrometeo-
rological factors, Mat. 1st GCTE Science Conf., Woods Hole,
USA, 1994, p. 90.
[21] Vygodskaya N., Puzachenko Yu., Kozharinov A., Zavelsakaya N.,
Tchernychev M., Tatarinov F., Varlagin A., Milukova I., Long-
term effects of climate on Picea abies communities in the South
European Taiga, J. Biogeogr. 22 (1995) 2851–2862.
[22] Vygodskaya N.N., Schultze E D., Tchebakova N.M., Karpachevskii
L.O., Kozlov D., Sidorov K.N., Panfyorov M.I., Abrazko M.I.,
Shaposhnikov E.S., Solnzeva O.N., Minaeva T.Y., Jeltuchin A.S.,
Wirth C., Pugachevskii A.V., Climatic control of stand thinning in
unmanaged forests of the southern taiga in European Russia, Tellus
54B (2002) 443–461.
[23] Zagreev (Ed.), Forest Inventory Handbook, all union rules and
regulations for the forest inventory, Kolos, Moscow, 1992,
pp. 298–321 (in Russian).