Báo cáo lâm nghiệp: "Grouping species for predicting mixed tropical forest dynamics: looking for a strategy" pptx
Bạn đang xem bản rút gọn của tài liệu. Xem và tải ngay bản đầy đủ của tài liệu tại đây (644.15 KB, 12 trang )
785
Ann. For. Sci. 62 (2005) 785–796
© INRA, EDP Sciences, 2005
DOI: 10.1051/forest:2005084
Review
Grouping species for predicting mixed tropical forest dynamics:
looking for a strategy
Sylvie GOURLET-FLEURY
a
*, Lilian BLANC
b
, Nicolas PICARD
a
, Plinio SIST
c
, Jan DICK
d
, Robert NASI
e
,
Mike D. SWAINE
f
, Eric FORNI
a
a
Cirad-forêt, TA 10/D, Campus International de Baillarguet, 34398 Montpellier Cedex 5, France
b
Cirad-forêt, Campus agronomique de Kourou, BP 701, 97387 Kourou Cedex, Guyane, France
c
EMBRAPA Amazonia Oriental/Cirad-forêt, Travessa Eneas Pinheiro, Belem PA 66095-100, Brazil
d
Center for Ecology and Hydrology, Bush Estate, Penicuik, Midlothian, EH26 0QB, Scotland, United Kingdom
e
Cirad-forêt/CIFOR, TA 10/D, Campus International de Baillarguet, 34398 Montpellier Cedex 5, France
f
Aberdeen University, School of Biological Sciences, Aberdeen AB24 3UU, United Kingdom
(Received 3 November 2004; accepted 15 April 2005)
Abstract – The high species diversity of mixed tropical forests hinders the development of forest dynamic models. A solution commonly
adopted is to cluster species in groups. There are various methods for grouping species that can be linked to three strategies (i) the ecological
subjective strategy, (ii) the ecological data-driven strategy, and (iii) the dynamic process strategy. In the first two strategies a species will be
assigned to a single group while in the latter strategy, a specific grouping is defined for each process of population dynamics (typically based
on recruitment, growth, mortality). Little congruency or convergence is observed in the literature between any two classifications of species.
This may be explained by the independence between the sets of tree characters used to build species groups, or by the intra-specific variability
of these characters. We therefore recommend the dynamic process strategy as the most convenient strategy for building groups of species.
cross-comparisons / functional groups / modelling strategy / species classifications
Résumé – Grouper les espèces pour prédire la dynamique des forêts tropicales humides : à la recherche d’une stratégie. Le
développement de modèles de dynamique forestière adaptés aux forêts tropicales humides est compliqué par la très grande diversité spécifique
caractérisant ces forêts. Les modélisateurs ont souvent eu recours, pour simplifier le problème, à des techniques de regroupement d’espèces. Il
existe des méthodes diverses de regroupement, qui relèvent de trois grands types de stratégie : (i) stratégie écologique subjective, (ii) stratégie
écologique basée sur l’analyse de données, (iii) stratégie des processus de dynamique populationnelle. Dans le cadre des deux premières
stratégies, une espèce est affectée à un groupe et un seul alors que dans le cadre de la troisième, des groupes d’espèces sont définis pour chacun
des processus de dynamique (recrutement, croissance, mortalité) pris séparément, et chaque espèce est affectée à trois groupes. Dans la
littérature, on trouve peu d’exemples de congruence ou de convergence entre les groupes définis par ces différentes méthodes. Ceci peut être
expliqué par l’indépendance existant entre les caractères utilisés pour fabriquer tel ou tel groupe, ou encore par la grande variabilité intra-
spécifique de ces caractères. Nous argumentons et concluons sur le fait que le recours à la stratégie des processus de dynamique paraît être la
meilleure pour construire des groupes d’espèces adaptés à la prédiction de la dynamique des forêts tropicales.
comparaisons croisées / groupes fonctionnels / stratégie de modélisation / classifications d’espèces
1. INTRODUCTION
Understanding and predicting the dynamics of mixed trop-
ical forests is difficult because, principally, of their high species
diversity. This difficulty hinders the development of predictive
dynamic models, essential for forest managers to simulate log-
ging scenarios for sustainable exploitation. Models of forest
dynamics require species specific parameters (such as growth
rate, mortality rate, etc.), and the issue is to get a value of the
parameters for each species. If a species is represented by a low
number of individuals in the dataset that is used for model fit-
ting (which is generally the case due to the high species diver-
sity), then estimates of model parameters for this species will
have a high variance, and even be unreliable. One solution to
reduce this variance is to allocate the large number of tree spe-
cies to a smaller number of groups, thus increasing the size of
the sample used for parameter estimation. As far as modelling
is concerned, species grouping is justified if the decrease in
* Corresponding author:
Article published by EDP Sciences and available at or />786 S. Gourlet-Fleury et al.
parameter variance brings a gain in model prediction accuracy.
Species grouping may also reveal important features of the eco-
system function [67].
Hereafter, we shall take for granted that species grouping is
justified for the modelling of tropical forest dynamics, and shall
focus on the methods for grouping species. Besides the clus-
tering technique itself, grouping species raises questions such
as: (i) How to assign rare species with unreliable parameters or
even missing data? (ii) How to extrapolate a species classifi-
cation on a well documented forest to another forest with scarce
data? These two questions are not the focus of this paper.
Ideally, modellers look for functional groups sensu [29], i.e.
“a non-phylogenetic classification leading to a grouping of
organisms that respond in a similar way to a syndrome of envi-
ronmental factors” with the further restriction that “response is
mediated through the same mechanism”, which differentiates
mere “response groups” from real “functional groups”. Accord-
ing to these authors, this double constraint should ensure that
the groups will behave homogeneously under a large range of
perturbations, giving the classification a greater extrapolative
power. They suggest that the existence of functional groups
implies that (i) there is an underlying “inherent structure” of
species, and (ii) each functional classification reveals this struc-
ture. This inherent structure may thus be revealed by an overlap
of classifications obtained from different character data sets
(congruency) or for different purposes (convergence).
In reality, little evidence of congruency, and even less of
convergence between classifications has been demonstrated so
far. This can either mean that the inherent structure does not
exist, that the characters selected to group species are not ade-
quate, or that the analytical techniques used to group species
are not appropriate [29].
The classifying techniques used by modellers for tropical
forests have largely been driven by earlier works in forest ecol-
ogy and dynamics, going back to the early 20th century [7, 69].
This strategy favours an ecological interpretation of the groups.
On the other hand, one may choose to favour the accuracy of
model predictions. Grouping species then simplifies to a com-
binatorial optimization problem to achieve the best agreement
between observations and predictions [56]. The techniques
used by modellers generally lie in between these two opposite
points of view, and try to make a trade-off between ecological
interpretation of the groups and accuracy of model predictions
[11, 23, 25, 38, 62]. Numerous methods have been used, but
they generally lack consistency and objectivity [23, 40], a
caveat indeed not limited to trees and tropical forests [45]. It is
therefore difficult to compare between forests and between
models, and to ensure the extrapolative ability of the models
built. Some authors have tried to compare classifications [1, 23,
30, 33, 70–72] but like [29], failed to show evidence of real
functional groups.
The objective of this paper is to select a clustering strategy
to group species for the modelling of tropical forest dynamics
aiming at efficiently predicting forest recovery after distur-
bance without hindering ecological interpretations. This selec-
tion is based on a review of the main methods used by ecologists
and modellers to build species classifications for tropical rain-
forests taking advantage of the reasons why those previous
classifications lacked congruency. We will focus on groups
built to address tree population and community dynamics,
rather than forest ecosystem functioning. Our paper describes
first the main methods for grouping species, distinguishing
between three strategies. The key concept that we shall call
“dynamic process groups” is introduced at the end of this sec-
tion. Second, some properties of the tree characters used for
grouping species are presented, insofar as they explain the lack
of congruency between classifications. The third section is
devoted to the analysis of congruency between classifications.
In the last section, the “dynamic process” strategy is selected
as the most convenient and this choice is argued in the light of
the previous discussion.
2. MAIN STRATEGIES OF SPECIES
CLASSIFICATION
We can distinguish between three major types of tree species
classifications, depending on the characters and methods used
by the reviewed authors: (i) ecological subjective groups,
(ii) ecological data-driven groups and (iii) dynamic process
groups (corresponding to the components of forest dynamics:
recruitment, growth, mortality).
2.1. Ecological subjective groups
Ecological subjective groups are based on characters that are
relatively easy to measure over short periods of time or well
documented in herbaria [67], mainly physiological and mor-
phological traits. The decision to split the characters into dif-
ferent categories relies on empirical knowledge from field
observation. This strategy, which assumes that groups exist and
can be defined inductively, was qualified as “subjective” by
[29].
A classical example is the pioneer/non-pioneer dichotomy
[67], largely based on a single criterion: a requirement for full
light for both germination and establishment. The pioneer
group proved to be associated with a whole syndrome of char-
acters [9, 67, 68], in contrast with the highly heterogeneous
non-pioneer group. The pioneer/non-pioneer dichotomy was
refined with other characters such as height at maturity or max-
imum height [12, 35, 36, 49, 65, 67], and wood density [40].
2.2. Ecological data-driven groups
Ecological data-driven groups are based either: (i) on dynamic
characters (diameter increment, mortality rate, recruitment
rate: data usually available for trees greater than 10 cm dbh),
derived from successive measurements in permanent sample
plots [3, 16, 25, 54]; (ii) on morphological characters (e.g. max-
imum height) [15, 19, 43, 52, 53]; or, more often, (iii) on a com-
bination of both. To build groups, multivariate analyses
(mainly principal component analysis and cluster analysis) are
applied to the data sets [1, 2, 6, 23, 24, 27, 42, 55] (see Tab. I).
This strategy was qualified as “data-driven” or “data-defined”
by [29, 30]. Some authors further use the commercial/non com-
mercial status of the species in order to obtain groups or sub-
groups meaningful for forest managers [2, 10, 42]. Others use
wood density as a proxy of diameter increment, and combine
Dynamic species groups in tropical forests 787
it either with morphological characters [40] or with commercial
status to group their species [51, 73].
2.3. Dynamic process groups
Dynamic process groups are based primarily on one cate-
gory of dynamic characters only: growth groups are based on
diameter increments, mortality groups are based on mortality
rates, and recruitment groups are based on recruitment rates.
The method used to build the groups relies on a theoretical
model considered to describe the selected process. Examples
are given in Table II for growth and in Table III for mortality
and recruitment. For each process, the parameters of the model
are estimated by fitting the theoretical curve to the measured
Table I. Examples of species classifications into “ecological data-driven groups” for modelling purposes. Variables used are often population
dynamic variables, but also morphological variables.
Ref. Variables used Number of
species analysed
Number of groups
obtained
[1] Mean diameter increment, diameter of the largest tree 256 16
[2] Commercial/non commercial category, diameter increments, annual mortality rate,
proportion of dominant trees, largest diameter
486 54
[6] Diameter increments 112 7
[23, 24] Mean diameter in undisturbed stands, mean diameter increment per diameter class
(disturbed and undisturbed plots), recruitment rate (disturbed and undisturbed plots)
123 (out of 200 in the
data bank)
5
[27]
a
First quartile, median and third quartile of the diameter increment distribution. Height
classes then used to further subdivise
106 17
[42] Mean diameter (undisturbed plots), mean diameter increment (logged + thinned plots),
mortality rate (undisturbed plots), recruitment rate (undisturbed plots)
72 (out of 260 in the
data bank)
7
b
[51] Commercial/non commercial category, wood density 468 7
[55] Predicted growth variable, recruitment variable 136 (out of 575 in the
data bank)
10
a
Those authors did not build dynamics models, but the philosophy of their grouping is very coherent with the other works cited here.
b
Five ecological groups, crossed with 5 commercial categories, leading to 14 potential groups. Only 7 were kept, as large enough to allow parameter
estimation of a matrix model.
Table II. Example of species classifications into growth groups. The groups depend on the formulation of a growth model.
Ref. Model used Number
of species analysed
Number of groups
obtained
[31, 33] ln(∆D + 0.287) = a' + [lnm + lnD + (1 + 1/m)ln(lnK – lnD)]
+ [bln(NBD + 1) + c∆NBD + d∆NBD
2
]
with ∆D: diameter increment, D: dbh of the tree, NBD: number of overtopping neighbours
within 30 m of the subject tree, ∆NBD: variation of NBD during the last 3 years, a', m and K are
the parameters of a Korf model
173 15
[47] DI = β
1
+ β
2
D
DI = β
1
+ β
2
D + β
3
D
2
lnDI = β
1
+ β
2
lnD
lnDI = β
1
+ β
2
D + β
3
lnD
with DI: diameter increment, D: dbh of the tree
12 5
[51] lnbai = β
1
+ β
2
lnba + β
3
ba + β
4
SQ + β
5
lnBA + β
6
OTBA
with bai: individual basal area increment, ba: basal area of the tree, SQ: site quality (dummy
variable), BA: stand basal area, OTBA: overtopping basal area
436 20
[57] a
t
= α
0
− α
1
(B
t
/B
0
) + ε
t
with a
t
: mean diameter increment between t and t + 2, B
t
: basal area of the plot at t, B
0
: initial
basal area of the plot, ε
t
: residual. The variance-covariance matrix of the ε
t
is modelled by
Cov(ε
t
,ε
t′
) = σ
2
ρ
| t–t′|
to manage with data issued from successive remeasurements
202 5
[70] ln(DI + α) = β
1
+ β
2
D + β
3
lnD + β
4
SQlnD + β
5
lnBA + β
6
OBA
with DI: diameter increment, D: dbh of the tree, SQ: site quality, BA: stand basal area, OBA:
overtopping basal area
237 41
788 S. Gourlet-Fleury et al.
data. Groups of species are then built to ensure the best simi-
larity between the species specific theoretical curves within a
group. The similarity between curves may be assessed in sev-
eral ways, as the variance of the residuals of the fitting of the
theoretical curve to data [70, 72], or as the Euclidean distance
between the parameters of the curves [47, 57], or as a functional
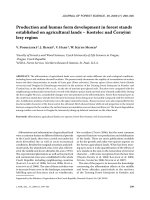
norm of the difference between curves [56], etc. Figure 1 illus-
trates on a theoretical example these different indices of simi-
larity between two species. The building up of the species
groups using these similarity indices may be done in various
ways: cluster analysis [57], numerical optimization of a cost
function [56], ad hoc sequential method [70], etc.
The theoretical model, once chosen, remains generally
fixed. However an alternative method consists of modifying the
theoretical model in an iterative way, as groups of species are
formed: species with the same range of residuals are grouped
together, a better adapted theoretical model is chosen for each
group, and new residuals are examined and so on, until no spe-
cies effect is left in the residuals [31, 33].
Researchers that use ecological subjective groups most often
do not have modelling as their primary purpose, or they face a
lack of dynamic data to correctly assign each species to a group.
When the objective is to build predictive models of forest
dynamics, and enough data are available from permanent sam-
ple plots, ecological data-driven groups using dynamic charac-
ters, and groups of dynamic process are usually preferred.
The philosophy underlying ecological groups on the one
hand, and dynamic process groups on the other hand, is com-
pletely different. In the first case, researchers forming ecolog-
ical groups assume that species behave homogeneously inside
each group, particularly with respect to all the dynamic com-
ponents (Fig. 2): they are real “response groups” and possibly
Table III. Example of species classifications into mortality and recruitment groups. The groups depend on the formulation of mortality and
recruitment models.
Ref. Model used Number
of species
analysed
Number
of groups
obtained
Mortality
[71] P = {1 + exp[–(β
0
+ β
1
lnDBH + β
2
DBH + β
3
RS
2
+ β
4
SQ + β
5
BA + β
6
lnBA)]}
–1
with P: probability of dying, DBH: dbh of the tree, RS: relative status of the tree (overtopping basal area
divided by the total plot basal area), SQ: site quality, BA: stand basal area
100 10
Recruitment ( ≥ 10 cm dbh)
[57] r
t
= β
0
– β
1
(B
t
/B
0
) + ε
t
with r
t
: recruitment between t and t + 2, B
t
: basal area of the plot at t, B
0
: initial basal area of the plot, ε
t
:
residual. The variance-covariance matrix of the ε
t
is modelled by Cov(ε
t
,ε
t′
) = σ
2
ρ
| t–t′|
, to manage with
data issued from successive remeasurements
202 5
[72] Recruitment is described through a two-stage approach
P = {1 + exp[–(β
0
+ β
1
PRES + β
2
BA + β
3
lnBA + β
4
SOIL + β
5
TR)]}
–1
with P: probability of recruitment, PRES: binary variable indicating the presence (1) or absence (0) of the
species in the stand, BA: basal area of the stand, SOIL: binary variable (1: soils derived from basic volcanic
and coarse granite parent materials, 0: others), TR: treatment response (Tr = te
t/9
), maximum 9 years after
treatment
100 5
lnN = β
0
+ β
1
lnBA + β
2
ln(RNO + 0.2) + β
3
SQ + β
4
SOIL
with N: number of recruits (ha
–1
year
–1
), RNO: relative importance of the species in the stand, BA, SQ and
SOIL as previously defined
100 8
Figure 1. Illustration of the different ways of assessing the similarity
between curves fitted to data. This theoretical example shows diame-
ter growth curves (the same could be done for mortality or recruitment
using models given in Tab. III) and uses the Gompertz model as the
growth model (see Tab. II for more realistic models): circles corres-
pond to (fictitious) data and lines are fitted Gompertz curves. Black
circles correspond to a species with the fitted Gompertz curve in solid
line, and white circles correspond to another species with the fitted
Gompertz curve in dashed line. The dotted line is the Gompertz curve
fitted to all dots (black or white). The similarity between the two spe-
cies growth curves can be assessed as the variance of the residuals of
the Gompertz model in dotted line (shown as vertical segments), as
a functional norm of the difference between the curve in solid line and
the curve in dashed line (the surface of the area shown in grey cor-
responds, for example, to the L
1
norm), or as a distance between the
parameters of the Gompertz equations for the two species.
Dynamic species groups in tropical forests 789
“functional groups” sensu [29]. As a consequence, each species
belongs to a given group and only one throughout its life-span.
The groups are most often ecologically meaningful (Fig. 4 and
later in text). In the second case, researchers creating dynamic
process groups make no assumption about the existence of
response or functional groups. To model the forest dynamics,
they build separate classifications with respect to each dynamic
process.
As this latter strategy (that will be named hereafter the
“dynamic process” strategy) is the key concept of this paper,
we shall clarify its implications. Each species needs to be
assigned to three different groups for its complete dynamic
behaviour to be described (Fig. 3). There are groups of species
for growth, recruitment, and mortality. As a consequence, a
species can shift from one group to another according to its life-
stage, and the compared behaviour between two species differs
Figure 2. Illustration of the “ecological data-driven” grouping stra-
tegy. Four groups were built using cluster analysis on dynamics and
morphological variables (see Tab. I). The projection on the three axes
shows that the groups are poorly discriminated from the viewpoints
of growth (two groups left), mortality (between one and two groups)
and recruitment (two groups). When modelling those components for
inclusion into dynamics models, the variability of the response will
not be optimally taken into account.
Figure 4. General grouping scheme appearing
in most of the studies on forest dynamics. The
criteria most currently used to classify species
are those appearing along the two axes. Clas-
sifications are generally obtained from one or
two of those parameters.
Figure 3. Illustration of the “dynamic process” grouping strategy.
Species groups were built, using models describing growth (groups
Gg1 to Gg4), mortality (groups Mg1 to Mg4) and recruitment (groups
Rg1 to Rg4) separately. The combination of the 4 × 4 × 4 sub-models
allows the potential description of 64 groups of species (all the com-
binations do not necessarily exist) with the same quantity of parame-
ters as in the strategy illustrated on Figure 2.
790 S. Gourlet-Fleury et al.
according to the life-stage. For instance, two species can belong
to the same growth group and belong to separate mortality or
recruitment groups. This strategy potentially allows describing
a continuum of behaviours in the forest.
3. PROPERTIES OF THE CHARACTERS USED
TO DEFINE GROUPS
Two properties emerging from the literature on species clas-
sifications for tropical forests help to understand the forthcom-
ing results and to choose an adequate clustering strategy.
Henceforth, we shall refer to these properties as the prelimi-
naries. The first property deals with the dependence between
tree characters used for species grouping, the second property
with the intra-specific variability of these characters.
3.1. Dependence between the characters
Physiological, morphological and dynamic characters used
to group species are not necessarily independent. Two sets of
characters can however be considered as globally independent
(Fig. 4). The first set of characters (y-axis, Fig. 4) collates
potential size, life span and mortality rate. The second set
(x-axis) collates growth rate and wood density. The independence
between potential size and growth rate was already suggested
by earlier works (e.g. [68]). Mortality rate here mainly concerns
treefall, since standing death appears to be negatively corre-
lated with the growth rate [13, 28, 62]. The negative correlation
between maximum height and the mortality rate was frequently
noticed [40, 41, 43, 68]. As an alternative to the mortality rate,
some authors use the turn-over rate [68], which would suggest
that high mortality rates are associated with high recruitment
rates. Information regarding mortality, and more acutely,
recruitment is generally scarce or incomplete. However, it is
generally recognised that pioneer species are characterized by
a high turnover rate due to both high mortality and high recruit-
ment while non-pioneer species have a low turn-over rate
(Tab. IV). [40] also found a decline, although not significant,
in mortality rate from early to late successional species. Eco-
logical groups can therefore be ordered according to an increasing
turn-over rate as follows: pioneer species (and/or shade-intol-
erant species) understorey species > canopy species > emer-
gent species. An illustration of such a trend between
recruitment rates and ecological groups is given by [46]. How-
ever the correlation between mortality and recruitment rates
was not confirmed by other studies [70, 71]. This could mean
that our scheme of Figure 4 should be three-dimensional rather
than two-dimensional, with the third axis representing recruit-
ment, but it could result from the particular behaviour of pio-
neers: high rates do not occur at the same time, nor at the same
place, while they do in understorey shade-tolerant species.
Depending on the size of the stands considered and on their past
disturbance history, links between recruitment and mortality
rates will or will not appear.
Ecological groups of species can be located in the two-
dimensional space defined by Figure 4. Regarding the x-axis,
pioneer species (and/or shade-intolerant species) generally
show a faster growth rate than non-pioneers, with the exception
of some emergent species (Tab. IV, see also [40]). Conversely,
growth rate of non-pioneer species usually increases with the
maximum height at maturity of the species. Ecological groups
can therefore be ordered according to their decreasing growth
rate in the following way [26, 33, 64]: pioneer species (and/or
shade-intolerant species) emergent species > canopy species
> understorey species (Tab. IV).
Let us finally note that, as a combined product of growth,
mortality and recruitment, tree diameter distributions have
often been suggested as characteristic of ecological groups, and
used to classify species: shade-intolerant species usually
exhibit distributions with a paucity of small stems whereas
shade-tolerant species have a typical reversed-J curve [18, 39,
60, 61].
The schematic view that emerges from what precedes is that
shade-intolerant species grow more quickly and die more fre-
quently than shade-tolerant species that are characterised by
low growth and low mortality; this being moderated by tree
stature. Convergent examples are observed in temperate forests
[5, 34]. It has been proposed that shade-tolerance or intolerance
is the result of trade-offs between high growth under high-light
conditions and high survival under low-light conditions [8, 20–
22, 35].
3.2. Intra-specific variability of the characters
In tropical forests, the variability of tree characters is gen-
erally high. Part of this variability is due to the genetic varia-
bility of the species; the remaining part results from the
confounding effects of environment. As a consequence, a char-
acter can have a wide range of values even when restricting it
to a species or a group of species with similar ecological behav-
iour. Examples can be found in [27, 40] for diameter increments
and in [20] for mortality rates.
Species growth rate is usually estimated through a mean
increment value irrespective of tree size [40, 41, 46, 65],
although growth rate may [14, 17, 20, 26, 32, 53, 66] or may
not [43, 48] be correlated with tree size [50]. Moreover, species
performance measured through growth rates is usually the aver-
age response of trees in a range of micro-environments. Exog-
enous factors can greatly modify the dynamics of species [37,
52]. Most tree species, for example, will grow faster after log-
ging or thinning [33]. Vanclay [70] showed how inefficient
were average growth rates for recognizing increment patterns,
unless adjusted for tree size, site quality and competition.
There is, therefore, an inherent problem with attempts to
characterise a given tree species with a single overall growth
rate. This should be done after factoring out size and environ-
mental factors either:
• by estimating maximum growth rates (or a quantile) rather
than average ones (see e.g. [14]), because they are expected to
express the species intrinsic growth potential without limiting
factors. Generally, the range amongst species between the
lowest and highest values is larger for maximum growth rates
than for average rates [41, 49], or
• by using the residuals of models predicting growth from
actual size with environmental factors taken as independent
variables (Tab. II).
Note that the difficulties described for growth rate are even
greater for mortality [66] and recruitment rates. Growth is a
≈
≈
Dynamic species groups in tropical forests 791
more or less constant process whereas death and recruitment
are instantaneous, randomly distributed and highly variable in
time and space.
4. CONGRUENCY BETWEEN CLASSIFICATIONS
We reviewed how different classifications compare, and
summarised the results in Table V. As expected from Figure 4,
there are links between the potential size, life-span, mortality
rates and turn-over rates of trees on the one hand and between
shade tolerance/intolerance in the juvenile stages, growth rates
and wood density on the other hand. By using one or other of
these variables, species can be classified into a limited number
of groups, logically positioned along the axes of Figure 4 as
aggregates or refined versions of the four generic groups rep-
resented within the figure. This scheme is reminiscent of sev-
eral found in the literature: the four groups of [49] based on
maximum height and the dichotomy pioneer/non pioneer, the
five groups of [24] based on maximum dbh and dynamic var-
iables, or the 13 plant-functional types of [40], based on max-
imum height and wood-density, more or less continuously
dispersed across the paraboloid represented by our generic
groups.
A certain degree of congruency can exist between classifi-
cations based on correlated variables. [68], for instance, pro-
duced a two-way classification of tree species based on the two
sets of variables shown in Figure 4 and showed its coherence
Table IV. Growth, mortality and recruitment (when available) characteristics of ecological groups, as found in literature.
Species groupings No. of
species
Min.
size
Max dbh annual
increment (mm yr
–1
)
Mortality
rate
Recruitment
rate
Forest type
and location
Ref.
Range Median
or mean
(% yr
–1
) (% yr
–1
)
Shade-intolerant sub-canopy and canopy sp.
a
8 ≥ 10 6.7–14.6 12.0 La Selva [46]
Shade-tolerant sub-canopy and canopy sp. 18 cm 2.6–11.1 5.6 Biological Station
Understorey and shade-tolerant subcanopy sp. 19 dbh 1.0–2.8 1.7 Costa Rica
Short-lived and long-lived pioneer sp. 5 ≥ 10 5.5–13.5 9.8 Bukit Lagong Forest [49]
Emergent sp. 3 cm 9.3–14.3 10.1 Reserve, Hill
Main canopy sp. 9 dbh 1.5–11.8 6.6 Dipterocarp Forest
Understorey sp. 7 0.9–5.1 3.3 Peninsular Malysia
Short-lived and long-lived (ll) pioneer sp. 4 ≥ 10 3.2–6.8 7.5 3.29 (ll) Sungei Menyala [48]
Emergent sp. 4 cm 7.5–14.6 9.6 1.43 Reserve, Lowland [49]
Main canopy sp. 7 dbh 2.0–6.9 5.6 1.82 Dipterocarp Forest
Understorey sp. 9 1.9–6.9 4.0 2.58 Peninsular Malysia
Small pioneer ≥ 30 4.25 9.06 6.72 Moist semi- [65]
Large pioneer cm 4.25 3.17 3.18 deciduous
Shade intolerant gbh 1.86 1.65 1.58 forest
Shade tolerant (canopy) 1.24 1.10 1.03 Kade, Ghana
Shade-tolerant (understorey) 0.62 2.39 1.81
Canopy sp. 5 ≥ 10 5.0–16.3 5.1 3.2 Yasuni [41]
Large-stemmed mid canopy sp. (age ≤ 350 yr) 9 cm 1.2–6.4 4.4 2.9 National Park
Small-stemmed canopy sp. (200 yr max age) 7 dbh 2.4–7.0 3.1 2.1 Ecuador
Understorey sp. (200 yr max age) 2.0
Canopy sp. ≥ 2.5 14
b
Barro Colorado [43]
Mid canopy sp. cm 31
b
Island
Understorey sp. dbh 26
b
Panama
Emergent and upper canopy sp. 10 ≥ 10 0–20 Hill evergreen [53]
Lower canopy sp. 9 cm 0–10 forest
Understorey sp. 5 gbh 0–2.5 Kerala, India
a
Higher diameter increments were recorded for pioneer species ≥ 10 cm dbh in Panama (73.4 mm yr
−1
for Ochroma pyramidale at Barro Colorado
Island, [17]) and in French Guiana (80.0 mm yr
−1
for Cecropia obtusa at Paracou, [32]).
b
Mortality rate calculated for a 10 years period.
792 S. Gourlet-Fleury et al.
with Shugart’s two-way classification of trees on their gap
requirement and propensity to form gaps when they die [62].
This result can be explained by our first preliminary property
(as defined in the third section) because a “propensity to create
gaps” can be related to maximum height (y-axis) and “gap
requirement” can be related to growth rate (x-axis). Another
example is provided by [30], who compared four different clas-
sifications of Australian tree species based on shade-tolerance
or successional status (“subjective classification”), seed per-
sistence + light and growth response, morphological + life-his-
tory + phenological traits and dynamic variables. Their results
are consistent with the first preliminary property. In their
“dynamic data set”, about half the variables are related to size
structure and tree mean size through dbh, while the other half
deals with mortality, recruitment and growth of adults and juve-
niles: the two axes of Figure 4 are thus taken into account. In
the “morphological data set”, variables are linked to stature,
leaf morphology and reproductive/dispersal characters, that is
to say mostly variables linked to the y-axis. The subjective clas-
sification (pioneer, early, mid and late successional species) is
a simplified version of the generic groups presented in Figure 4
and could be positioned along the x-axis. As expected, some
coherence could be found between the dynamic and subjective
classifications (both taking the x-axis into account) while no
link could be found between the morphological and subjective
classification. The “little coherence” found to occur between
the dynamic and morphological classifications is probably
explained by the variables linked to the y-axis in both of them.
Table V. Results of congruency analysis between species classifications.
Classifications Ecological subjective groups Ecological data-driven groups Dynamic process groups
Ecological subjective
groups
Cross-comparisons between groups of
[15], based on height-diameter curves
characteristics, edaphic preferences, spa-
tial pattern, dispersal syndrome, popula-
tion density.
No convergence between any of the clas-
sifications.
Ecological data-driven
groups (see Tab. I)
Groups of [1] and [23] vs. groups based
on shade-tolerance, dispersal syndrome,
seed size and wood density.
Global tendencies: pioneer and heliophi-
lous species tend to grow faster, to have
smaller seeds and lighter wood than
shade-tolerant species.
Low congruency: the species of any eco-
logical group are found in all dynamic
groups.
Dynamic process
groups (see Tabs. II
and III)
Growth groups of [70] vs. groups based
on shade-tolerance, growth groups and
mortality groups [71] vs. size reached at
maturity, and taxonomy.
Low congruency: pioneers and gap-colo-
nizers encompass several growth groups,
the same growth group can include
shade-tolerant and light-demanding spe-
cies. Size at maturity weakly related to
growth groups, while there is a link with
mortality groups. No relationship with
taxonomy.
Growth groups of [33] vs. groups of
[23].
Low congruency: close agreement only
for the pioneer group and one growth
group. The other Favrichon's groups
include at least seven different growth
groups, and most of the growth pat-
terns gather species belonging to two
or three ecological data-driven groups.
Cross-comparisons between the growth,
mortality and recruitment groups of [70,
71, 72].
No congruency between the growth
and neither the mortality nor the recruit-
ment groups. No congruency between
the mortality and the recruitment groups.
No congruency between the two levels
of recruitment groups (probability of
recruitment and amount of recruitment,
see Table III).
Growth groups of [31] vs. groups of [15]
based on parameters of height/diameter
curves and interpreted in terms of light
needs.
Some agreements for extreme categories:
growth patterns of the small shade-tole-
rant species are completely different from
those of the canopy light demanding spe-
cies.
Low congruency: no particular growth
group match with any of the other six
ecological groups.
Cross-comparisons between the growth,
mortality and recruitment groups of [57].
Same results as for Vanclay above.
Dynamic species groups in tropical forests 793
On the contrary, no congruency between classifications will
be found if they are based on independent sets of characters.
For instance [15] made five independent classifications of a set
of French Guiana species, and observed no convergence
between them. The first preliminary property may also explain
why the classification of [15] based on height and diameter var-
iables has almost nothing to do with the classification of [31]
based on diameter growth. Similarly, the independence
between variables can explain why the growth and mortality
groups of [70, 71] are not coherent, or the inability of maximum
size to indicate increment patterns [70].
Overall, congruency turned out to be limited. A somewhat
disappointing but not surprising finding. It seems that the best
results for a worldwide classification into functional types, in
terms of congruence or convergence, were obtained when con-
sidering a full range of life forms (sensu [58]) in a given eco-
system (see, e.g., [74]), or limited types between contrasted
environments [44]. The tropical trees that we examined here
form an assemblage within a single life form. This work points
to a need to consider a much wider range of variables than has
been done to date, like those available in databases of taxa char-
acteristics.
5. SELECTED CLUSTERING STRATEGY FOR
MODELLING TROPICAL FOREST DYNAMICS
Ecological strategies show a major drawback: once the
groups are obtained, they are used to calibrate the growth, mor-
tality and recruitment sub-models that are part of the overall
forest dynamics models (see Tab. I, and Fig. 2 for an illustra-
tion of this strategy). As previously mentioned, the important
and implicit assumption, in this case, is that the so-defined
dynamic groups should behave homogeneously in all the
dynamic components: two species that are in the same growth
group are in the same mortality or recruitment group. This
would indicate a certain degree of redundancy. The frequently
observed independence between variables helps to understand
that this is unrealistic. Subjective groups add two supplemen-
tary problems, compared to data driven ones: (i) they are built
from biological characters that are not directly linked with
growth, mortality and recruitment, and (ii) the intra-specific
variability of those characters is high. These two points jointly
hinder the calibration of growth, mortality and recruitment
models with low-variance parameters estimates.
As a consequence, we argue that the best strategy is to build
dynamic process groups. We hereafter discuss the pros and
cons of this strategy.
Contrary to the other strategies, the dynamic process strat-
egy is bound to a model. A drawback of this strategy is that the
ecological meaning of the groups may not be straightforward.
The priority in that strategy is not to build ecologically mean-
ingful groups to be subsequently used in a model, but rather to
use the model to build the groups and afterwards, a possible
ecological meaning is addressed. Moreover, the direct use of
dynamic variables to group species leads to a focus more on
phenomena than on mechanisms, with a gain in predictive
power being accompanied by a loss of explanatory capability.
It also needs time-series data from permanent sample plots,
which are few in the tropics although expanding.
Nevertheless, the dynamic process strategy can address, to
a certain extent, the possible lack of ecological meaning of the
groups. Growth groups, mortality groups or recruitment groups
do not necessarily hold an ecological meaning [70–72].
Crossing them will usually lead to a great number of small
groups corresponding to detailed behaviours (growth × mor-
tality × recruitment), with a given set of sub-models. There is
no reason why those small groups could not be clustered a pos-
teriori in order to match with broader “ecological” classifica-
tions which are more interpretable by ecologists. An advantage
is that the clustering can be done in various ways, according to
the questions asked by the researchers and without any neces-
sity to re-build the set of dynamics sub-models. For example,
consider species groups defined on the basis of δ
15
N and leaf
N content by ecophysiologists (e.g. [59]) wishing to predict the
long-term consequences of logging operations on the ability of
the stand to capture different N sources. They need to compare
the relative importance of their groups at the beginning of a sim-
ulation, before disturbance, and to predict them several years
after. Instead of calibrating growth, mortality and recruitment
sub-models adapted to each of their N groups, they could use
the small groups initially defined for dynamic modelling pur-
poses and of their associated sub-models, clustering them into
the N groups at each step of the simulation. The same operation
could be done with a pioneer/mid-tolerant/tolerant classifica-
tion, a δ
13
C classification or a commercial/non-commercial
one, depending on the objective. In particular, this strategy per-
mits the investigation of the potential effects of disturbances on
stand functions, through the modification of its diversity, which
is a particularly important issue [63]. The ecological data-
driven strategy would not allow the same flexibility, as it would
be too coarse, not providing enough groups to allow agglom-
eration into another classification.
Second, the underlying growth models that are used in the
dynamic process strategy can elucidate fundamental principles
of interest to ecologists. In fact, depending on the way they are
built, they can account for confounding factors such as diam-
eter, local competition, disturbance history and position in the
canopy, thus giving direct access to some kind of intrinsic
growth trait characterizing each species.
It has been argued that the dynamic process strategy tends
to produce too many groups [29]. However Tables II and III
show that the ecological data-driven strategy can lead to as
many groups and sometimes more than the dynamic process
strategy. Moreover, the number of parameters is more essential
than the number of groups. Changing from the ecological data-
driven strategy, which generally gives a small number of
groups, to the dynamic process strategy, which gives a greater
number of groups, can be strictly equivalent in terms of number
of estimated parameters in a model of forest dynamics. Con-
sider for example that a forest has been simplified into four eco-
logical data-driven groups, and a matrix model has been built
to predict their evolution after disturbance: growth, mortality
and recruitment sub-models have been calibrated for each of
the four groups of species, in order to obtain four sub-matrices.
Using the dynamic process strategy to obtain four growth
groups, four mortality groups and four recruitment groups inde-
pendent of each other will require the same number of parameters
794 S. Gourlet-Fleury et al.
to be estimated [57]. But decoupling the different components
potentially creates the identification of 4 × 4 × 4 = 64 types of
species behaviours (see Figs. 2 and 3 for a simplified illustra-
tion). This allows the global dynamics model to incorporate
more of the subtlety of potential reactions to disturbances
increasing the model’s power to assess possible effect on flo-
ristic diversity. Such a result could not be obtained by the sim-
ple refinement of ecological data-driven groups, as dividing
four groups into 64 groups would lead to data sets too small to
calibrate the sub-models.
Another consequence of the dynamic process strategy is that
it can take into account the high intra-specific variability of
dynamics behaviours during the life-cycle of plants. Any one
of the species studied is likely to be allocated to different groups
according to the life stage reached by its individuals. This is
coherent with the theoretical view of [50] and field observa-
tions [4, 14]. Ideally, the whole life cycle and particularly the
little-studied period from seeds to trees ≥ 10 cm dbh should be
split into several stages, each stage being the object of an inde-
pendent classification.
Finally, the dynamic process strategy also contributes in
reducing the variance in the parameter fitting, since it works
separately on each of the components modelled, and rebuilds
different groups of species according to the process under
focus. As a consequence, the dynamic process strategy should
be preferred in grouping species for modelling purposes.
6. CONCLUSION
Little evidence of the existence of universal groups of trop-
ical woody species can be found in the published work. Among
the tests of functional classifications suggested by [29] in order
to check the existence of such groups, we mainly addressed
congruency and concluded that it was, at best, limited. In the
absence of clearly identified universal groups of species within
tropical forests, we believe that the best strategy for simplifying
species diversity, in order to build efficient dynamics models
to predict the changes in forest structure after disturbance, is
to rely on the “dynamic process” strategy.
However, an important prospect is the potentiality to extrap-
olate an existing species classification to other forests, because
of the limited number of permanent plots surveyed across the
tropical world. This could be achieved by identifying traits
(other than those currently found in most studies) that could be
used as proxies of dynamics variables. The existing permanent
sample plots are ideal places to seek these proxies. Proxies for
growth, proxies for mortality, and proxies for recruitment
should be investigated to be consistent with the dynamic proc-
ess strategy. This would allow us to use this grouping strategy
with easily measurable criteria such as physiological or mor-
phological characters.
Acknowledgements: This work is issued from the EuroWorkshop
“Functional Groupings of Tropical Trees: Simplifying Species Com-
plexity as an Aid to Understanding Tropical Forests” funded by the
High-Level Scientific Conferences Human Potential programme of
the European Commission and held in Edinburgh in Dec. 2001. The
authors are grateful to Guillaume Cornu, who gave precious help for
realising Figures 2 and 3 illustrating the text. We also thank two anon-
ymous reviewers for their helpful remarks.
REFERENCES
[1] Alder D., The Preliminary Development of the CAFOGROM
Forest Growth Model, Internal consultancy report, ODA/CPATU
Silviculture Research Project, Belém, Brazil, 1994.
[2] Alder D., Silva J.N.M., An empirical cohort model for management
of Terra Firme forests in the Brazilian Amazon, For. Ecol. Manage.
130 (2000) 141–157.
[3] Alder D., Synnott T.J., Permanent Sample Plot Techniques for
Mixed Tropical Forest, Tropical Forestry Papers 25, Oxford Fores-
try Institute, Department of Plant Sciences, University of Oxford,
Oxford, 1992.
[4] Alvarez-Buylla E.R., Martinez-Ramos M., Demography and allo-
metry of Cecropia obtusifolia, a neotropical pioneer tree, an eva-
luation of the climax-pioneer paradigm for tropical rain forests, J.
Ecol. 80 (1992) 275–290.
[5] Assmann E., The Principles of Forest Yield Study, Pergamon Press,
Oxford, UK, 1970.
[6] Atta-Boateng J., Moser J.W., A method for classifying commercial
tree species of an uneven-aged mixed species tropical forest for
growth and yield model construction, For. Ecol. Manage. 104
(1998) 89–99.
[7] Aubréville A.M.A., La forêt coloniale: les forêts de l’Afrique Occi-
dentale Française, Société d’Éditions Géographiques, Paris, 1938.
[8] Bazzaz F.A., Dynamics of wet tropical forests and their species
strategies, in: Medina E., Mooney M.A., Vásquez-Yánes C. (Eds.),
Physiological ecology of plants of the wet tropics: proceedings of
an international symposium held in Oxatepec and Los Tuxtlas,
Mexico, June 29 to July 6, 1983, W. Junk, The Hague, 1984,
pp. 233–243.
[9] Bazzaz F.A., Pickett S.T.A., Physiological ecology of tropical suc-
cession: a comparative review, Annu. Rev. Ecol. Syst. 11 (1980)
287–310.
[10] Boscolo M., Buongiorno J., Condit R., A model to predict biomass
recovery and economic potential of a neotropical forest, in: Panayotou
T. (Ed.), Environment for Growth: Environmental Management for
Sustainability and Competitiveness in Central America, Harvard
Studies in International Development, Harvard University Press,
Cambridge, Massachusetts, 2001, p. 608.
[11] Bossel H., Krieger H., Simulation model of natural tropical forest
dynamics, Ecol. Model. 59 (1991) 37–71.
[12] Budowski G., The distinction between old secondary and climax
species in tropical central American lowland forests, Trop. Ecol. 11
(1970) 44–48.
[13] Carey E.V., Brown S., Gillespie A.J.R., Lugo A.E., Tree mortality
in mature lowland tropical moist and tropical lower montane moist
forests of Venezuela, Biotropica 26 (1994) 255–265.
[14] Clark D.A., Clark D.B., Assessing the growth of tropical rain forest
trees: issues for forest modeling and management, Ecol. Appl. 9
(1999) 981–997.
[15] Collinet F., Essai de regroupements des principales espèces struc-
turantes d’une forêt dense humide d’après l’analyse de leur réparti-
tion spatiale, Thèse de doctorat, Université Claude Bernard-Lyon I,
Lyon, 1997.
[16] Condit R., Research in large, long-term tropical forest plots, Trends
Ecol. Evol. 10 (1995) 18–22.
[17] Condit R., Hubbell S.P., Foster R.B., Mortality and growth of a
commercial hardwood “el cativo”, Prioria copaifera, in Panama,
For. Ecol. Manage. 62 (1993) 107–122.
[18] Condit R., Sukumar R., Hubbell S.P., Foster R.B., Predicting popu-
lation trends from size distributions: a direct test in a tropical tree
community, Am. Nat. 152 (1998) 495–509.
[19] Crow T.R., A rainforest chronicle: a 30-year record of change in
structure and composition at El Verde, Puerto Rico, Biotropica 12
(1980) 42–55.
Dynamic species groups in tropical forests 795
[20] Davies S.J., Tree mortality and growth in 11 sympatric Macaranga
species in Borneo, Ecology 82 (2001) 920–932.
[21] Denslow J.S., Gap partitioning among tropical rainforest trees, Bio-
tropica 12 (1980) 47–55.
[22] Denslow J.S., Tropical rainforest gaps and tree species diversity,
Annu. Rev. Ecol. Syst. 18 (1987) 431–451.
[23] Favrichon V., Classification des espèces arborées en groupes fonc-
tionnels en vue de la réalisation d’un modèle de dynamique de peu-
plement en forêt guyanaise, Rev. Écol. (Terre et Vie) 49 (1994)
379–403.
[24] Favrichon V., Modèle matriciel déterministe en temps discret.
Application à l’étude de la dynamique d’un peuplement forestier
tropical humide (Guyane française), Thèse de doctorat, Université
Claude Bernard-Lyon I, Lyon, 1995.
[25] Favrichon V., Gourlet-Fleury S., Dessard H., Bar-Hen A., Parcelles
permanentes de recherche en forêt dense tropicale humide. Élé-
ments pour une méthodologie d’analyse de données, Série FORA-
FRI, Vol. 14, CIRAD, Montpellier, 1998.
[26] Felfili J.M., Growth, recruitment and mortality in the Gama gallery
forest in central Brazil over 6 year period (1985–1991), J. Trop.
Ecol. 11 (1995) 67–83.
[27] Finegan B., Camacho M., Zamora N., Diameter increment patterns
among 106 tree species in a logged and silviculturally treated Costa
Rican rain forest, For. Ecol. Manage. 121 (1999) 159–176.
[28] Franc A., Gourlet-Fleury S., Picard N., Introduction à la modélisa-
tion des forêts hétérogènes, ENGREF, Nancy, 1999.
[29] Gitay H., Noble I.R., What are functional types and how should we
seek them? in: Smith T.M., Shugart H.H., Woodward F.I. (Eds.),
Plant Functional Types: Their Relevance to Ecosystem Properties
and Global Change, International Geosphere-Biosphere Pro-
gramme, Vol. 1, Cambridge University Press, Cambridge, 1997,
pp. 3–19.
[30] Gitay H., Noble I.R., Connell J.H., Deriving functional types for
rain-forest trees, J. Veg. Sci. 10 (1999) 641–650.
[31] Gourlet-Fleury S., Modélisation individuelle spatialement explicite
de la dynamique d’un peuplement de forêt dense tropicale humide
(dispositif de Paracou, Guyane française), Thèse de doctorat, Uni-
versité Claude Bernard-Lyon I, Lyon, 1997, 2 volumes.
[32] Gourlet-Fleury S., Dispositif sylvicole expérimental de Paracou
(Guyane française): aperçus sur l’état et la dynamique des peuple-
ments 13 ans après installation, rapport technique, Silvolab, Kourou,
Guyane et Cirad-Forêt, Montpellier, 2000, 2 volumes.
[33] Gourlet-Fleury S., Houllier F., Modelling diameter increment in a
lowland evergreen rain forest in French Guiana, For. Ecol. Manage.
131 (2000) 269–289.
[34] Harcombe P.A., Tree life tables: simple birth, growth and death
data encapsulate life histories and ecological roles, Bioscience 37
(1987) 557–568.
[35] Hartshorn G.S., Neotropical forest dynamics, Biotropica 12 (1980)
23–30.
[36] Hladik A., Dynamique d’une forêt équatoriale africaine: mesures
en temps réel et comparaison du potentiel de croissance des diffé-
rentes espèces, Acta Oecol. Oecol. Gen. 3 (1982) 373–392.
[37] Hubbell S.P., Foster R.B., La estructura espacial en gran escala de
un bosque neotropical, Rev. Biol. Trop. 35 (1987) 7–22.
[38] Huth A., Ditzer T., Long-term impacts of logging in a tropical rain
forest - a simulation study, For. Ecol. Manage. 142 (2001) 33–51.
[39] Knight D.H., A phytosociological analysis of species-rich tropical
forest on Barro Colorado Island, Panama, Ecol. Monogr. 45 (1975)
259–284.
[40] Köhler P., Ditzer T., Huth A., Concepts for the aggregation of tro-
pical tree species into functional types and the application to
Sabah’s lowland rain forests, J. Trop. Ecol. 16 (2000) 591–602.
[41] Korning J., Balslev H., Growth rates and mortality patterns of tro-
pical lowland tree species and the relation to forest structure in
Amazonian Ecuador, J. Trop. Ecol. 10 (1994) 151–166.
[42] Lahoreau G., Picard N., Gourlet-Fleury S., Grouping species to
model forest dynamics: a case study of a forest in the Central Afri-
can Republic, Bois For. Trop. 271 (2002) 89–100.
[43] Lang G.E., Knight D.H., Tree growth, mortality, recruitment, and
canopy gap formation during a 10-year period in a tropical moist
forest, Ecology 64 (1983) 1075–1080.
[44] Lavorel S., Garnier E., Predicting changes in community composi-
tion and ecosystem functioning from plant traits: revisiting the
Holy Grail, Funct. Ecol. 16 (2002) 545–556.
[45] Lavorel S., McIntyre S., Landsberg J., Forbes T.D.A., Plant func-
tional classifications: from general groups to specific groups based
on response to disturbance, Trends Ecol. Evol. 12 (1997) 474–478.
[46] Lieberman D., Lieberman M., Hartshorn G., Peralta R., Growth
rates and age-size relationships of tropical wet forest trees in Costa
Rica, J. Trop. Ecol. 1 (1985) 97–109.
[47] Lortet J., Formation de groupes d’espèces homogènes pour la crois-
sance dans la forêt dense tropicale humide d’Uppangala, Inde,
Mémoire de DEA, Université Claude Bernard Lyon 1, Lyon, 1998.
[48] Manokaran N., Kochumen K.M., Recruitment, growth and morta-
lity of tree species in a lowland dipterocarp forest in Peninsular
Malaysia, J. Trop. Ecol. 3 (1987) 315–330.
[49] Manokaran N., Kochumen K.M., Tree growth in primary lowland
and hill dipterocarp forests, J. Trop. For. Sci. 6 (1994) 332–345.
[50] Oldeman R.A.A., Van Dijk J., Diagnosis of the temperament of tro-
pical rain forest trees, in: Gomez-Pompa A., Whitmore T.C.,
Hadley M. (Eds.), Rain Forest Regeneration and Management,
UNESCO - Man and the Biosphere Series, Vol. 6, The Parthenon
Publishing Group, Paris, 1991, pp. 21–63.
[51] Ong R., Kleine M., DIPSIM: A Dipterocarp Forest Growth Simu-
lation Model for Sabah, FRC Research Papers 2, Forestry Depart-
ment, Sabah, Malaysia, 1996.
[52] Pascal J.P., Pélissier R., Structure and floristic composition of a tro-
pical evergreen forest in south-west India, J. Trop. Ecol. 12 (1996)
191–214.
[53] Pélissier R., Pascal J.P., Two-year tree growth patterns investigated
from monthly girth records using dendrometer bands in a wet ever-
green forest in India, J. Trop. Ecol. 16 (2000) 429–446.
[54] Phillips O.L., Gentry A.H., Increasing turnover through time in tro-
pical forests, Science 263 (1994) 954–958.
[55] Phillips P.D., Yasman I., Brash T.E., van Gardingen P.R., Grouping
tree species for analysis of forest data in Kalimantan (Indonesian
Borneo), For. Ecol. Manage. 157 (2002) 205–216.
[56] Picard N., Franc A., Are ecological groups of species optimal for
forest dynamics modelling? Ecol. Model. 163 (2003) 175–186.
[57] Picard N., Gourlet-Fleury S., Sist P., Using process-dependent
groups of species to model the dynamics of a tropical rain-forest, in:
Amaro A., Reed D., Soares P. (Eds.), Modelling Forest Systems,
CAB International Publishing, Wallingford, 2003, pp. 237–248.
[58] Raunkiaer C., The Life-forms of Plants and Statistical Plant Geo-
graphy, Oxford University Press, Oxford, 1934.
[59] Roggy J.C., Prévost M.F., Gourbiere F., Casabianca H., Garbaye J.,
Domenach A.M., Leaf natural
15
N abundance and total N concen-
tration as potential indicators of plant N nutrition in legumes and
pioneer species in a rainforest of French Guiana, Œcologia 120
(1999) 171–182.
[60] Rollet B., Étude quantitative d’une forêt dense humide sempervi-
rente de Guyane vénézuelienne, Thèse de doctorat, Université de
Toulouse, Toulouse, 1969.
[61] Rollet B., L’architecture des forêts denses humides sempervirentes
de plaine, CTFT, Nogent-sur-Marne, 1974.
796 S. Gourlet-Fleury et al.
[62] Shugart H.H., A Theory of Forest Dynamics: The Ecological Impli-
cations of Forest Succession Models, Springer Verlag, New York,
1984.
[63] Silver W.L., Brown S., Lugo A.E., Effects of changes in biodiver-
sity on ecosystem function in tropical forests, Conserv. Biol. 10
(1996) 17–24.
[64] Sist P., Nguyen-Thé N., Logging damage and the subsequent dyna-
mics of a dipterocarp forest in East Kalimantan (1990–1996), For.
Ecol. Manage. 165 (2002) 85–103.
[65] Swaine M.D., Population dynamics of moist tropical forest near
Kade, Ghana, in: Puig H. (Ed.), Atelier sur l’aménagement et la
conservation de l’écosystème forestier tropical humide, UNESCO,
IUFRO, FAO, Paris, 1992, pp. 40–61.
[66] Swaine M.D., Hall J.B., Alexander I.J., Tree population dynamics
at Kade, Ghana (1968–1982), J. Trop. Ecol. 3 (1987) 331–345.
[67] Swaine M.D., Whitmore T.C., On the definition of ecological spe-
cies groups in tropical rain forests, Vegetatio 75 (1988) 81–86.
[68] Turner I.M., The Ecology of Trees in the Tropical Rain Forest,
Cambridge Tropical Biology Series, Cambridge University Press,
Cambridge, 2001.
[69] Van Steenis C.G.G.J., Rejuvenation as a factor for judging the sta-
tus of vegetation types. The biological nomad theory, in: Study of
Tropical Vegetation. Proceedings of the Kandy symposium on
humid tropics vegetation, Kandy, Ceylon, 19–21 March 1956,
UNESCO, Paris, 1956, pp. 212–215.
[70] Vanclay J.K., Aggregating tree species to develop diameter incre-
ment equations for tropical rainforests, For. Ecol. Manage. 42
(1991) 143–168.
[71] Vanclay J.K., Mortality functions for North Queensland rainfo-
rests, J. Trop. For. Sci. 4 (1991) 15–36.
[72] Vanclay J.K., Modelling regeneration and recruitment in a tropical
moist forest, Can. J. For. Res. 22 (1992) 1235–1248.
[73] Wan Razali B.W.M., Development of a generalized forest growth
and yield modelling system for mixed tropical forests of peninsular
Malaysia, Ph.D. thesis, University of Washington, 1986.
[74] Westoby M., Leishman M., Categorizing plant species into functio-
nal types, in: Smith T.M., Shugart H.H., Woodward F.I. (Eds.),
Plant Functional Types: Their Relevance to Ecosystem Properties
and Global Change, IGBP Book Series, Vol. 1, Cambridge Univer-
sity Press, Cambridge, 1997, pp. 104–121.
To access this journal online:
www.edpsciences.org