Báo cáo lâm nghiệp: "A method for multiple intra-ring demarcation of coniferous trees" ppt
Bạn đang xem bản rút gọn của tài liệu. Xem và tải ngay bản đầy đủ của tài liệu tại đây (416.51 KB, 6 trang )
9
Ann. For. Sci. 63 (2006) 9–14
© INRA, EDP Sciences, 2006
DOI: 10.1051/forest:2005093
Original article
A method for multiple intra-ring demarcation of coniferous trees
Young-In (David) PARK*, Guillaume DALLAIRE, Hubert MORIN
Département des Sciences fondamentales, Université du Québec à Chicoutimi, 555 boulevard de l’Université, Saguenay, Québec, Canada
(Received 1 December 2004; accepted 28 September 2005)
Abstract – Earlywood (E) and latewood (L) are arbitrary concepts, by consequence, the E/L demarcation method is as well. The threshold
method has been widely used in wood anatomy as well as wood density. Because of the presence of the intra-annual variation in tree-ring
structure, however, the conventional threshold method needs adjustment in an objective and effective way. We suggest the analysis of the error
zone method for this adjustment. The method was tested with 500 radial cell files of mature balsam fir, and showed its potential as an objective,
robust and easily applicable adjustment tool.
multiple intra-ring demarcation / intra-ring variation / wall-lumen ratio / Mork’s definition / wood anatomy
Résumé – Une méthode pour la démarcation intra-cerne multiple de conifère. Le bois initial et le bois final sont des concepts arbitraires,
de même que leur démarcation. La méthode de seuil est appliquée généralement dans le domaine de l’anatomie et de la densité du bois. Mais,
la méthode conventionnelle du seuil nécessite des ajustements parce qu’il y a des variations dans la structure du cerne. Nous suggérons la
méthode de l’analyse de la zone d’erreur pour effectuer cet ajustement. La méthode suggérée a été vérifiée avec 500 files radiales de cellules
de sapin baumier matures, et elle a démontré son potentiel comme un moyen objectif, robuste et facile à appliquer.
démarcation intra-cerne multiple / variation intra-cerne / ratio parois-lumen / définition de Mork / anatomie du bois
1. INTRODUCTION
Earlywood (E) and latewood (L) demarcation for conifers
is generally based on the wall-lumen (W/L) relation of cells.
Mork’s definition has long been used in wood anatomy. Mork
suggested the division of E and L into a fixed intra-ring position
where the index value (= 2 × double cell wall thickness/cell
lumen) exceeds 1 ([9], see also [4]). Such a threshold principle
has been also widely used in wood density, a well-known tree-
ring characteristic related to the W/L relation of cells [12]. The
index value and wood density generally increase exponentially
from the beginning to the end of a tree ring [3, 5, 10, 12]. In an
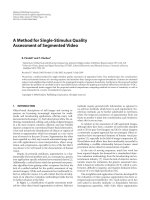
ideal case (Fig. 1A), the principle is easily applicable: a tree ring
begins with E cells and once the index (density) value exceeds
the given threshold, then all xylem cells produced are L cells.
In reality, however, there is a substantial variation in the
structure within tree ring, and it can, sometimes, be large
enough to exceed the given threshold (Fig. 1B). A formation
of a false ring [14] or a light ring [13] may be the most well-
known, extreme phenomenon of such cases. If the index
value(s) exceeds the given threshold in a given intra-ring zone,
a manual correction may be needed. However, a manual cor-
rection is costly in terms of time and labour, especially when
handling large data sets, and it can also be another source of
possible operating error. Furthermore, it is sometimes difficult
to decide where the demarcation position is when the index val-
ues oscillate just around the given threshold, especially for
some coniferous species like Picea sp., Abies sp., since they
have a relatively smooth E/L transition.
There have been many suggestions and modifications for E/L
demarcation in both fields (e.g. [2, 7, 8, 11]). However, the
aforementioned problems associated with application of the
threshold principle have not been studied in detail [10]. An
adjustment method is needed which is robust enough to deal
with large intra-ring variation, and works in an effective and
objective way which allows low time and labour expenditure,
but effective and reproducible decision on the demarcation
position. The mathematical approaches using the maximum
inflexion point (derivates) [1, 6] can be one possibility for that
purpose. They were, however, developed to put forward only
one demarcation position within a tree ring.
We present here a different approach incorporating these
intra-ring variations. It is not our intention to suggest a new
method for E/L demarcation, but to adjust and refine the con-
ventional threshold methods, e.g. Mork’s definition. The spe-
cific objectives of this paper are (1) to introduce an error zone
analysis method to deal with large intra-ring variation in an
objective and effective way, (2) to examine if the proposed
method handles the intra-ring variation correctly, and (3) to
apply this method for multiple intra-ring demarcation to mature
balsam fir.
* Corresponding author:
Article published by EDP Sciences and available at or />10 Y I. Park et al.
2. CELL DATA
Cell data were obtained from 20 mature balsam fir trees (on average
48 years old) growing naturally in Arvida (48° 26' N, 71° 09' W, 80 m
a.s.l.), a district of Saguenay, Quebec, Canada. The annual mean air
temperature of the site is 3.1 °C, and total rainfall is 652 mm. An
additional 259.4 mm falls as snow annually. Sample trees have been
subject to cambium monitoring since 1999 in the context of the project
“Study on the spruce budworm epicenter in Arvida”; ten defoliated and
ten control trees were sampled. Because there were no discernable dif-
ferences in the intra-ring profiles of W/L ratio between the groups, we
did not separate data from the defoliation and control groups. Small
wood samples were taken from the western side of each sample tree
at 1.8 m height after the end of the 2000 growing season. Any discern-
able abnormalities, such as compression wood or false ring formation,
were avoided. From each wood sample, transverse sections were
obtained using a rotary microtome at 10 µm and stained with 1% aque-
ous solution of safranin. Only the five most recently formed tree rings
(1996–2000) were analyzed in order to make sure that no juvenile
wood was involved. For each tree ring, five radial cell files with rel-
atively large tracheids were measured using the image analysis system
WinCELL [15]. These cells were not disturbed during development,
e.g. by the emergence of resin ducts. The parameters obtained were
cell number, cell diameter, lumen diameter, and single cell wall thick-
ness. Intra-ring position was calculated relative to the cell number, so
that the first cell of a radial cell file was set as the 1% and the last one
as the 100% of intra-ring position. W/L ratio for each cell was calcu-
lated as the mean single cell wall thickness on both sides of each cell
divided by its lumen diameter.
3. ERROR ZONE ANALYSIS METHOD
The method is based on the simple fact that cells are produced in
a sequence from earlywood to latewood regardless of index value and
not the inverse.
Therefore, when dividing a tree ring into E and L zones, the aim
of this method will be to classify cells in a radial cell file which contains
multiple E and L zones into only one earlywood and one latewood
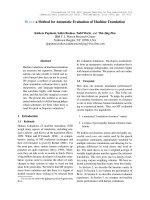
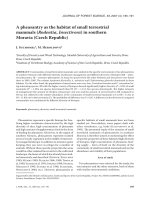
zone. Figure 2 illustrates an example with two artefacts (position 1
and 2) and one real latewood boundary (position 3). Before the selec-
tion process, a threshold for earlywood and latewood delimitation as
well as a buffer value should be given. For the given example, a value
of 0.25 is chosen as threshold corresponding to Mork’s definition and
0.0125 for buffer zone, which is 1/20 of the threshold.
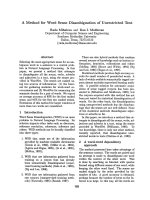
Figure 1. Intra-ring curve of wall-lumen ratio of tracheids. The mean curve of 500 radial cell files (A) and one example radial cell file (B) are
presented. The horizontal line indicates the early-late wood boundary so that the grey marked area above the line indicates the identified latewood
cells. The threshold 0.25 corresponds to the latewood definition by Mork (1928).
A method for multiple intra-ring demarcation 11
3.1. Step 1: Identification of temporal demarcation
positions
Cells should first be classified into two different zones either as E
or L zones depending on whether their values are over or below the
given threshold (Fig. 2). The first cell in each L-zone is identified as
a possible demarcation position. In the given example (Fig. 2, Step 1),
three possible demarcation positions are identified: cell number 3 for
position 1, 9 for position 2 and 15 for position 3, respectively.
3.2. Step 2: Determination of error zones
For each possible demarcation position, the associated error zones
should be determined. The underlying idea is that there should be no
L cells before the true demarcation position. Likewise, there should
be no E cells after the position. Therefore, all L cells before and all E
cells after the demarcation position are “error” and each group of these
cells generates the “error zone”. In the given example (Fig. 2, Step 2),
supposing the 2nd temporal demarcation position was true, then the
group of L cells (marked as error zone A) in E-zone and a group of E
cells (marked as error zone B) in L-zone will be the error zones. These
two zones generate the error in association with the selection of the
2nd position.
3.3. Step 3: Calculation of error factor
The error factor is generated from the magnitude of divergence to
the given threshold and the length of error zones identified. In the given
Figure 2. Schematic representation of the analysis of the error zone method for intra-ring demarcation. Presented is the wall-lumen (W/L) ratio
of tracheids. The threshold 0.25 corresponds to the latewood definition by Mork (1928).
12 Y I. Park et al.
example (Fig. 2, step 3), error zone A consists of three cells which gen-
erate an error.
The magnitude of divergence of the error zone (D
zone
) is calculated
as
where D(i) = absolute value of difference between the value of the
selected cell and that of the threshold of ith cell.
Length of error zone (L
zone
) is defined as
L
zone
= No. of cells in error zone.
The error factor for an error zone (EF
zone
) is defined as
EF
zone
= L
zone
3
× D
zone
where the exponential 3 gives more weight to the length of error zone
than to the magnitude.
The choice of the exponential of 3 was empirical; it was chosen
because the squares (exponential 2) did not deliver satisfactory results
in the given data set. In case the individual cell variation is much larger,
a higher order, e.g. exponential 4, is recommended.
The final error factor for the selected demarcation position (EF
position
)
is calculated as
EF
position
= EF
zone1
, EF
zone2
, …
EF
position
is calculated for each identified temporal position; then,
the position with the lowest EF
position
is selected as the real demarca-
tion position, because EF
position
will have the value of 0 in an ideal
case (c.f. Fig. 1A).
For the given example in Figure 2 Step 1; if 1st position was
selected, zone E2 and E3 will generate error. So,
EF
position 1
= EF
zone E2
+ EF
zone E3
= + 3
3
×
+ 4
3
= 3
3
× (0.04 + 0.04 + 0.02) + 4
3
× (0.03 + 0.03 + 0.02 + 0.01) = 2.70 +5.76 = 8.46.
Likewise,
EF
position2
= EF
zone L1
+ EF
zone E3
= 3
3
× (0.02 + 0.05 + 0.04)
+ 4
3
× (0.03 + 0.03 + 0.02 + 0.01) = 2.97 + 5.76 = 8.73
EF
position3
= EF
zone L1
+ EF
zone L2
= 3
3
× (0.02 + 0.05
+ 0.04) + 2
3
× (0.05 + 0.08) = 2.97 + 1.04 = 3.08.
Position 3 has the lowest EF position value. Thus, the presented
method chooses the real latewood boundary.
3.4. Step 4. Application of buffer zone
In some cases, the 2nd position in Figure 2 step 1 will be selected,
which is considered incorrect according to the given definition (Fig. 3,
step 4). This can happen when the error factor generated by zone B is
smaller than the one generated by zone A, even when zone B is longer,
although our method puts most of the weight into the zone length. This
is because the W/L ratio is inherently close to the given threshold value
D
zone
Di()
i 1=
n
∑
=
Di()
i 3=
5
∑
Di()
i 11=
14
∑
Figure 3. An example of multiple divisions within a tree ring. All tracheids in a radial cell file are classified into four different groups using
the error zone analysis method. The given threshold of 0.25 corresponds to Mork’s definition (1928) and each conventional earlywood and
latewood zone is subdivided one more time. For threshold, the given threshold value of 0.25 is halved (0.125) and doubled (0.5) arbitrarily.
The arrow and stars show the cells whose classification is changed with/without adjustment.
A method for multiple intra-ring demarcation 13
with increasing intra-ring position (c.f. Fig. 1A). For such a case, we
apply a buffer zone. The buffer is a value added to the given threshold
and defines an additive limit zone where certain variations can be
ignored (Fig. 2, step 4). So, when the W/L ratio of a selected demar-
cation position does not exceed the buffer zone (threshold + buffer)
and when the following zone is longer, then the demarcation position
will shift to the next position (e.g. to 2nd position in Fig. 2, step 4).
Otherwise, the first selected position will be accepted. The 1/20 of the
threshold value was found to be adequate (0.25/20 = 0.0125) for the
given data set. It can be adjusted depending on the data variance.
4. EVALUATION OF THE METHOD
FOR MULTIPLE INTRA-RING DEMARCATION
The method was tested with an example data set modified
slightly from the measured data of balsam fir in order to give
an extreme intra-ring variation (Fig. 3). The given threshold of
0.25 in Figure 3 corresponds to Mork’s definition and each of
the conventional E and L zones are arbitrarily subdivided one
more time by halving (0.125) and doubling (0.5) the given
threshold value. For convenience, we called the subdivided
zones Early-earlywood (EEw), Late-earlywood (LEw), Early-
latewood (ELw), and Late-latewood (LLw) in a sequence.
The W/L ratio increases exponentially towards the end of the
cell file, as expected (c.f. Fig. 1A). However, as seen in
Figure 1B, there are important variations. For instance, in LEw
zone (corresponding to the conventional transition zone) in
Figure 3, the 7th cell (marked by an arrow) is lower than the
threshold. It should belong to the EEw zone in the narrow sense
of the application, even though it was produced apparently later
than these cells. More evidence can be found in the later part
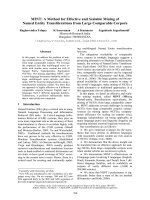
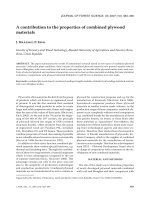
Figure 4. Frequency of problematic zone (a) and mean beginning position and its standard deviation (b) without (filled symbols) and with
(empty symbols) adjustment. The mean position of transition to late-earlywood (LEw), early-latewood (ELw) and late-latewood (LLw) is marked
with circle, triangle, and square, respectively. The vertical bars indicate the mean beginning position of each intra-ring zone of tree rings which
contain no problematic zone. Y-axis is arbitrary and adjusted for better visualisation.
14 Y I. Park et al.
of the same zone. There are four cells (marked by a star) which
exceed the threshold. When the conventional method is strictly
applied, three of them should belong to the ELw zone, and even
the last cell has the characteristic for the LLw zone. However,
these cells are apparently produced before the real latewood
cells. The result indicates that the analysis of error zone method
is robust and reproducible, despite large intra-ring variation,
and that it suits our visual judgement.
5. MULTIPLE INTRA-RING DEMARCATION
OF BALSAM FIR TREES
We examined 500 radial cell files from the sample trees with
an Excel macro developed in our laboratory. The macro was
written in the WinCell [15] data format and it took just a few
seconds for the adjustment of one Excel data file. Even though
we selected “normal” tree rings without any visible structural
abnormality, we observed a high frequency of problematic
zones where the error zones were generated (Fig. 4a). The most
problematic zones were found in the earlier intra-ring part,
where the systematically increasing trend is not yet developed;
e.g., some 66% of all cell files show at least one problematic
zone in the transition to LEw. In these cell files, the transition
was set at 36 ± 1.1% of the intra-ring position without adjust-
ment, but with adjustment, it was set about 23% later, at 59 ±
0.7% (Fig. 4b). This reinforces the necessity of the adjustment,
because in other cell files with no problematic zones, it took
place at 55 ± 1.1% (Fig. 4b). Once increasing tendency
becomes evident, the differences reduce progressively, but
about one-third of cell files studied still have problematic zones
in the conventional transition to latewood (ELw in Fig. 4b). The
existence of such an important proportion of problematic zones
can imply a high probability of data contamination. In Figure 1b,
for example, one would consider the year “normal”, when cells
were grouped without adjustment, and averaged for each group,
since cells of 66 ~ 71% of relative position will be grouped as
L because of their high ratio. In reality, these cells are appar-
ently produced earlier then real L cells. After adjustment as pre-
sented in this paper, these cells will be grouped as E cells, when
using only the conventional E/L division, or more precisely as
LEw cells in the four subdivisions (Fig. 3). It will result in an
increase in mean value, indicating something happened during
the formation of this part of the tree ring. If one can observe a
similar pattern of W/L ratio in most of the sampled trees, it may
reflect some changes in growing conditions and provide valu-
able information on the environmental conditions affecting the
formation of this part of the tree ring, such as early growing sea-
son precipitation [14].
6. CONCLUSION
Earlywood and latewood are arbitrary concepts, by conse-
quence, the E/L demarcation method is as well. There have
been various suggestions for E/L demarcation. However, it is
imperative that the method be objective and reproducible
regardless which methods are applied. The presence of prob-
lematic zones in our data indicates that the conventional thresh-
old method needs an adjustment; we suggest the analysis of
error zones for that purpose. Because the analysis was con-
ducted with more or less “normal” tree-rings, the practicability
of the presented method should be tested with a variety of tree-
ring structures. In our data set and simulation, the error factor
analysis worked robustly, objectively and in an easily repro-
ducible way. In addition, with the possibility of adjusting the
power and buffer value, it is very data-adaptable.
Acknowledgments: This study was financed by the Natural Sciences
and Engineering Research Council of Canada and Consortium de
recherché sur la forêt boréale commerciale.
REFERENCES
[1] Barbour R.J., Bergqvist G., Larsson B., Johnson J.A., New methods
for evaluating intraring X-ray densitometry data: maximum deriva-
tive methods as compared to Mork’s Index, in: Zhang S.Y., Gosselin
R., Chauret G. (Eds.), Timber management toward wood quality
and end product value; Proceedings of the CTIA/UFRO Internatio-
nal wood quality workshop, August 18–22, Quebec City, Canada,
1997, pp. II-61–II-67.
[2] Creber G.T., Chaloner W.G., Environmental influences on cambial
activity, in: Iqbal I. (Ed.), The vascular cambium, John Wiley &
Sons, New York, 1990, pp. 159–199.
[3] Decoux V., Varcin E., Leban J M., Relationships between the
intra-ring wood density assessed by X-ray densitometry and optical
anatomical measurements in conifers. Consequences for the cell wall
apparent density determination, Ann. For. Sci. 61 (2004) 251–262.
[4] Denne M.P., Definition of latewood according to Mork (1928),
IAWA Bull. 10 (1988) 59–62.
[5] Ivkovica M., Rozenberg P., A method for describing and modelling
of within-ring wood density distribution in clones of three conife-
rous species, Ann. For. Sci. 61 (2004) 759–769.
[6] Koubaa A., Zhang S.Y., Makni S., Defining the transition from
early wood to latewood in black spruce based on intra-ring wood
density profiles from X-ray densitometry, Ann. For. Sci. 59 (2002)
511–518.
[7] Mellerowicz E.J., Coleman W.K., Riding R.T., Little C.H.A.,
Periodicity of cambial activity in Abies balsamea. 1. Effects of tem-
perature and photoperiod on cambial dormancy and frost hardiness,
Physiol. Plant. 85 (1992) 515–525.
[8] Mitchell M.D., Denne M.P., Variation in density of Picea sitchen-
sis in relation to within-tree trends in tracheid diameter and wall
thickness, Forestry 70 (1997) 47–60.
[9] Mork E., Die Qualität des Fichtenholzes unter besonderer Rück-
sichtnahme auf Schleif- und Papierholz, Der Papier-Fabrikant 48
(1928) 741–747.
[10] Park Y.I. Zur Auswirkung von Umwelteinflüssen auf das Wachs-
tum von Fichten (Picea abies (L.) Karst.) auf der Grundlage bilda-
nalytischer Verfahren zur Quantifizierung der Zellstruktur an Holz-
querschnittsflächen, Schriftenreihe Freiburg Forstliche Forschung
(FFF) Vol. 8, 2000.
[11] Savva Y., Schweingruber F.H., Milyutin L., Vaganov E.A., Genetic
and environmental signals in tree rings from different provenances
of Pinus sylvestris L. planted in the southern taiga, central Siberia,
Trees 16 (2002) 313–324.
[12] Schweingruber F.H., Der Jahrring: Standort, Methodik, Zeit und
Klima in der Dendrochronologie, Haupt, Bern, 1983.
[13] Wang L., Payette S., Bégin Y., Relationships between anatomical
and densitometric characteristics of black spruce and summer tem-
perature at tree line in northern Quebec, Can. J. For. Res. 32 (2002)
477–486.
[14] Wimmer R., Strumia G., Holawe F., Use of false rings in Austrian
pine to reconstruct early growing season precipitation, Can. J. For.
Res. 30 (2000) 1691–1697.
[15] WinCELL, version 2001a, Régent Instruments Inc., Quebec,
Canada, 2001.