Báo cáo lâm nghiệp: "The angular distribution of diffuse photosynthetically active radiation under different sky conditions in the open and within deciduous and conifer forest stands of Quebec and British Columbia, Canada" pptx
Bạn đang xem bản rút gọn của tài liệu. Xem và tải ngay bản đầy đủ của tài liệu tại đây (363.35 KB, 11 trang )
43
Ann. For. Sci. 63 (2006) 43–53
© INRA, EDP Sciences, 2006
DOI: 10.1051/forest:2005096
Original article
The angular distribution of diffuse photosynthetically active radiation
under different sky conditions in the open and within deciduous and
conifer forest stands of Quebec and British Columbia, Canada
Fidji GENDRON
a,b
*, Christian MESSIER
a
, Ernest LO
a
, Philip G. COMEAU
c
a
Groupe de recherche en écologie forestière interuniversitaire (GREFi), Département des sciences biologiques, Université du Québec à Montréal,
case postale 8888, succursale Centre-Ville, Montréal, QC H3C 3P8, Canada
b
Current address: Luther College, University of Regina, Regina, Saskatchewan, S4S 0A2, Canada
c
Department of Renewable Resources, University of Alberta, Faculty of Agriculture, Forestry and Home Economics, University of Alberta,
442 Earth Sciences Building, Edmonton, Alberta T6G 2E3, Canada
(Received 17 December 2004; accepted 24 August 2005)
Abstract – The angular distribution of diffuse photosynthetically active radiation (PAR) was characterised in the open and beneath deciduous
and conifer forests in Quebec and British Columbia, Canada, under overcast and clear sky conditions, using a restricted field of view light sensor
and hemispherical canopy photographs. The angular distribution of PAR was described by the relative light reading (RLR). In the open on
overcast days, light was best characterized using the standard overcast sky distribution with the light intensity at the zenith set to four to five
times greater than the light intensity at the horizon. RLR under forest stands was found to decrease with decreasing elevation angles under both
overcast and clear sky conditions. Aspen (Populus tremuloides Michx.) and Jack pine (Pinus banksiana Lamb.) stands transmitted more light
from a relatively wider angle around the zenith than the spruce (Picea glauca (Moench) Voss and Picea mariana (Mill.) BSP) stands, which
transmitted light mainly from the zenith. RLR estimated with the hemispherical canopy photographs (RLR
hc_corr
) generally provided a
comparable prediction of the effect of the canopy composition on the angular distribution of PAR.
coniferous forest / deciduous forest / diffuse radiation / photosynthetically active radiation
Résumé – Distribution de la radiation photosynthétiquement active sous différentes conditions de ciel en milieu ouvert et sous
peuplements forestiers de feuillus et de conifères au Québec et en Colombie-Britannique, Canada. La distribution angulaire de la radiation
photosynthétiquement active (PAR) a été mesurée en milieu ouvert et sous peuplements de feuillus et de conifères situés au Québec et en
Colombie-Britannique lors de journées nuageuses et ensoleillées à l’aide d’un senseur à angle restreint et de photographies hémisphériques. La
distribution angulaire du PAR a été estimée par une lecture de lumière relative (LLR). En milieu ouvert lors de journées nuageuses, LLR
déclinait du zénith vers l’horizon, avec des mesures au zénith de quatre à cinq fois plus élevées qu’à l’horizon. LLR mesurée sous couvert
forestier déclinait du zénith vers l’horizon lors de journées nuageuses et ensoleillées. Les peuplements de peupliers (Populus tremuloides
Michx.) et de pins gris (Pinus banksiana Lamb.) ont transmis relativement plus de PAR sous un angle plus large autour du zénith que les
peuplements d’épinettes (Picea glauca (Moench) Voss et Picea mariana (Mill.) BSP) qui ont principalement transmis du PAR autour du zénith.
La distribution angulaire du PAR estimée avec les LLR mesurées avec la photographie hémisphérique sous les différents couverts forestiers
correspondait de façon générale aux résultats obtenus avec le senseur.
forêt de conifères / forêt feuillue / rayonnement diffus / rayonnement photosynthétiquement actif
1. INTRODUCTION
There have been very few studies on how understory light
is distributed over elevation and azimuth angles, and on the
influence of forest species composition in determining this
angular distribution. The angular distribution of diffuse PAR
in the understory may be an important factor in shaping crown
morphology and in influencing light interception from the
understory vegetation layers. For example, the crowns of four
tropical deciduous tree species have been found to be oriented
toward the direction of maximum diffuse light penetration [1].
Similarly, leaves of the understory juvenile tree Pseudopanax
crassifolius were oriented toward the largest gaps presumably
in order to increase diffuse light interception [13]. Crowns of
Pinus sylvestris were oriented toward southerly directions, the
directions with the greatest incoming solar radiation, when the
light availability was not reduced by local competition [34].
The aim of this study is to characterize the angular distribution
of PAR in both open and forest understory conditions, for clear
and overcast skies, and over a range of sites using light sensor
measurements and hemispherical photographs. This study is
limited in scope to the characterization of the diffuse component
* Corresponding author:
Article published by EDP Sciences and available at or />44 F. Gendron et al.
of PAR only. In addition, the most common method of meas-
uring the angular distribution of PAR, that of hemispherical
photography, is evaluated by comparison to reference meas-
urements made with the light sensor.
The first objective in this study is to characterize the above-
canopy diffuse light distribution for the study sites. There have
been many studies of the open-sky diffuse light distribution,
and most have characterized the light distribution across the sky
in open conditions, for overcast skies [5, 21, 28, 41]. There is
an ongoing debate, however, as to the precise form of the above-
canopy diffuse light distribution, with most of the debate cen-
tered on the well-known standard overcast sky (SOC) and uni-
versal overcast sky (UOC) models. The SOC model predicts
that the diffuse light intensity is highest at the zenith and
decreases toward the horizon [5, 28]. This contrasts with the
isotropic and uniform sky light distribution found in the UOC
[7, 8]. The SOC formula was initially developed by Moon and
Spencer [28]. They suggested that the zenith-to-horizon radi-
ance ratio (1 + b) should equal 3, making the zenith three times
brighter than the horizon. In studies on global radiation (300–
3000 nm), the b parameter has been found to vary greatly (from
1 to 5) according to the wavelengths measured, the cloud den-
sity, and the cloud height [21, 41], with the mean and modal
value occurring at 1.23 [5]. In the few studies that have char-
acterized the PAR band (400–700 nm), the decrease in bright-
ness from the zenith to the horizon was equally variable, with
the b parameter ranging from 2 to almost 5 [19, 21]. In general
the open-sky diffuse light distribution (as characterized by
overcast skies) seems to vary with angle, with its exact func-
tional form being site-dependent.
The diffuse sky brightness also includes a contribution from
clear skies. The clear sky diffuse light distribution is not well
known and is neglected in most studies and light models. It can
be measured by detecting the angular distribution of radiance
during clear conditions, from all directions except the position
of the solar disc. In this study both the overcast and clear-sky
diffuse light distributions were characterized over different
study sites, and the suitability of the SOC and UOC equations
to represent these distributions was assessed.
The second objective of this study was to characterize the
angular distribution of diffuse PAR in stands of aspen (Populus
tremuloides Michx.), Jack pine (Pinus banksiana Lamb.) and
spruce (Picea glauca (Moench) Voss and Picea mariana
(Mill.) BSP) in Quebec, and stands of red alder (Alnus rubra
Bong.) and Douglas-fir (Pseudotsuga menziesii (Mirb.)
Franco) in British Columbia, Canada. The understory PAR dis-
tribution is determined by the attenuation of the above-canopy
light by foliage and branches and, therefore, is expected to
depend on and to reflect the forest canopy structure. The effect
of forest stands on total light transmission [25, 26], spectral
changes [33] and total light variability [18] have been well-doc-
umented in the literature. However, few studies have explored
the variation of the understory light as a function of elevation
and azimuth angles (i.e. the angular distribution of PAR), and
how this distribution might be influenced by the forest species
composition. For example, although the light beneath forest
canopies is generally believed to originate mainly from directly
overhead [29, 38, 39], some studies also report that lateral light
coming from mid to low elevation angles represent a sizable
component of total light that reaches understory plants [12, 13].
Characteristics of forest stands that might influence the varia-
tion in angular distribution of PAR include: crown shape,
branch and leaf distribution and orientation within the canopy,
leaf area density within the canopy and the degree of overlap
which occurs between the individual trees that comprise a
stand. As these characteristics vary with the species composi-
tion of the canopy, the understory PAR distribution is expected
to be a function of forest species composition as well.
With few exceptions [20, 43], the angular distribution of
PAR beneath plant canopies has been estimated with the hemi-
spherical canopy photograph technique [7–9, 22, 30]. How-
ever, photographic analysis only considers light that penetrates
directly through openings in the canopy and does not take into
account light transmission and reflection by vegetation, the
penumbra effect and the detailed and uneven distribution of dif-
fuse light brightness [8, 10, 44]. A restricted field of view light
sensor, however, is capable of measuring the total (i.e. all con-
tributions from vegetation scattering or transmission) quantity
of light received in the understory as a function of angle [19,
20]. Few other studies have used such a light sensor [19, 20],
however, mainly because its implementation is time-consum-
ing, which limits the number of microsites that can be sampled.
For the third objective of this study, the light sensor is used as
a reference against which the accuracy of the hemispherical
photograph method is compared and evaluated, in the context
of measuring the angular distribution of diffuse PAR.
2. MATERIALS AND METHODS
2.1. Study sites
The study sites were located at the Duparquet Lake Research Sta-
tion in Quebec and on Vancouver Island in British Columbia, Canada.
Forest stands at the Duparquet Lake Research Station (48º 30' N,
79º 20' W) originated from a 1923 fire and were characterised by
mature stands of aspen, Jack pine, and spruce. One of the spruce stands
originated from a 1760 fire. The Quebec stands were all located on
clay soils. Forest stands on Vancouver Island were located in a 89-
year-old Douglas-fir stand and a 45-year-old red alder stand. The
Douglas-fir stand was located near Cowichan Lake on southern Van-
couver Island, British Columbia (48º 49' N, 124º 07' W). This forest
stand originated from a 1909 fire and the soils were Humo-ferric Pod-
zols and of sandy loam texture [42]. The canopy was uniform with a
subcanopy of western hemlock (Tsuga heterophylla (Raf.) Sarg.) and
western redcedar (Thuja plicata Donn ex D. Don). The red alder stand
was located close to Sarita Lake (48º 55' N, 124º 54' W), approximately
90 km north-west of Cowichan Lake. Sitka spruce (Picea sitchensis
(Bong.) Carr.) was present in the subcanopy.
Five circular, 11.28 m radius plots were installed in each stand for
measurement purposes with the Douglas-fir stand being large enough
to contain six plots. A visual assessment of the canopy was made
before installing each plot to ensure that there was no slope and that
the canopy was uniform, closed, and composed predominantly (more
than 80%) of the desired canopy species. There was at least 20 m of
similar habitat on all sides of the selected plots, and adjacent plots
within a stand were separated by at least 20 m. The separation distance
between each plot minimized redundant measurement of the same
trees for different plots. The center of each plot was located at least 2 m
from the closest stem in the middle of a group of trees. Since the objec-
tive of the study was to examine the effect of the forest canopy on
the angular distribution of PAR, understory vegetation taller than 1 m
Angular distribution of diffuse PAR 45
was cut within each plot. This operation was required in the aspen, Jack
pine and red alder plots. Understory vegetation in the spruce and Doug-
las-fir plots was minimal. Diameter at breast height and total tree
height were recorded within each plot for representative trees (Tab. I).
Stand age was estimated from tree ring counts taken from two average-
sized trees within each plot and from fire age. The live crown ratio was
calculated as the percentage of total tree height.
2.2. Technical information about the light sensor
The construction of the light sensor and the head is described in
Fielder and Comeau [16] and Grace [19], respectively. The light sensor
consisted of a gallium arsenide phosphide photodiode (Hamamatsu,
model G1117, Middlesex, NJ, USA). Photodiodes are particularly use-
ful for plant ecophysiological studies because they possess a very lin-
ear response to quantum flux over the 300 to 680 nm (i.e. PAR) range.
The light sensors measured radiance as quanta per unit time per unit
area from an area of sky subtending a 23.42° solid angle. The photo-
diode was glued onto the flat surface of a tubing of delrin rod which
was then inserted into an aluminium tube. The photodiode was con-
nected to a communication cable attached to a LI-COR datalogger
(model LI-1000, LI-COR Inc., Lincoln, NE, USA) which measured
the electrical current expressed in microAmps. The base of the sensor
body was filled with Dow Corning RTV silicon sealant to ensure it
was watertight. In order to restrict the viewing angle of the photodiode,
a 23.42° field of view head was built and then placed on the top of the
sensor body. The head consisted of a 62.34 mm long aluminium tube.
Rings of delrin rod were placed inside the aluminium tubing to serve
as baffles. Grace [19] reported that baffles were necessary as they
decrease stray light by 10 to 15%. Matte black paint was applied to
all the components in order to reduce light reflection inside the head.
Two light sensors were built according to this design. The two sensors
were calibrated twice in a large clearcut in July, and both sensors were
found to be highly correlated (Spearman's rank correlation coefficient
= 0.96). As the data presented in this study are based on relative light
readings, the slight difference in sensitivity observed between the two
sensors was unimportant.
Table I. Stand characteristics. N/A: data not available.
Stand
composition
Density
(No./ha)
Height
(m)
Live crown
ratio (%)
Average
DBH (cm)
Basal area
(m
2
·ha
–1
)
Light
(%)
Duparquet Lake Research Station, Quebec
Aspen 1 1100 N/A N/A 21 40 15.0
Aspen 2 1851 25 28 21 47 17.5
Aspen 3 775 27 23 22 32 19.5
Aspen 4 875 27 37 22 40 14.0
Aspen 5 1075 28 21 26 60 15.1
Jack pine 1 1276 25 42 19 40 16.3
Jack pine 2 1376 23 29 17 37 17.0
Jack pine 3 1075 22 18 19 34 15.9
Jack pine 4 1051 23 25 19 32 14.8
Jack pine 5 1026 23 31 20 34 12.2
Spruce 1 1701 18 63 16 36 6.9
Spruce 2 1751 17 50 17 42 8.2
Spruce 3 1526 17 56 16 31 10.1
Spruce 4 1501 16 57 17 38 10.9
Spruce 5 1951 19 N/A 15 37 5.1
Vancouver Island, British Columbia
Red alder 647 951 23 29 24 47 11.1
Red alder 648 725 23 50 24 38 8.9
Red alder 649 1151 27 33 22 48 7.8
Red alder 650 1226 20 36 26 70 9.6
Red alder 2921 1226 25 15 23 57 11.5
Douglas fir 2876 1076 39 24 27 80 7.9
Douglas fir 2877 575 47 26 35 68 6.4
Douglas fir 2880 650 45 33 37 78 15.73
Douglas fir 2881 876 43 20 31 75 6.5
Douglas fir 2882 725 46 24 32 81 10.7
Douglas fir 2883 1201 48 30 33 101 7.3
46 F. Gendron et al.
2.3. Directional light measurements
Each light sensor was mounted on a separate 1.5 m tripod so that
two users could make light measurements at the same time, in different
plots. The sensor was glued to a black, 7.5 cm × 7.5 cm plexiglass plate
that was firmly screwed to the top of a tripod. The light measurements
were recorded at various angles by tilting and rotating the sensor. Light
readings were made over eight elevation angles from 90º (the zenith)
to 20º, at 10º increments, and over eight azimuth angles (N, NE, E,
SE, S, SW, W, and NW). Note that elevation angle is defined in this
study as being zero at the horizon and reaching 90 at the zenith. A tilt
meter and a compass were used for setting the light sensor to the
desired elevation and azimuth angles. The light sensor was connected
to the LI-COR datalogger and the light readings were recorded instan-
taneously. A complete scan consisted of 64 readings and required less
than 25 min. One complete scan was completed during each time
period (described below) for each plot. For each scan, the relative light
reading (RLR
sensor
) was calculated as the light reading at elevation
angle θ and azimuth angle γ , divided by the sum of light readings over
the eight elevations and eight azimuth angles, multiplied by 100:
RLR
sensor
(θ,γ ) = (light reading(θ,γ ) / (sum of light readings over the
eight elevation and eight azimuth angles) × 100. (1)
In the present study, the angular distribution of PAR was described
by the RLR
sensor
profile. Due to the extremely high radiance of the
sun, the current signal to the datalogger became saturated for the meas-
urements when the sensor was pointing at the sun under clear sky con-
ditions. Sensor saturation was one reason that light measurements in
the present study were restricted to diffuse light only and that meas-
urements at or near the solar angle were excluded.
To determine the effects of sky conditions on the angular distribu-
tion of PAR, light measurements were made during three time periods:
(1) overcast sky conditions (between 10 h 00–14 h 00, solar time),
(2) clear sky conditions in the morning (9 h 00–11 h 00), and (3) clear
sky conditions around noon (11 h 00–13 h 00). Under overcast sky
conditions, the sky was completely covered with clouds. On clear sky
conditions, there was less than 20% cloud coverage, and also light
measurements were done in a sequence that avoided pointing the sen-
sor in the direction of any clouds. The light measurements were col-
lected sufficiently quickly during these different periods so that the
movement of the sun across the sky was negligible. One of the spruce
plots was measured just once in the morning under clear sky condi-
tions. Some of the data for clear sky conditions had to be eliminated
when clouds were noted later during the scanning. All light measure-
ments were completed under windless conditions. In addition to those
light measurements recorded in the plots, the angular distribution of
PAR was also measured in an open area using the same sampling pro-
cedure; one complete scan was made for each time period.
Measurements were made from July 11 to August 8 for the Duparquet
Lake Research Station sites, except for those measurements made in
the open, under overcast sky conditions, which were made on August 24.
Light measurements were made from September 12 to October 1 for
the Vancouver Island sites, and all of those in the red alder stand were
done before September 20, before the leaves started to fall.
2.4. Modelling of the diffuse angular light distribution
in open conditions
In this study, the angular distribution of PAR for open overcast
skies is modelled using the well-known standard overcast sky distri-
bution (SOC) [5, 28]. The SOC is the brightest at the zenith, with the
light decreasing towards the horizon; it is uniform azimuthally.
overcast sky RLR
sensor
(θ) ∝ (1 + b · sin(θ)) / (1 + b). (2)
Here we have used the fact that RLR is proportional to the radiance
distribution, where the constant of proportionality is determined by the
measured RLR at the zenith (i.e. RLR
sensor
(90º)).
The term (1+ b) represents the ratio of radiance at the zenith to that
at the horizon [41]. For example, when the zenith-to-horizon radiance
ratio parameter (b) is set to 2 the zenith is three times brighter than the
horizon, i.e. overcast sky RLR
sensor
(0°)/RLR
sensor
(90º) = 1/3. The
b parameter has been found to vary from 1 to 5 [21, 41]. Consequently,
the first step was to determine which value of b best described the sky
angular distribution of PAR in the present study. With regards to the
azimuthal uniformity, our data was found to be consistent with this
assumption: overcast sky RLR
sensor
did not vary with azimuth angle
at the Duparquet Lake Research Station (one-way ANOVA, F
7,56
=
0.41, P = 0.8930). On Vancouver Island, overcast sky RLR
sensor
showed some variation with azimuth angle (one-way ANOVA, F
7,54
=
2.67, P = 0.0191), but these differences were not related to the position
of the sun (overcast sky RLR
sensor
was highest in the NW direction
and lowest in the SE direction). Note that in contrast to diffuse light,
the angular distribution of direct light depends on the sun’s trajectory
across the sky over the growing season, and since this is well-described
in [17], it was not investigated in this study.
2.5. Hemispherical canopy photographs
Hemispherical canopy photographs were taken using a Nikon FM2
camera equipped with a Sigma 8 mm fisheye lens. The camera was
mounted with its top to the north, on a tripod 1.5 m in height above
the forest floor, and installed at the same location as the light sensor.
Photographs were taken early in the morning or at the end of the after-
noon in order to optimize contrast and to minimize glare from direct
sunlight [6, 14]. All photographs were underexposed to further
increase contrast between sky and foliage. After processing, the neg-
atives (Kodak TMAX 400 black and white film) were transferred onto
a Kodak Photo CD master disc with a resolution of 768 × 512 pixels.
Boundaries for the photos were determined with the Adobe Pho-
toshop® program (version 5.0 for Windows
®
, Adobe Systems Inc.,
San Jose, CA, USA) by comparing them with photos taken in the open.
Two small dots were placed at the outer east and west sides to mark
the maximum diameter of the photos.
The hemispherical canopy photographs were analysed to calculate
the transmitted light for different elevation and azimuth angles, using
the Gap Light Analyzer (GLA) program [17]. GLA has been used
extensively for such forest light calculations [7], ([8] a previous ver-
sion, GLI/C, was used). Analysis of the photographs was performed
as described in the users’ manual [17]. As only the relative amount of
diffuse light calculated from the GLA is considered in our study (one
exception was the total % light in Tab. I), the beam fraction and clear
sky transmission in the GLA model were unimportant. An SOC sky
distribution model was used as an input parameter to describe the
above-canopy light for the analysis. Photograph analysis was con-
ducted for the period between July 11 and August 8 at the Duparquet
Lake Research Station, and between September 12 and October 1 on
Vancouver Island. In the analysis of the GLA results, the sky hemi-
sphere was partitioned into 648 sky regions using 10° elevation divisions
and 5° azimuth divisions. Some database work was then necessary to
aggregate these sky regions in order to approximate the 23° solid angle
of the light sensor. Twenty degrees increments in elevation were cen-
tred on the same eight elevation angles as the light sensor and averaged
over azimuth angles.
TransDiffuse is the absolute (mol·m
–2
·d
–1
) amount of diffuse radi-
ation found at an understory microsite over a growing season [17], and
was calculated from the hemispherical photographs using the GLA.
The relative light reading for the hemispherical canopy photographs
(RLR
hc
) is then determined from this quantity:
RLR
hc
(θ,γ ) = (TransDiffuse(θ,γ ) / (TransDiffuse over the eight
elevation and eight azimuth angles) × 100. (3)
Angular distribution of diffuse PAR 47
In the calculations, the sky was partitioned by the GLA into discrete
sky regions of 10° increments in elevation and 5° increments in azi-
muth. Percent (%) of light transmission was calculated by the GLA
for the entire hemisphere, and ranged from 0%, when there were no
gaps in the canopy (i.e. a closed canopy), to 100% for a site in the open
([6] a previous version, GLI/C, was used).
2.6. Correction of RLR
hc
RLR
hc
is not directly comparable to the RLR
sensor
for two reasons.
Firstly, the light reading (i.e. TransDiffuse) calculated by the GLA
scales uses the area of its sky region; this area varies with elevation
angle, being smallest at the zenith and largest at the horizon. In con-
trast, sensor light measurements have a constant angular aperture of
23.45°. Secondly, TransDiffuse is calculated on the basis of the light
flux incident on a horizontal surface, while light measured with the
sensor represents the incident light flux normal to the propagation
direction, referred to as a “ball-sensor measurement”. Therefore, two
correction factors have been introduced to RLR
hc
, that normalize its
TransDiffuse terms to the area of sky region and convert it to a nor-
mally incident light value. This corrected RLR
hc
is termed RLR
hc_corr
and is equivalent and comparable to the sensor derived RLR
sensor
:
RLR
hc_corr
(θ) = corr1(θ) ⋅ corr2(θ) RLR
hc
(4)
corr1(θ) is the correction factor that normalizes the sky region area:
,
(5)
where Δθ represents the resolution in elevation angle which was set
to 20° in the GLA in order to parallel the 23.42° view angle of the light
sensor. The corr2(θ) converts the light values to those measured from
a normally incident direction:
.
(6)
Note that the zenith sector is treated as an annular piece with an
average elevation angle of 85° and an angular width Δθ = 10°. Hence
both corr1 and corr2 are equal to 1 for the zenith. Equations (5) and
(6) can be derived from geometrical considerations in a straightfor-
ward manner.
As mentioned earlier, in the analyses that were completed, the
RLRs were further aggregated over azimuthal angles so that they have
become functions of elevation angle (θ) only, as shown.
2.7. Statistical analyses
To determine the b parameter, the procedure NLIN was used to fit
the nonlinear regression of radiance to elevation angle using the SOC
sky distribution model (Eq. (2)) under overcast days. RLR
sensor
was
subjected to a two-way analysis of variance in order to examine the
effects of forest composition, elevation angle (or azimuth angle), and
their interaction (no interaction was performed when the azimuth
angle was used), on the angular distribution of PAR under overcast
and clear sky conditions. For each analysis of variance, Tukey’s test
was used to compare the means. Analysis of variance was performed
separately for each sky condition and time period. A four-way analysis
of variance (methods, forest composition, elevation angle, and azimuth
angle) was performed to test for differences between the two methods
(overcast sky RLR
sensor
and diffuse light RLR
hc_corr
). When RLR
tended to be non-normally distributed with heterogeneous variances,
analyses of variance were performed on log transformed data [35, 36].
However, untransformed means and standard errors are reported in all
figures. All statistical analyses were conducted using the SAS version
6.12 (SAS Institute Inc., Cary, N.C.); all of the main effects and inter-
actions were significant to at least the 0.05 level.
3. RESULTS
3.1. Angular distribution of PAR in the open under
overcast and clear sky conditions
Overcast sky RLR
sensor
in the open decreased gradually with
decreasing elevation angle under overcast skies (Fig. 1), with
the maximum RLR
sensor
occurring near the zenith at both the
corr1 θ()
85()cos · 5()sin
θ()· Δθ/2()sincos
=
corr1 θ()
85()sin
θ()sin
=
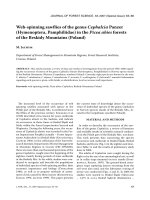
Figure 1. Relative light readings measured in the open under overcast sky conditions with the light sensor (overcast sky RLR
sensor
) and modelled
with the SOC sky distribution at the Duparquet Lake Research Station in Abitibi and on Vancouver Island in British Columbia.
48 F. Gendron et al.
Duparquet Lake Research Station and on Vancouver Island.
Overcast sky RLR
sensor
in the open followed the SOC sky
distribution with the zenith-to-horizon radiance ratio parameter
(b) estimated at 3.67 (± 0.69) and 4.03 (± 2.11) at the Duparquet
Lake Research Station and on Vancouver Island, respectively
(Fig. 1). Clear sky RLR
sensor
in the open consistently showed
small peaks near the horizon (20° elevation) (Figs. 2B and 2C).
In general, clear sky RLR
sensor
does not exhibit any steady
decrease or increase with elevation, and so it is best described
with the UOC.
3.2. Effects of sky conditions and forest composition on
angular distribution of PAR beneath closed forest
canopies
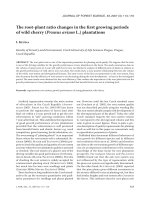
Under both overcast and clear sky conditions, the elevation
angle, the forest composition and their interactions all signifi-
cantly affected RLR
sensor
for both sites (Tab. II). Overcast and
clear sky RLR
sensor
were generally higher at the zenith and
decreased almost linearly with decreasing elevation angle
(Fig. 2). Although statistically different, overcast and clear sky
Figure 2. Relative light readings (± SE) measured with the light sensor (RLR
sensor
) as a function of elevation angle in the aspen, Jack pine,
spruce, red alder and Douglas-fir stands for (A) overcast sky, (B) clear sky in the morning, and (C) clear sky around noon. The range of solar
elevation angles for the specified periods on clear days (Figs. 2B and 2C) extended from 44º to 59º and from 27º to 39º in the morning, and
from 59º to 61º and from 39º to 41º around noon at the Duparquet Lake Research Station and on Vancouver Island, respectively. Relative light
readings in the open on clear days are also shown by the large solid lines for the Duparquet Lake Research Station and by large dotted lines
for Vancouver Island.
Angular distribution of diffuse PAR 49
RLR
sensor
beneath aspen and Jack pine stands were qualita-
tively similar. Overcast and clear sky RLR
sensor
were generally
higher in the spruce stands between 90° and 80° and lower
below these elevation angles, when compared to the aspen and
jack pine stands. On Vancouver Island, overcast and clear sky
RLR
sensor
were generally higher in Douglas fir stands between
90° and 70º, and lower below those elevations in comparison
to red alder.
The majority of RLR
sensor
was not influenced by azimuth
angles (data not shown). Overcast sky RLR
sensor
beneath
aspen, Jack pine, and spruce stands were isotropic with respect
to azimuth angles for overcast skies (data not shown). Under
clear sky conditions, some RLR
sensor
were statistically higher
towards the sun azimuth angles. On Vancouver Island, the
majority of the RLR
sensor
(both under overcast and clear sky
conditions) was isotropic with respect to azimuth angles (data
not shown). Studies of the azimuthal variation in light have not
been done before so these results, while not the focus of this
study, are discussed here briefly. They also provide justifica-
tion for our averaging over azimuth in all other analyses in the
present study.
3.3. Relative light readings estimated with the
hemispherical canopy photographs (diffuse light
RLR
hc_corr
) and its comparison with overcast sky
RLR
sensor
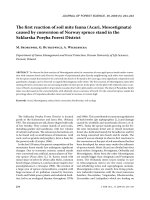
Diffuse light RLR
hc_corr
was calculated in order to directly
compare the angular distribution of PAR estimated with the
hemispherical canopy photographs with that measured with
overcast sky RLR
sensor
(compare Fig. 2A with Fig. 3). Results
showed a decrease in RLR with decreasing elevation angles,
Table II. ANOVA results for relative light readings in response to elevation angle and forest composition. Symbols are as follows: *** P <
0.0001, ** P < 0.01, * P < 0.05, NS = P > 0.05.
Source
Overcast sky Clear sky, morning Clear sky, noon
d
f
Mean square d
f
Mean square d
f
Mean square
Aspen, Jack Pine, and Spruce Stands
Elevation angle (EA) 7 183.90*** 7 64.33*** 7 72.15***
Forest composition (FC) 2 22.43*** 2 18.88*** 2 20.11***
EA × FC 14 2.53*** 14 2.85*** 14 2.76***
Error 807 0.37 799 0.29 744 0.19
Red Alder and Douglas-fir Stands
Elevation angle (EA) 7 137.79*** 7 33.32*** 7 29.37***
Forest composition (FC) 1 19.99*** 1 17.17*** 1 11.95***
EA × FC 7 4.37*** 7 4.25*** 7 2.44***
Error 688 0.34 564 0.22 588 0.25
Figure 3. Corrected relative diffuse light readings (diffuse light RLR
hc_corr
) (± SE) estimated with the hemispherical canopy photographs as
a function of elevation angle in the aspen, Jack pine, spruce, red alder, and Douglas-fir stands.
50 F. Gendron et al.
and also exhibited the same general trends regarding the effects
of forest composition. Diffuse light RLR
hc_corr
and overcast
sky RLR
sensor
were highest for the spruce stands above 80°, but
jack pine and aspen tended to have higher RLR below 80°. On
Vancouver Island, diffuse light RLR
hc_corr
and overcast sky
RLR
sensor
were lower beneath the red alder stands compared
to the Douglas-fir stands above 60°, but Douglas-fir RLR was
lower below 60°. Table III, however, shows a complex set of
detailed differences among the two methods, forest composi-
tion, elevation angle, and azimuth angle. These differences are
reflected in the RLR graphs. For example, at both sites, the
decrease in diffuse light RLR
hc_corr
from the zenith to 80º was
more pronounced than with overcast sky RLR
sensor
, but was
similar at lower elevation angles (Fig. 4).
Table III. Four-way ANOVA results for relative light readings under overcast skies in response to method (overcast sky RLR
sensor
and diffuse
light RLR
hc_corr
), forest composition, elevation angle and azimuth angle. Symbols are as follows: *** P < 0.0001, ** P < 0.01, * P < 0.05,
NS = P > 0.05.
Forest Stands Source Aspen, Jack Pine, and Spruce Red Alder and Douglas-fir
d
f
Mean square d
f
Mean square
Method (M) 1 51.67* 1 14.02NS
Forest composition (FC) 2 141.25*** 1 63.75**
Elevation angle (EA) 7 2483.06*** 7 1261.46***
Azimuth angle (AA) 7 7.75NS 7 29.06***
M × FC 2 15.22NS 1 0.04NS
M × EA 7 15.19*** 7 58.01***
M × AA 7 15.51* 7 4.50NS
M × FC × EA 28 16.63*** 14 46.60***
M × FC × AA 28 27.31*** 14 37.64***
M × EA × AA 98 4.43NS 98 10.12***
M × FC × EA × AA 196 3.99NS 98 5.75NS
Error 1279 5.93 1152 5.24
Figure 4. Comparison between the relative diffuse light readings (RLR) (± SE) measured with the sensor (solid lines: overcast sky RLR
sensor
)
and estimated with the hemispherical canopy photographs (dotted lines: diffuse light RLR
hc_corr
) as a function of elevation angle in (A) aspen,
Jack pine and spruce stands and (B) red alder and Douglas-fir stands.
Angular distribution of diffuse PAR 51
4. DISCUSSION
4.1. Determination of the optimal zenith-horizon
radiance ratio parameter (b) for modelling
the angular distribution of diffuse PAR in the open
for overcast and clear sky conditions
Few studies have characterised the PAR sky distribution on
overcast days. Grace [19] reported that the SOC formula with
b set to 2 explained nearly half of the sky variation obtained at
a wavelength of 575 µm. Grant et al. [21] reported that PAR
radiance was 5.6 times higher at the zenith than at the horizon,
with a corresponding b value of 4.6. Similar to this latter study,
our estimated b also indicates that PAR decreases more rapidly
than global radiation from zenith to horizon with light at the
zenith more than four times greater than at the horizon. This
might result from the radiation scattering in the atmosphere
being strongly wavelength selective. As radiation travels
through the atmosphere, it is scattered by molecules of gas and
aerosols [27]. Scattering is higher near the horizon because of
the longer pathlength that the radiation travels through the
atmosphere to the viewer [27]. Since the scattering is proportional
to the inverse fourth power of the wavelength, the scattering of
short PAR wavelengths is thus greater than the scattering of the
longer wavelengths found in global radiation. This would
explain the greater attenuation of PAR wavelengths compared
to global radiation as the horizon is approached.
Under clear sky conditions, the angular distribution of light
depends mainly on the position of the sun, and to a lesser extent
on turbidity and scattering [40]. The sky sector around the sun
is defined as the circumsolar region and corresponds to a peak
in RLR for both global radiation [31, 32, 40] and PAR radiation
[15, 21]. In the present study, however, light measurements
taken when the light sensor was pointing near or at the solar
elevation angles were omitted and these peaks were thus not
observed. The low clear sky RLR
sensor
measured near or at the
solar elevation angles correspond to a region of low radiance
in the sky hemisphere. This region, located at about 90º from
the sun, shows a lower radiance than the average radiance in
the sky hemisphere [40], and is about four times less bright than
the circumsolar region for the PAR wavelength range [21].
Another bright region in the sky is found near the horizon. In
the present study, high clear sky RLR
sensor
measured at an ele-
vation angle of 20º corresponds with horizon brightening as dif-
fuse light tends to be stronger nearer the horizon than at the
zenith under clear sky conditions [21, 27].
4.2. Effects of elevation angle, forest composition, and
sky conditions on the angular distribution of PAR
beneath forest stands
Elevation angle significantly influenced the angular distri-
bution of PAR beneath forest stands for both overcast and clear
sky conditions. Under overcast sky conditions, RLR
sensor
beneath
forest stands decreased with decreasing elevation angles. Sim-
ilar patterns in diffuse light penetration were found beneath
three types of forests in Japan where diffuse light penetration,
calculated from photographs of canopies for various elevation
angles, was observed to decrease with decreasing elevation
angle [43]. The decline in RLR
sensor
under both overcast and
clear sky conditions with decreasing elevation angle is
expected. Light penetration through a vegetation canopy has
been shown to decline with decreasing elevation angle because
light from lower angles filters through longer pathlengths in the
canopy so there is increased interception by foliage, branches,
and trunks [2, 3, 20]. Only a few clear sky RLR
sensor
measure-
ments showed significant variation with respect to azimuth
angles. Most of these differences were easily explained by the
location of the sun. However, since only diffuse light was meas-
ured in clear sky conditions, we would expect stronger differ-
ences in the direction of the sun when direct light is included.
Differences in the angular distribution of PAR under tree
canopies could be caused by the characteristics of the forest
stands. For example, in the boreal forest, aspen crowns have a
spherical shape with an erectophile leaf orientation [23]. Their
crowns are closely packed and form a uniform layer of leaves.
Large numbers of small gaps can be seen between the leaves
and the branches over the whole aspen forest canopy. This par-
ticular structure explains the penetration of lateral light, which
results in a gradual attenuation of light with decreasing solar
elevation angle, as measured in this study. Similarly, because
of the uniform distribution of the aspen leaves, the proportion
of sunflecks to radiation intensity greater than 500 µmol·m
–2
·s
–1
was found to be lower beneath aspen stands than conifer stands
in the boreal forest [26].
Overcast and clear sky RLR
sensor
decreased sharply from the
zenith to the horizon beneath the spruce stands at the Duparquet
Lake Research Station. Light does not come from all directions
in spruce stands since the scattering coefficient is lower for
boreal spruce stands as compared with Jack pine stands [11].
Moreover, penetration of lateral light was reduced by the high
crown ratio (47–69%) and the presence of long dead branches
along the trunks. At high latitudes, the long conical crowns of
conifers might be an adaptation to better intercept direct light
at low elevation angles [24]. The interception of lateral light
would result in a sharp attenuation of light coming from low
elevation angles, as measured in this study. Black spruce (Picea
mariana (Mill.) BSP), and other conifers, often have tall, nar-
row crowns with the majority of their shoots oriented close to
the horizontal position [11]. This crown structure has been
hypothesised to increase light interception at higher elevation
angles [11] and thus transmit greater amounts of light at mid
to low elevations. This latter hypothesis, however, is not sup-
ported by our spruce stands results, but explains the angular dis-
tribution of PAR found under our Douglas-fir stands.
The results of this study also suggest that the angular distri-
bution of PAR beneath forest canopies varies with their specific
shade tolerance. For example, RLR
sensor
was usually higher
under the shade intolerant aspen and Jack pine stands as com-
pared to the shade tolerant spruce stands, at low elevation
angles. These results are consistent with many studies that have
reported that shade intolerant tree species transmit more light
than shade tolerant species [9, 26]. The present study also dem-
onstrates that shade intolerant aspen and Jack pine trees trans-
mit light from a relatively wider angle around the zenith than
shade tolerant spruce species, which transmit light mainly from
the zenith.
Overcast and clear sky RLR
sensor
were statistically higher
beneath the shade intolerant red alder than Douglas-fir stands.
52 F. Gendron et al.
Above 60º–70º, however, overcast and clear sky RLR
sensor
were similar or higher beneath the Douglas-fir stands. It has
been reported in the literature that the horizontal branches of
spruce and Douglas-fir trees allow greater lateral light penetra-
tion than occurs for species with a more vertical branching
structure [4, 11]. As mentioned above, this was not the case in
the spruce stands because the spruce stands examined in this
study had very long crowns and a high live crown ratio. How-
ever, the horizontal branches in Douglas-fir trees and the low
live crown ratio (less than 33%) may have permitted the pen-
etration of lateral light at mid and high elevation angles. Mature
Douglas-fir stands transmit relatively high amounts of diffuse
light because they are tall, support a relatively low leaf area and
have crowns that are well above the forest floor [37]. Relatively
high lateral light penetration in these Douglas-fir stands would
lead to smaller differences in overcast and clear sky RLR
sensor
between the red alder stands and the Douglas-fir stands, as was
observed here.
4.3. Comparison between the overcast sky RLR
sensor
measured with the light sensor and diffuse light
RLR
hc_corr
estimated from the hemispherical
canopy photographs
Two correction factors were required to properly compare
RLR
hc
with the overcast sky RLR
sensor
(see the Methods sec-
tion). With these two corrections, angular distribution of PAR
estimated from hemispherical canopy photographs, diffuse
light RLR
hc_corr
, was globally in agreement with the overcast
sky RLR
sensor
. However, diffuse light RLR
hc_corr
may blur
some of the within-day variability in angular distribution of
PAR since they represent azimuthally and temporally inte-
grated values (see Methods). RLR measured with the light sen-
sor under different sky conditions and at different periods
during the day showed some variation in the angular distribu-
tion of PAR. For example, a peak in clear sky RLR
sensor
was
measured by the sensor around noon in the Douglas-fir stands
(Fig. 2C). By contrast, diffuse light RLR
hc_corr
is averaged
throughout the day and the growing season by the GLA so that
these temporal peaks of light were not apparent (Fig. 3). This
within-day light variability is important, however, [18] as it
potentially influences the physiological and morphological
responses of understory plants.
5. CONCLUSION
Firstly, the angular distribution of PAR under overcast sky
conditions measured with the light sensor was not found to be
isotropic as modelled in some studies [7, 8]. Instead, results of
this study indicate that PAR was more than four times greater
at the zenith than at the horizon with a zenith-horizon radiance
ratio parameter (b) of 3 or 4. This rapid decrease in PAR with
decreasing elevation angle is concordant with Grant et al. [21]
and may be attributed to multiple scattering in the PAR wave-
lengths near the horizon [27]. Therefore it is felt that the SOC
model is a more accurate representation of the diffuse overcast
sky light distribution than an isotropic, the UOC, model. Sec-
ondly, this study demonstrates that the angular distribution of
PAR as described by the RLR profile under tree canopies is
influenced by sky conditions, elevation angle, and forest com-
position. For example, aspen and Jack pine stands transmitted
light from a relatively wider angle around the zenith than spruce
stands, which transmitted light mainly from the zenith. Thirdly,
diffuse light RLR
hc_corr
was found to be globally in agreement
with overcast sky RLR
sensor
with regards to the effects of forest
composition. However, overcast sky RLR
sensor
showed large
variations in the angular distribution of PAR under different
sky conditions and periods of the day. Results of this study are
useful for refining PAR models and determining the potential
impact of the different angular distribution of PAR profiles in
shaping crown morphology and in influencing light intercep-
tion by the understory vegetation layers.
Acknowledgments: We thank Annie Morin and Joel Coburn for their
help with field work, Don Carson for providing access to the Cowichan
Lake Research Station and Lana B. Ruddick for editorial English com-
ments. Funding support for this research was provided by the National
Sciences and Engineering Research Council grant to F. Gendron, by
the Sustainable Forest Management Network, and by Forest Renewal
B.C. (Project HQ96400-RE). Support from these agencies and from
the B.C. Ministry of Forests is gratefully acknowledged.
REFERENCES
[1] Ackerly D.D., Bazzaz F.A., Seedling crown orientation and
interception of diffuse radiation in tropical forest gaps, Ecology 76
(1995) 1134–1146.
[2] Anderson M.C., Studies of the woodland light climate. II. Seasonal
variation in the light climate, J. Ecol. 52 (1964) 643–663.
[3] Baldocchi D.D., Hutchison B.A., Matt D.R., McMillen R.T.,
Seasonal variations in the radiation regime within an oak-hickory
forest, Agric. For. Meteorol. 33 (1984) 177–191.
[4] Black T.A., Chen J.M., Lee X., Sagar R.M., Characteristics of shor-
twave and longwave irradiances under a Douglas-fir forest stand,
Can. J. For. Res. 21 (1991) 1020–1028.
[5] Brunger A.P., Hooper F.C., Anisotropic sky radiance model based
on narrow field of view measurements of shortwave radiance, Solar
Energy 51 (1993) 53–64.
[6] Canham C.D., Growth and canopy architecture of shade-tolerant
trees: response to canopy gaps, Ecology 69 (1988) 786–795.
[7] Canham C.D., Coates K.D., Bartemucci P., Quaglia S., Measure-
ment and modeling of spatially explicit variation in light transmis-
sion through interior cedar-hemlock forests of British Columbia,
Can. J. For. Res. 29 (1999) 1775–1783.
[8] Canham C.D., Denslow J.S., Platt W.J., Runkle J.R., Spies T.A.,
White P.S., Light regimes beneath closed canopies and tree-fall
gaps in temperate and tropical forests, Can. J. For. Res. 20 (1990)
620–631.
[9] Canham C.D., Finzi A.C., Pacala S.W., Burbank D.H., Causes and
consequences of resource heterogeneity in forests: interspecific
variation in light transmission by canopy trees, Can. J. For. Res. 24
(1994) 337–349.
[10] Chazdon R.L., Field C.B., Photographic estimation of photosynthe-
tically active radiation: evaluation of a computerized technique,
Oecologia 73 (1987) 525–532.
[11] Chen J.M., Canopy architecture and remote sensing of the fraction
of photosynthetically active radiation absorbed by boreal conifer
forests, IEEE Trans. Geosci. Remote Sensing 34 (1996) 1353–
1367.
Angular distribution of diffuse PAR 53
[12] Clarck D.A., Clarck D.B., Life history diversity of canopy and
emergent trees in a neotropical rain forest, Ecol. Monogr. 62 (1992)
315–344.
[13] Clearwater M.J., Gould K.S., Leaf orientation and light interception
by juvenile Pseudopanax crassifolius (Cunn.) C. Koch in a partially
shaded forest environment, Oecologia 104 (1995) 363–371.
[14] Easter M.J., Spies T.A., Using hemispherical photography for esti-
mating photosynthetic photon flux density under canopies and in
gaps in Douglas-fir forests of the Pacific Northwest, Can. J. For.
Res. 24 (1994) 2050–2058.
[15] Endler J.A., The color of light in forests and its implications, Ecol.
Monogr. 63 (1993) 1–27.
[16] Fielder P., Comeau P., Construction and testing of an inexpensive
PAR sensor, Res. Br., Min. For., Victoria, BC. Work Pap. 53/
2000, 2000.
[17] Frazer G.W., Canham C.D., Lertzman K.P., Gap Light Analyzer
(GLA): Imaging software to extract canopy structure and gap light
transmission indices from true-colour fisheye photographs, users
manual and program documentation, Simon Fraser University,
Burnaby, British Columbia, and the Institute of Ecosystem Studies,
Millbrook, New York, 1999.
[18] Gendron F., Messier C., Comeau P.G., Temporal variations in the
understorey photosynthetic photon flux density of a deciduous
stand: the effects of canopy development, solar elevation, and sky
conditions, Agric. For. Meteorol. 106 (2001) 23–40.
[19] Grace J., The directional distribution of light in natural and control-
led environment conditions, J. Appl. Ecol. 8 (1971) 155–164.
[20] Grant R.H., Ultraviolet and photosynthetically active bands: plane
surface irradiance at corn canopy base, Agron. J. 83 (1991) 391–
396.
[21] Grant R.H., Heisler G.M., Gao W., Photosynthetically-active radia-
tion: sky radiance distributions under clear and overcast conditions,
Agric. For. Meteorol. 82 (1996) 267–292.
[22] Hutchison B.A., Matt D.R., McMillen R.T., Effects of sky
brightness distribution upon penetration of diffuse radiation
through canopy gaps in a deciduous forest, Agric. Meteorol. 22
(1980) 137–147.
[23] Kucharik C.J., Norman J.M., Gower S.T., Measurements of leaf
orientation, light distribution and sunlit leaf area in a boreal aspen
forest, Agric. For. Meteorol. 91 (1998) 127–148.
[24] Kuuluvainen T., Tree architectures adapted to efficient light utiliza-
tion: is there a basis for latitudinal gradients? Oikos 65 (1992) 275–
284.
[25] Lieffers V.J., Messier C., Stadt K.J., Gendron F., Comeau P.G.,
Predicting and managing light in the understory of boreal forests,
Can. J. For. Res. 29 (1999) 796–811.
[26] Messier C., Parent S., Bergeron Y., Effects of overstory and
understory vegetation on the understory light environment in mixed
boreal forests, J. Veg. Sci. 9 (1998) 511–520.
[27] Monteith J.L., Unsworth M.H., Radiation environment, in: Princi-
ples of environmental physics, 2nd ed., Edward Arnold, London,
1990, pp. 36–57.
[28] Moon P., Spencer D.E., Illumination from a non-uniform sky,
Trans. Illum. Eng. Soc. 37 (1942) 707–726.
[29] O’Connell B.M., Kelty M.J., Crown architecture of understory and
open-grown white pine (Pinus strobus L.) saplings, Tree Physiol.
14 (1994) 89–102.
[30] Reifsnyder W.E., Furnival G.M., Horowitz J.L., Spatial and tempo-
ral distribution of solar radiation beneath forest canopies, Agric.
Meteorol. 9 (1971) 21–37.
[31] Rosen M.A., Hooper F.C., Brunger A.P., The characterization and
modelling of the diffuse radiance distribution under partly cloudy
skies, Solar Energy 43 (1989) 281–290.
[32] Ross J., The radiation regime and architecture of plant stands, Dr
W. Junk Publishers, The Hague, 1981.
[33] Ross M.S., Flanagan L.B., La Roi G.H., Seasonal and successional
changes in light quality and quantity in the understory of boreal
forest ecosystems, Can. J. Bot. 64 (1986) 2792–2799.
[34] Rouvinen S., Kuuluvainen T., Structure and asymmetry of tree
crowns in relation to local competition in a natural mature Scots
pine forest, Can. J. For. Res. 27 (1997) 890–902.
[35] Scherrer B., Biostatistique, Gaëtan Morin, Canada, 1984.
[36] Sokal R.R., Rohlf F.J., Biometry. The principles and practice of sta-
tistics in biological research, 2nd ed., W.H. Freeman and Co., San
Francisco, 1981.
[37] Spies T.A., Franklin J.F., Klopsch M., Canopy gaps in Douglas-fir
forests of the Cascade Mountains, Can. J. For. Res. 20 (1990) 649–
658.
[38] Sprugel D.G., The relationship of evergreenness, crown
architecture, and leaf size, Am. Nat. 133 (1989) 465–479.
[39] Stenberg P., Simulations of the effects of shoot structure and
orientation on vertical gradients in intercepted light by conifer
canopies, Tree Physiol. 16 (1996) 99–108.
[40] Steven M.D., Standard distributions of clear sky radiance, Quart. J.
R. Met. Soc. 103 (1977) 457–465.
[41] Steven M.D., Unsworth M.H., The angular distribution and
interception of diffuse solar radiation below overcast skies, Quart.
J. R. Met. Soc. 106 (1980) 57–61.
[42] Stone J.N., MacKinnon A.P.J.V., Lertzman K.P., Coarse woody
debris decomposition documented over 65 years on southern Van-
couver Island, Can. J. For. Res. 28 (1998) 788–793.
[43] Takenaka A., Analysis of light transmissivity of forest canopies
with a telephoto method, Agric. For. Meteorol. 40 (1987) 359–369.
[44] Vales D.J., Bunnell F.L., Relationships between transmission of
solar radiation and coniferous forest stand characteristics, Agric.
For. Meteorol. 43 (1988) 201–223.