Báo cáo lâm nghiệp: "Effects of light intensity on the growth and energy balance of photosystem II electron transport in Quercus alba " potx
Bạn đang xem bản rút gọn của tài liệu. Xem và tải ngay bản đầy đủ của tài liệu tại đây (554.1 KB, 8 trang )
111
Ann. For. Sci. 63 (2006) 111–118
© INRA, EDP Sciences, 2006
DOI: 10.1051/forest:2005103
Original article
Effects of light intensity on the growth and energy balance
of photosystem II electron transport in Quercus alba seedlings
G. Geoff WANG
a
*, William L. BAUERLE
b
a
Department of Forest and Natural Resources, Clemson University, Clemson, SC 29634-0317, USA
b
Department of Horticulture, Clemson University, Clemson, SC 29634-0319, USA
(Received 26 April 2005; accepted 24 August 2005)
Abstract – Quercus alba (white oak) seedlings were grown at four levels of irradiance (5, 15, 30 and 100% of full sunlight) under a rain out
shelter. After one growing season, the greatest diameter and height growth, biomass (root, leaf, and stem) and leaf area were observed on
seedlings under 100% of full sunlight. Seedlings under 15, 30 and 100% of full sunlight allocated more biomass to roots (~ 70%) than seedlings
under 5% of full sunlight (~ 58%), suggesting a priority in root growth unless light is severely limited. Leaf weight ratio, specific leaf area, and
leaf area ratio increased with the degree of shading, indicating acclimation of leaves to different light intensities. Acclimation to light intensity
closely correlated with the fluorescence parameter 1–q
P
. Non-photochemical quenching was also affected as shade intensity increased. The
apparent reduction in electron transport rate (ETR) through photosystem II (PS II) increased with light intensity, and light saturated ETR under
5% of full sunlight was only 46% of that under full sunlight. The shift from photochemical to non-photochemical quenching occurred in
response to increasing actinic light and as growth irradiance declined, the ‘quenching shift rate’ declined as well. Overall, Quercus alba
seedlings demonstrated strong growth and allometric responses to light intensity.
white oak / shade tolerance / biomass allocation / modulated chlorophyll fluorescence / light acclimation
Résumé – Effets de l’intensité lumineuse sur la croissance et la balance énergétique du transport d’électrons du photosystème II chez
des semis de Quercus alba. Des semis de Quercus alba ont été élevés à quatre niveaux d’éclairement (5, 15, 30, et 100 % du plein éclairement).
Après une saison de végétation, le diamètre et la croissance en hauteur, la biomasse (racine, feuille, tige) et la surface foliaire les plus importants
ont été observés pour les semis poussant sous 100 % de lumière. Les semis poussant sous 15, 30 et 100 % d’éclairement ont alloué plus de
biomasse aux racines (environ 70 %) que les semis poussant sous 5 % de lumière (environ 48 %) suggérant une priorité à la croissance des
racines sauf quand l’éclairement est fortement limité. Le poids des feuilles rapporté à la biomasse totale, la surface spécifique des feuilles, la
surface des feuilles rapportée à la biomasse totale s’accroissent avec l’importance de l’ombre, indiquant l’acclimatation des feuilles aux
différents niveaux d’éclairement. L’acclimatation à la lumière est étroitement corrélée avec le paramètre de flurescence1–q
p. Le quenching non-
photochimique était aussi influencé par l’accroissement de l’ombre. L’apparente réduction dans le taux de transport d’électrons (ETR) à travers
le photosystème II (PS II) s’accroît avec l’importance de l’éclairement et ETR saturé sous 5 % d’éclairement ne représentait que 46 % seulement
de celui sous pleine lumière. Le changement entre quenching photochimique et non-photochimique intervient en réponse à l’accroissement de
la lumière actinique et comme l’éclairement de croissance diminue, le « taux de changement du quenching » baisse aussi. En général, les semis
de Quercus alba ont manifesté une forte croissance et des réponses allométriques à l’intensité de l’éclairement.
Quercus alba / tolérance à l’ombre / répartition de la biomasse / fluorescence modulée de la chlorophylle / acclimatation à la lumière
1. INTRODUCTION
Quercus alba (white oak) is one of the most widely distrib-
uted tree species in eastern North America [43]. Within its dis-
tribution range, Quercus alba tends to grow at lower elevation
but is found across a broad range of sites except for the wettest
and most xeric, rocky, or nutrient poor soils [1]. Before Euro-
pean settlement, oaks, especially Quercus alba, dominated in
the vast areas of deciduous forest in the eastern United States
[1]. Despite its past and current dominance, oaks are facing a
widespread regeneration problem, particularly on mesic or
good quality sites [30]. For example, very little recruitment of
new Quercus alba trees occurred during the 20th century [3,
8], and there is evidence of a dramatic decline in Quercus alba
forest from presettlement to the present day (e.g., [2, 13, 17]).
Because this regeneration problem poses a serious threat to the
sustainable management of oak forest, numerous ecological
and silvicultural studies have been conducted in order to under-
stand and thus solve the problem [1, 27, 30]. These studies have
revealed a lack of understanding of ecological and physiolog-
ical processes involved in oak regeneration.
Light is a critical factor affecting early survival and growth
of tree seedlings under a forest canopy [27], but our knowledge
on how Quercus alba responds to light is rather limited. In fact,
* Corresponding author:
Article published by EDP Sciences and available at or />112 G.G. Wang, W.L. Bauerle
results generated from studies on a few oak species are com-
monly generalized and applied to all oak species. Quercus alba
is generally described as a species of intermediate shade-toler-
ance [47]. However, it can persist under a forest canopy for
more than 90 years and responds well to canopy removal [34,
41, 43]. Because the existence of well-developed seedlings is
a prerequisite for regeneration success of oak species [27], it is
critical to understand the light condition under which oak seed-
lings would most benefit.
The shift between photochemical and non-photochemical
quenching (chlorophyll fluorescence emission) balances
energy input with utilization at the leaf chloroplast level. The
transition from photochemical quenching at low light to non-
photochemical quenching at high light reduces the quantum
yield of PS II (φ
PS II
). Modulated chlorophyll fluorescence can
readily measure the adjustment of light harvesting to energy
utilization over a short time perspective [46] and has been used
to characterize light acclimation of photosynthesis in Pinus
sylvestris relative to Quercus robur [19] and Fagus sylvatica
relative to Quercus petraea [20]. To our knowledge, there are
no reports on how Quercus alba photochemical and non-pho-
tochemical mechanisms balance each other in response to light
acclimation. There is a lack of fundamental knowledge of the
physiological processes controlling early growth and develop-
ment of oaks compared to other commercially important tree
species in temperate forests.
The objective of the study was to investigate light acclima-
tion in Quercus alba seedlings growing under a wide range of
light intensities (5, 15, 30, and 100% of full sunlight). Specif-
ically, we examined (1) how growth dynamics and biomass
allocation change with light levels and (2) to what extent light
intensity influences the rate of electron transport by affecting
photochemical and non-photochemical mechanisms.
2. MATERIALS AND METHODS
2.1. Plant material and growth conditions
Before the initiation of aboveground growth, 270 germinated seeds
were carefully excavated from under a mature white oak Quercus alba
tree on the campus of Clemson University. Clemson University (lat.
34° 40’ 8”; long. 82° 50’ 40”) is located within the upper Piedmont
physiographic region. These germinated seeds were transplanted into
1.5 L plastic pots containing standard greenhouse potting substrate
(Fafard 3B, Fafard Inc., Anderson, S.C.) and irrigated with a 1:100
Hydro Sol 5-11-26 N-P-K (Scotts Co., Marysville, OH). The seeds
were allowed to develop in a glasshouse for two weeks. The average
Photosynthetic Photon Flux Density (PPFD) from 700–1900 h in the
glasshouse was 213 μmol m
–2
s
–1
or approximately 10% of full sun-
light. Among the 270 transplanted seedlings, 263 survived the trans-
plantation after two weeks in the greenhouse.
From the 263 surviving seedlings, 96 were randomly assigned and
transplanted into twenty-four 57 L plastic pots (four seedlings per pot)
that contained the same substrate. Initially, all pots were watered to
saturation and permitted to drain for 24 h. Quercus alba seedlings were
grown either in full sunlight (FL) or under one of three shading screen
regimes (light shade – LS, medium shade – MS, and high shade – HS)
in a rainout shelter. Polyvinyl Chloride (PVC) tubing supported the
solar reflecting shade cloth (model XLS Revolux, AB Ludvig Sven-
sson Inc., Kinna, Sweden) in a 1.5 × 1.25 m rectangular box. Six plastic
pots (24 seedlings) were randomly assigned into each light level.
Under each light level, pots were watered on an as need basis to main-
tain their water supply at or close to container capacity. The plants
were grown for one week in the rain out shelter prior to initiation of
the experiment to make sure no mortality resulted from the transplant-
ing process.
On cloud free days, the maximum PPFDs at solar noon averaged
1750, 525, 263, and 88 μmol m
–2
s
–1
or 100, 30, 15, and 5% in the
FL, LS, MS, and HS treatments, respectively. Under the same condi-
tions, however, the average PPFD from sunrise to sunset was 827, 248,
124, and 41 μmol m
–2
s
–1
in the FL, LS, MS, and HS treatments,
respectively. The LS, MS, and HS treatments resulted in the gradient
of light environments that are characteristic of understory conditions
in gap, moderate, and dense vegetation cover in mature oak forests.
2.2. Data collection
Light Measurements: Under each light regime, PPFD was meas-
ured every minute using a line quantum sensor and the average logged
every 15 min (LiCor Inc., Lincoln, NE, USA). The line sensor was sus-
pended above the canopy via a fixed PVC support rack that did not
exceed the width of the sensor. These measurements were used to ver-
ify the shading screen light level.
Growth Measurements: Seedling mortality was observed and
recorded each week. Only one seedling died in the middle of the exper-
iment under 15% light, and thus was excluded from the study. Height
(HT), root collar diameter (RCD), and number of leaves were meas-
ured twice a month during the experimental period. Height was meas-
ured to the nearest 0.1 cm using a measuring tape, and RCD was
measured to the nearest 0.01 mm using a digital caliper. To ensure con-
sistency in diameter measurements, measuring position and direction
were marked on each stem using a permanent marker. At the end of
the experimental period (September 11, 2003), all seedlings were
destructively sampled. Each seedling was carefully excavated, and
roots were soaked and washed. Root (RW), stem (SW) and leaf (LW)
biomass were determined by drying to a constant mass at 80 °C. Sev-
eral small circles with known area were cut from each dry leaf to deter-
mine specific leaf area for each seedling.
Modulated chlorophyll fluorescence measurements: To prevent
photoinhibition prior to measurement, plants scheduled for modulated
chlorophyll fluorescence measurement were transferred from the rain-
out shelter to a humidified growth room in the morning. The growth
room light intensity was 375 μmol m
–2
s
–1
. Randomly selected plants
from each treatment combination were chosen for repeated sampling
of modulated chlorophyll fluorescence (n = 6). The light response of
modulated chlorophyll fluorescence was measured on individual
leaves using a portable modulated fluorometer (OS5-FL; Opti-Sci-
ences, Tyngsboro, MA, USA) at room temperature. To prevent pho-
toinhibitory PPFD levels, a preliminary experiment was conducted to
determine light saturation using a Gilway Technical Lamp (Woburn,
MA, USA) as the actinic light source. When designing the actinic light
intensity protocol, it was established that no significant photosynthetic
increase occurred above 800 μmol m
–2
s
–1
, therefore, a slightly lower
but still saturated value of 725 μmol m
–2
s
–1
was used as the highest
actinic intensity (~ 37% of full sunlight) to prevent photoinhibition.
This value is similar to the light saturated maximum rate of net pho-
tosynthesis reported by Teskey and Shrestha [47]. Prior to the first
measurement, leaves were equilibrated for a minimum of 30 min using
dark-adapting leaf clips to determine the dark-adapted initial fluores-
cence (F
o
), and maximum fluorescence (F
m
). Leaf ontogeny was con-
sistent, where measurements were taken on the 1–2 youngest fully
expanded leaves. The fluorescence measurements with actinic light
started at intermediate PPFD, subsided in steps to lower PPFD, back
to the initial intermediate PPFD and proceeded to high PPFD to min-
imize photoinhibition. Steady state fluorescence was achieved at every
light level by monitoring the stability of fluorescence (F
s
) and the max-
imal light exposed fluorescence (F'
m
). Before the light level was
Light acclimation in Quercus alba seedlings 113
changed, the minimum fluorescence in the light (F'
o
) was determined
using a far-red light source (735 nm).
2.3. Data analysis
Based on biomass (oven-dry weight) measurements, total biomass
(TB), aboveground biomass (AB), root to shoot ratio (RSR), leaf
weight to total biomass ratio (LWR) and leaf weight to root weight
ratio (LWRr) were calculated for each seedling. Based on specific leaf
area (SLA; cm
2
g
–1
) and leaf weight measured for each seedling, total
leaf area (LA; cm
2
) was calculated. Leaf area to total biomass ratio
(LAR; cm
2
g
–1
) and leaf area to root weight ratio (LARr; cm
2
g
–1
) were
also calculated. The potential quantum efficiency of PS II (F
v
/F
m
) for
dark-adapted leaves was calculated, where the maximal and minimal
fluorescence yields were subtracted and divided by the maximal flu-
orescence yield (F
m
–F
o
/F
m
). For leaves exposed to actinic light, the
coefficient for non-photochemical quenching (q
N
) was calculated as
q
N
= 1–(F'
m
–F'
o
)/F
m
–F
o
, whereas the photochemical quenching coef-
ficient (q
P
) was calculated as q
P
= (F'
m
–F
s
)/F'
m
–F'
o
(11, 44, 45). An
estimate of the PS II reduction state (PS II closure) was derived as
1–q
P
. Non-radiative dissipation (NPQ) was calculated as (F
m
–F'
m
)/F'
m
[5, 11]. The actual quantum yield of PS II was calculated as φ
PS II
=
q
P
× φ
exc
= ΔF/F'
m
, where φ
exc
is the efficiency of excitation energy
transfer from light harvesting complex II to the PS II reaction center
and ΔF = F'
m
–F
s
(16). The relative electron transport rate was calcu-
lated as ETR = [(F'
m
–F
s
)/ F'
m
] × absorbed PPFD or (ΔF/F'
m
) ×
absorbed PPFD [11, 16]. The fraction of irradiance absorbed in the leaf
was measured indirectly with a Minolta SPAD 502 chlorophyll meter
(Minolta Camera Co., Ramsey, NJ, USA) following Bauerle et al. [4].
The light response curve of ETR was fit as described in Ögren and
Evans [33]. Except when otherwise noted, third order polynomials
were fit to the relationship between light and fluorescence parameters.
Chlorophyll fluorescence nomenclature followed that of van Kooten
and Snel [49].
The experiment implemented in the study was a complete rand-
omized design, with light level as treatment, pot as replicate, and seed-
ling within each pot as subsample. Repeated measures analysis of
variance was used to quantify the effect of light level on RCD and HT
and changes in RCD and HT over the experimental period. Due to sig-
nificant interactions between light treatment and measuring dates, the
changes in RCD and HT over the experimental period were analyzed
separately for each light level using one-way analysis of variance.
Similarly, differences in RCD and HT among light levels were ana-
lyzed separately for each measuring date using one-way analysis of
variance followed by Bonferroni’s multiple comparisons. One-way
analysis of variance followed by Bonferroni’s multiple comparisons
was also used to test the difference in biomass measurement TB, AB,
RW, LW, SLA, RSR, LAR, LARr, LWR and LWRr. Previous studies
have raised caution about comparing allometric relationships of plants
of different size (e.g., [24, 42]), but introducing seedling size (bio-
mass) as a covariate in comparing RSR, LAR, LARr, LWR, and LWRr
did not alter our results. All statistical analyses and graphics were con-
ducted using SYSTAT (SYSTAT Software Inc., Richmond, CA, USA).
3. RESULTS
3.1. Growth dynamics and biomass allocation
Mortality due to light limitation was not observed during the
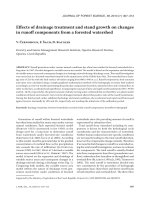
study. Although RCD continued to grow (Fig. 1), HT growth
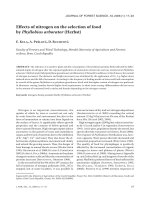
stopped at 15 days into the experiment under MS and HS, at
45 days under LS (with exception of two seedlings) and at
60 days under FL (Fig. 2). No seedlings initiated the third flush
under HS and MS while 21 and 71% of seedlings initiated the
third flush under LS and FL, respectively.
Light level affected (p < 0.001) the RCD and HT of oak seed-
lings. As expected, RCD and HT increased (p < 0.001) over the
experimental period but their increase depended on light treat-
ment (Figs. 1 and 2). Over the experimental period, height only
increased (p < 0.001) under FL and LS while RCD increased
(p < 0.001) under all light levels. At the beginning of the exper-
iment, there was no difference in either RCD (p = 0.811) or HT
(p = 0.310). Difference in RCD was first detected at the 45th
day into the experiment, with HS having smaller (p < 0.002)
RCD than LS and FL at the 45th day into the experiment, and
with FL > LS > MS > HS (p ≤ 0.004) at the end of the experi-
ment. Difference in HT first appeared at the 60th day into the
Figure 1. Changes in root collar diameter (mm) over number of days
in treatment. The symbols are full sun (), light shade (× ), medium
shade (), and high shade (z). The data are mean values (n = 6) ± SE.
Figure 2. Changes in height (cm) over number of days in treatment.
The symbols are full sun (), light shade (×), medium shade (), and
high shade (z). The data are mean values (n = 6) ± SE.
114 G.G. Wang, W.L. Bauerle
experiment, with FL > HS and MS (p ≤ 0.011) at the 60th day
into the experiment and FL > HS/ MS (p < 0.005) and LS > HS
(p < 0.067) at the end of the experiment.
At the end of the experiment, total biomass and each biomass
component differed (p < 0.001) among the four light levels,
with FL > LS = MS > HS for TB (p ≤ 0.012) and RW (p ≤ 0.002),
FL > LS > MS = HS for SW (p ≤ 0.047), and FL > LS/MS/HS
(p ≤ 0.012) and LS > HS (p = 0.013) for LW (Tab. I). RSR, LWR
and LWRr were lower (p ≤ 0.001) under HS compared to other
light levels.
Leaf area supported by each seedling was affected (p <
0.001) by light environment, with FL being larger (p ≤ 0.005)
than MS and HS, and LS being larger than HS (p = 0.039)
(Tab. I). SLA differed (p < 0.001) among the four light levels,
with HS = MS > LS > FL (p < 0.001) (Tab. I). LAR differed
(p < 0.001) among the four light levels, with HS > MS > LS >
FL (p ≤ 0.047). LARr differed (p < 0.001) among the four light
levels, with HS > MS/LS/FL (p < 0.001) and MS > FL (p =
0.003).
3.2. Photosynthetic light acclimation
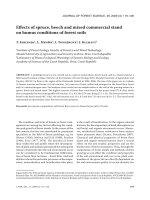
Oak seedlings showed light acclimation of photosynthetic
performance (Figs. 3A–3D). As growth irradiance declined, q
P
decreased from 37–72% in response to shade at higher values
of PPFD across all treatments (Fig. 3A). The gradient of per-
cent decline of q
p
increased as shade intensity was elevated
(Fig. 3A). Non-photochemical quenching (NPQ), a relative
estimate of thermal dissipation of excitation energy, was also
affected as shade intensity increased. In response to lower
growth light levels, NPQ versus actinic light increased by
approximately 30% (Fig. 3B). Figure 3B further illustrates that
NPQ and PS II reaction centers are affected in response to light
acclimation. Figure 3C illustrates a decrease of approximately
58% in φ
PS II
as actinic PPFD values increase. Oak seedlings
also showed a slight decrease of φ
PS II
as irradiance growth con-
ditions decreased (φ
PS II
~ 0.21 – 0.29), but the larger affect was
due to differences in actinic light. The ETR, illustrated in Figure
3D, followed a more pronounced pattern as opposed to φ
PS II
,
where the light saturated ETR was 46% lower in HS as opposed
to seedlings grown under FL conditions.
Figure 4 depicts the relationship between ETR and the driv-
ing force of electron transport to the reduction of the redox state
of the primary electron acceptor of PS II, which is approximated
by 1–q
P
. Figure 4 also illustrates an estimate of the flux of elec-
trons through PS II via the ETR. There was a clear separation
of irradiance response due to growth irradiance acclimation
among the seedlings. As 1–q
P
approached 1, the decline in ETR
curtailed off as shade intensity increased. Specifically, ETR
was 56% lower at the extreme difference between HS and FL,
where the apparent reduction in yield of ETR through PS II was
lowest in HS and highest under FL conditions.
Figure 5 is an indication that the photosynthetic apparatus
has a lower conductance as actinic light increases. The con-
ductance estimate is derived by dividing ETR by 1-q
P
to obtain
an approximate estimate of the conductance of the photosyn-
thetic apparatus [44]. The large drop in the ratio seen at low
PPFD in FL plants and slightly evident in HS plants, was a
result of a large reduction in the redox state at the lowest PPFD
levels. The lower response of HS plants was indicative of an
absent or possibly lower PPFD redox state reduction.
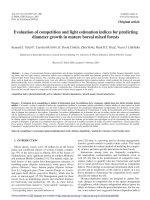
Osmond [35] used the ratio (1–q
P
)/NPQ as a measure of
the excess photons that reach PS II. It represents an index of
the susceptibility of PS II to light stress [37, 38]. Figure 6A
Tab le I. Growth and morphological variables (means with standard deviation in brackets) of Quercus alba L. seedlings after a full growing
season under different light treatments (HS = 5%, MS = 15%; LS = 30%, and FL = 100% full sunlight). Values in the same row with different
superscripts are significantly different (p < 0.05).
Light treatment
Variab les HS MS LS FL
Root collar diameter (RCD; mm)* 3.68
d
(0.25) 4.83
c
(0.35) 6.10
b
(0.55) 8.28
a
(1.13)
Height (HT; cm)* 14.9
c
(2.3) 15.8
b,c
(2.5) 20.9
a,b
(3.0) 27.4
a
(8.4)
Total biomass (TB; g)* 3.60
c
(0.33) 7.03
b
(0.97) 11.59
b
(1.72) 30.68
a
(17.22)
Root biomass (RW; g)* 2.09
c
(0.13) 4.83
b
(0.61) 7.78
b
(1.22) 20.67
a
(10.96)
Leaf biomass (LW; g)* 1.02
c
(0.16) 1.30
bc
(0.24) 2.07
b
(0.33) 5.06
a
(3.06)
Stem biomass (SW; g)* 0.49
c
(0.10) 0.85
c
(0.22) 1.74
b
(0.38) 4.93
a
(3.45)
Root to shoot ratio (RSR) 1.45
b
(0.23) 2.27
a
(0.29) 2.32
a
(0.23) 2.40
a
(0.40)
Leaf weight ratio (LWR) 0.28
a
(0.027) 0.20
b
(0.018) 0.18
bc
(0.020) 0.16
c
(0.021)
Leaf weight root ratio (LWRr) 0.49
a
(0.073) 0.29
b
(0.038) 0.27
b
(0.040) 0.24
b
(0.043)
Leaf area (LA; cm
2
)* 185.4
c
(31.4) 245.5
bc
(45.5) 340.2
ba
(57.0) 637.4
a
(378.1)
Specific leaf area (SLA; cm
2
g
–1
)* 180.1
a
(3.0) 180.2
a
(3.9) 162.7
b
(1.3) 127.3
c
(2.2)
Leaf area ratio (LAR; cm
2
g
–1
) 50.86
a
(5.63) 35.22
b
(3.27) 28.72
c
(3.40) 20.62
d
(2.74)
Leaf area root ratio (LARr; cm
2
g
–1
)88.23
a
(14.48) 51.54
b
(6.76) 43.37
bc
(6.83) 30.45
c
(5.32)
* Analysis of variance and multiple comparisons were based on log-transformed data. Transformation was made to overcome the problem of unequal
variances among groups.
Light acclimation in Quercus alba seedlings 115
illustrates that at low irradiance, the (1–q
P
)/NPQ level peaked
in FL and LS conditions, whereas MS and HS presented no
clear relationships. A clear separation between treatments is
evident in Figure 6B, where the NPQ/q
P
ratio versus irradiance
level increases with decreasing growth irradiance. Figure 6B
further illustrates the shift from photochemical to non-photo-
chemical quenching with increasing actinic light. The slope of
this relationship gives a relative value of the ‘quenching shift
rate’ [44]. As growth irradiance declined, the ‘quenching shift
rate’ increased as well, resulting in a decrease of over 3 fold
more in the HS versus FL treatment.
4. DISCUSSION
4.1. Growth
Light intensity strongly affected the development of Quer-
cus alba seedlings during their first growing season, even
though seedlings had been subjected to the same growing con-
ditions for three weeks before the start of the shading experi-
ment. This result agrees with previous studies on several oak
species [6, 7, 14, 18, 25, 53]. The strong treatment response
indicated that growth and biomass accumulation were deter-
mined by the seedling’s capacity to harvest energy and produce
photosynthates in their respective light environments, despite
that light availability may only limit growth after cotyledon
reserves are depleted [9, 32].
Although Quercus alba may develop up to four growth
flushes under optimum conditions, it usually develops only one
growth flush under low light beneath a dense canopy [40]. For
example, Quercus alba seedlings did not initiate the second
growth flush when growing naturally under a forest canopy
with light intensity between 3 to 18% full sunlight although
seedling biomass increased with light level [51]. With a few
exceptions, Quercus alba seedlings in our study completed two
growth flushes even under HS (5% of full sunlight). This appar-
ent contradiction may be attributed to the fact that all seedlings
Figure 3. Light acclimation of photosynthesis measured by modula-
ted chlorophyll a fluorescence in response to photosynthetic photon
flux density (PPFD) of: (A) photochemical quenching (q
P
); (B) non-
photochemical quenching (NPQ); (C) quantum yield of PS II (φ
PS II
);
and (D) electron transport rate (ETR). The symbols are full light (),
light shade (×), medium shade (), and high shade (z). The data are
mean values (n = 6) ± SE.
Figure 4. The approximate redox state of the primary electron accep-
tor (1–q
P
) and the electron transport rate (ETR). The symbols are full
light (), light shade (×), medium shade (), and high shade (z). The
data are mean values (n = 6) ± SE.
Figure 5. The irradiance dependence of the apparent reduction yield
of electron transport (ETR/1–q
P
). The symbols are full light (), light
shade (×), medium shade (), and high shade (z). The data are mean
values (n = 6) ± SE.
116 G.G. Wang, W.L. Bauerle
completed their first growth flush and about 80% initiated their
second growth flush during the three-week transplant acclima-
tion time before the start of the experiment. The optimized soil
moisture and nutrient condition and the lack of root competi-
tion, which are directly in contrast to forest understory envi-
ronments, may have also helped seedlings to cope with light
limitation in the greenhouse [25]. Nevertheless, the proportion
of seedlings initiating the third growth flush did reflect light
environment, with 0, 0, 20 and 71% seedlings initiating the
third growth flush for 5, 15, 30 and 100% of full sunlight,
respectively.
Regardless of light level, RCD growth continued during the
entire experimental period from May to September, following
a typical S-shape curve (Fig. 1). This result, together with the
absence of shade-induced mortality, suggested a net gain in car-
bohydrates for Quercus alba seedlings even under HS (5% of
full sunlight). However, such a low light intensity may not be
sufficient for Quercus alba seedlings to survive under a forest
canopy. For example, Jarvis [25] reported root competition
raised the compensation point of Quercus petraea from 6% to
15%. Similarly, Wang et al. [51] suggested a minimum of 15%
of full sunlight was needed to facilitate the early establishment
of white oak Quercus alba seedlings under a forest canopy. Our
seedlings achieved the largest diameter under FL, and RCD was
significantly reduced by decreasing light intensity (Tab. I).
Gardiner and Hodges [14], however, reported that diameter of
Quercus pagoda was significantly larger at 53% full sunlight
during the first growing season. In contrast to RCD, HT growth
was both episodic and stopped at a much earlier date (Fig. 2).
A very similar height growth pattern was observed in Quercus
rubra by Phares [39], and height growth stopped in early June,
mid-July and early August at 10, 30 and 100% of full sunlight,
respectively. Full sunlight seedlings were the tallest, which
agreed with McGee’s [31] study on northern red oak and Holmes’
study [22] on Quercus lobata but disagreed with Gardiner and
Hodges’ study [14] on Quercus pagoda and Phares’ study [39]
on Quercus rubra. Compared to height, diameter growth was
much more responsive to light intensity, which supports RCD
as a more sensitive measure of light competition compared to
HT [50, 52].
Because seedlings assigned to each light environment were
similar in HT and RCD (Figs. 1 and 2), biomass of these seedlings
must have been similar at the start of the experiment. Conse-
quently, the final differences in biomass among light environ-
ments suggested a growth difference due to differences in light
intensity. Increase in biomass with light intensity together with
the highest biomass observed under FL suggest that Quercus
alba seedlings must have a light saturation point > 30% full sun-
light or 525 μmol m
–2
s
–1
solar noon (248 μmol m
–2
s
–1
daily
average) when measured in cloudless day. Teskey and Shrestha
[47] reported a light saturation point of 650 μmol m
–2
s
–1
for
Quercus alba, and previous studies on other oak species all
reported that ≥ 37% of full sunlight was needed for the maxi-
mum biomass accumulation [14, 25, 29, 39, 53]. Compared to
the HS, Quercus alba seedlings growing under other light lev-
els allocate more to root than shoot as indicated by their higher
root to shoot ratio (Tab. I). The ability to maintain a constant
RSR from 15% to 100% of FL, with about 70% of total biomass
being allocated to roots, suggests root growth takes a clear pri-
ority over shoot growth during the first growing season unless
light is severely limited. Even under the most limited light con-
dition (5% of full sunlight) about 58% of the total biomass was
allocated to roots. This life history strategy should allow Quercus
alba to survive better under a frequent top-kill due to surface
fire as well as on dry sites or during drought periods. The same
strategy, however, may have also put Quercus alba at a disad-
vantage under fire suppression as well as on mesic or good qual-
ity sites where competition for light outweighs adaptation to
fire and/or drought. At the expense of allocating to roots and
stems, seedlings allocated more to leaves as light intensity
decreased, indicated by their higher LWR and LWRr.
Similar to previous studies on different oak species [18, 25,
29, 48, 53], our study found that SLA increased with shade
because of leaf acclimation to low light intensity. The lack of
significant difference in SLA between HS and MS is likely
attributed to the fact that most leaves had been initiated under
FL before the start of the experiment and, unlike seedlings
growing under FL and LS, only a small portion of the leaves
actually initiated their growth after the start of the experiment.
The significant differences in LAR found between light levels
indicated that the same amount of total biomass supported more
leaf area with decreasing light intensity, which is consistent
with several previous studies on oaks (e.g., [6, 18, 25, 29, 48]).
With increasing light intensity, photosynthesis rate increased
from HS to MS to LS to FL and thus more biomass was pro-
duced by the same amount of leaf area. The rapid rise in LAR
with decreasing light intensity (Tab. I) together with the ability
to maintain a positive carbon balance under 5% of full sunlight
suggest that Quercus alba may be more shade-tolerant than has
previously been reported, which partially explains why Quer-
cus alba can persist under forest canopies for more than
90 years [34, 41, 43]. As expected, LARr also decreased with
Figure 6. (A) The irradiance dependence of excitation pressure on PS II
(1–q
P
/NPQ). (B) The irradiance dependence of the ratio NPQ/q
P
. The
symbols are full light (), light shade (×), medium shade (), and high
shade (z). The data are mean values (n = 6) ± SE.
Light acclimation in Quercus alba seedlings 117
increasing light intensity, likely due to the light induced
increase in transpiration rate.
4.2. Chlorophyll fluorescence
To characterize light acclimation of photosynthesis, we used
modulated chlorophyll a fluorescence. Light acclimation of
light-saturated NPQ in Quercus alba seedlings is consistent
with findings in Digitalis [26] and Hibiscus [44]. The level of
total NPQ at saturating PPFD of 725 μmol m
–2
s
–1
in Quercus
alba is consistent with values found in obligate shade species
and sun species [26]. Alternatively, Osmond et al. [36] found
that some species acclimate, where plants exposed to high light
have a higher NPQ capacity than plants grown in low light. The
conflicting results emphasize the light acclimation strategies
that occur and the variation in thermal dissipation of excitation
energy among species.
Photochemical quenching (q
P
) is often used as an indicator
of PS II primary electron acceptor oxidation [10, 12, 23, 28, 44,
46], where the φ
PS II
is the product of q
P
and the excitation
energy transfer efficiency from the light harvesting complex of
PS II to the PS II reaction center [16]. Quercus alba showed a
larger decline in q
P
versus light with decreasing growth irradi-
ance as compared to φ
PS II
. The oxidation of the primary elec-
tron acceptor of PS II indicated by q
P
was more pronounced
than the loss of φ
PS II
, indicated by an increase in non-photo-
chemical quenching. The flux of electrons through PS II can
also be estimated as ETR. The relationship between ETR and
1–q
P
illustrated a clear differentiation of light acclimation
within the species, where the apparent reduction yield of elec-
tron transport through PS II was lowest in HS and highest in FL.
By dividing ETR by 1–q
P
, we obtained an estimate of con-
ductance of the photosynthetic apparatus. A comparison can then
be made to the apparent reduction yield of ETR versus 1–q
P
.
Other than low light levels of approximately 100 μmol m
–2
s
–1
,
the comparison indicates that as actinic light increased, the con-
ductance of the photosynthetic apparatus remained relatively
constant with changing irradiance. This is in agreement with
the light independent rate constant of reduction of P
700
+
reported by others [15, 21]. The higher conductance in FL seed-
lings is not surprising because electron transport chain conduct-
ance depends primarily on electron concentration components,
which are determined by light acclimation. The difference in
electron concentration components in plants exposed to high
light has been well established and it is likely the cause of dif-
ferences in photosynthetic apparatus conductance between
light treatments.
To estimate the amount of excess photons reaching PS II,
we used an index related to light acclimation, namely the ratio
(1–q
P
)/NPQ [35]. The ratio is also an index of the susceptibility
of PS II to light stress. The Quercus alba seedlings did not show
a constant ratio on (1–q
P
)/NPQ. Although the highest ratio was
found under low light conditions in FL seedlings, other light
levels did not follow suit. Other than this one instance, the
results do not indicate a clear separation in response to light
acclimation. The light response of the NPQ/q
P
ratio on the other
hand did present a clear light treatment response. The shift from
photochemical to non-photochemical quenching occurs as
actinic light increases and is a relative indication of the quench-
ing shift rate. The non-linear curves show the demand for elec-
tron flux through PS II, where LS, MS, and HS had a lower flux
of electrons through a reduced PS II.
In conclusion, Quercus alba seedlings demonstrated clear
photosynthetic acclimation and strong growth and allometric
responses to light intensity. After one growing season, the
greatest diameter and height growth were observed on seed-
lings under 100% of full sunlight, and these seedlings also sup-
ported a greater biomass (root, leaf and stem) and leaf area.
Seedlings under 15, 30 and 100% of full sunlight allocated
more biomass to roots (~ 70%) than seedlings under 5% of full
sunlight (~ 58%), suggesting a priority in root growth unless
light is severely limited. Leaf weight ratio, specific leaf area,
and leaf area ratio increased with the degree of shading, indi-
cating acclimation of leaves to different light intensities. Using
a steady-state irradiance during chlorophyll fluorescence meas-
urements of light response, we were able to obtain steady-state
results of quenching and provide insight into physiological con-
straints that manifest themselves in growth and survival
responses that may influence oak regeneration. A lack of stud-
ies prevents us from directly comparing our greenhouse study
with field experiments. Further work is needed to investigate
how Quercus alba seedlings respond to light intensity under
different overstory shading regimes in a dynamic light envi-
ronment.
Acknowledgements: We thank Joe Toler for statistical advice, and Ben
Knapp, Joe Bowden, Gavin Wiggins, and Forrest Wang for measure-
ment assistance. Clemson University and the State of South Carolina
Research and Experiment Station funded this research.
REFERENCES
[1] Abrams M.D., Where has all the white oak gone? Bioscience 53
(2003) 927–939.
[2] Abrams M.D., Ruffner C.M., Physiographic analysis of witness-
tree distribution (1765–1798) and present forest cover through
north central Pennsylvania, Can. J. For. Res. 25 (1995) 659–668.
[3] Abrams M.D., Orwig D.A., Demeo T.E., Dendroecological analy-
sis of successional dynamics for a presettlement-origin white-pine
mixed-oak forest in the Southern Appalachians, USA, J. Ecol. 83
(1995) 123–133.
[4] Bauerle W.L., Weston D.J., Bowden J.D., Dudley J.B., Toler J.E.,
Leaf absorptance of photosynthetically active radiation in relation
to chlorophyll meter estimates among woody plant species, Sci.
Hortic. 101 (2004) 169–178.
[5] Bilger W., Björkman O., Role of the xanthophyll cycle in photopro-
tection elucidated by measurements of light-induced absorbance
changes, fluorescence and photosynthesis in leaves of Hedera
canariensis, Photosynth. Res. 25 (1990) 173–185.
[6] Callaway R.M., Morphological and physiological-responses of
3 California oak species to shade, Int. J. Plant Sci. 153 (1992) 434–
441.
[7] Carvell K.L., Tryon E.H., The effect of environmental factors on
the abundance of oak regeneration beneath mature oak stands, For.
Sci. 7 (1961) 98–105.
[8] Cho D.S., Boerner R.E.J., Canopy disturbance pattern and regene-
ration of Quercus species in two Ohio old growth forests, Vegetatio
93 (1991) 9–18.
[9] Crow T.R., Reproductive mode and mechanisms for self-replace-
ment of northern red oak (Quercus rubra) – a review, For. Sci. 34
(1988) 19–40.
[10] Dau H., Molecular mechanisms and quantitative models of variable
photosystem II fluorescence, Photochem. Photobiol. 60 (1994) 1–23.
118 G.G. Wang, W.L. Bauerle
[11] Demmig-Adams B., Adams W.W., Xanthophyll cycle and light
stress in nature: Uniform response to excess direct sunlight among
higher plant species, Planta 198 (1996) 460–470.
[12] Dietz K J., Schreiber U., Heber U., The relationship between the
redox state of Q
A
and photosynthesis in leaves at various carbon-
dioxide, oxygen and light regimes, Planta 166 (1985) 219–226.
[13] Fralish J.S., Cooks F.B., Chambers J.L., Harty F.M., Comparison of
pre-settlement, second growth and old-growth forest on six site types
in the Illinois Shawnee Hills, Am. Midl. Nat. 125 (1991) 294–309.
[14] Gardiner E.S., Hodges J.D., Growth and biomass distribution of
cherrybark oak (Quercus pagoda Raf.) seedlings as influenced by
light availability, For. Ecol. Manage. 108 (1998) 127–134.
[15] Genty B., Harbinson J., Regulation of light utilization for photosyn-
thetic electron transport, in: Baker N.R. (Ed.), Photosynthesis and
the Environment, Kluwer Academic Publishers, Dordrecht, The
Netherlands, 1996, pp. 67–99.
[16]Genty B., Briantais J.M., Baker N.R., The relationship between the
quantum yield of photosynthetic electron transport and quenching
of chlorophyll fluorescence, Biochim. Biophys. Acta 990 (1989)
87–92.
[17] Glitzenstein J.C., Canham C.D., McDonnell M.J., Streng D.R.,
Effects of environment and land-use history on upland forest of the
Cary Arboretum, Hudson Valley, New York, Bull. Torrey Bot.
Club 117 (1990) 106–122.
[18] Gottschalk K.W., Shade, leaf growth and crown development of
Quercus rubra, Quercus velutina, Prunus serotina and Acer
rubrum Seedlings, Tree Physiol. 14 (1994), 735–749.
[19] Hansen U., Fiedler B., Rank B., Variation of pigment composition
and antioxidative systems along the canopy light gradient in a
mixed beech/oak forest: a comparative study on deciduous tree spe-
cies differing in shade tolerance, Trees 16 (2002) 354–364.
[20] Hansen U., Schneiderheinze J., Rank B., Is the lower shade tole-
rance of Scots pine, relative to pendunculate oak related to the com-
position of photosynthetic pigments? Photosynthetica 40 (2002)
369–374.
[21] Harbinson J., Hedley C.L., The kinetics of P-700
+
reduction in lea-
ves: A novel in situ probe of thylakoid functioning, Plant Cell Envi-
ron. 12 (1989) 357–369.
[22] Holmes T.H., Woodland canopy structure and the light response of
juvenile Quercus lobata (Fagaceae), Am. J. Bot. 82 (1995) 1432–
1442.
[23] Horton P., Hauge A., Studies on the induction of chlorophyll fluo-
rescence in isolated barley protoplasts. IV. Resolution of non-pho-
tochemical quenching, Biochim. Biophys. Acta 932 (1988) 107–115.
[24] Hunt R., Lloyd P.S., Growth and partitioning, New Phytol. 106
(1987) 235–249.
[25] Jarvis P.G., The adaptability to light intensity of seedlings of Quer-
cus petraea (Matt.) Leibl., J. Ecol. 52 (1964) 545–571.
[26] Johnson G.N., Young A.J., Horton P., Activation of non-photoche-
mical quenching in thylakoids and leaves, Planta 194 (1994) 550–
556.
[27] Johnson P.S., Shifley S.R., Rogers R., The ecology and silviculture
of oaks, CABI Publishing, New York, 2002.
[28] Lavergne J., Trissl H-W., Theory of fluorescence induction in pho-
tosystem II: Derivation of analytical expressions in a model inclu-
ding exciton-radical-pair equilibrium and restricted energy transfer
between photosynthetic units, Biophys. J. 68 (1995
) 2474–2492.
[29] Loach K., Shade tolerance in tree seedlings II. Growth analysis of
plants raised under artificial shade, New Phytol. 69 (1970) 273–286.
[30] Loftis D.L., McGee C.E. (Eds.), Oak regeneration: Serious problems,
practical recommendations, Department of Agriculture Forest Ser-
vice, General Technical Report SE-84, Asheville, NC, 1993.
[31] McGee C.E., Northern red oak seedling growth varied by light
intensity and seed source, USDA Forest Service Research Note SE,
SE-90, 1968.
[32] Musselman R.C., Gatherum G.E., Effects of light and moisture on
red oak seedlings, Iowa State J. Sci. 43 (1969) 273–284.
[33] Ögren E., Evans J.R., Photosynthetic light-response curves. I. The
influence of CO
2
partial pressure and leaf inversion, Planta 189
(1993) 182–190.
[34] Orwig D.A., Abrams M.D., Dendroecological and ecophysiologi-
cal analysis of gap environments in mixed-oak understoreys of nor-
thern Virginia, Funct. Ecol. 9 (1995) 799–806.
[35] Osmond C.B., What is photoinhibition? Some insights from com-
parisons of shade and sun plants, in: Baker N.R., Bowyer J.R.
(Eds.), Photoinhibition of Photosynthesis: From Molecular Mecha-
nisms to Field, Environmental Plant Biology, BIOS, Oxford, 1994,
pp. 1–24.
[36] Osmond C.B., Ramus J., Levavasseur G., Franklin L.A., Henley
W.J., Fluorescence quenching during photosynthesis and photoin-
hibition of Ulva rotundata Blid., Planta 190 (1993) 97–106.
[37] Park Y I., Chow W.S., Anderson J.M., The quantum yield of pho-
toinactivation of photosystem II in pea leaves is greater at low than
high photon exposure, Plant Cell Physiol 36 (1995) 1163–1167.
[38] Park Y I., Chow W.S., Anderson J.M., Hurry V.M., Differential
susceptibility of photosystem II to light stress in light acclimated
pea leaves depends on the capacity for photochemical and non-
radiative dissipation of light, Plant Sci. 115 (1996) 137–149.
[39] Phares R.E., Growth of red oak (Quercus rubra L.) seedlings in
relation to light and nutrients, Ecology 52 (1971) 669–672.
[40] Reich P.B., Teskey R.O., Johnson P.S., Hinckley T.M., Periodic
root and shoot growth in oak, For. Sci. 26 (1980) 590–598.
[41] Rentch J.S., Fajvan M.A., Hicks R.R. Jr., Oak establishment and
canopy accession strategies in five old-growth stands in the central
hardwood forest region, For. Ecol. Manage. 184 (2003) 285–297.
[42] Rice S.A., Bazzaz F.A., Quantification of plasticity of plant traits in
response to light intensity: comparing phenotype at a common wei-
ght, Oecologia 78 (1989) 502–507.
[43] Rogers R., White oak (Quercus alba L.), in: Burns R.M., Honkala
B.H. (Eds.), Silvics of North America: Vol. 2, Hardwoods, Agric. Hand.
654, USDA Forest Service, Washington, DC, 1990, pp. 605–613.
[44] Rosenqvist E., Light acclimation maintains the redox state of the PS
II electron acceptor Q
A
within a narrow range over a broad range of
light intensities, Photosynth. Res. 70 (2001) 299–310.
[45] Schindler C., Lichtenthaler H.K., Photosynthetic CO
2
-assimilation,
chlorophyll fluorescence and zeaxanthin accumulation in field
grown maple trees in the course of a sunny and a cloudy day, J.
Plant Physiol. 148 (1996) 399–412.
[46] Schreiber U., Bilger W., Neubauer C., Chlorophyll fluorescence as
a nonintrusive indicator for rapid assessment if in vivo photosyn-
thesis, in: Schulze E.D., Caldwell M.M. (Eds.), Ecophysiology of
photosynthesis, Springer-Verlag, Berlin, 1994, pp. 49–70.
[47] Teskey R.O., Shrestha R.B., A relationship between carbon
dioxide, photosynthetic efficiency and shade tolerance, Physiol.
Plant. 63 (1985) 126–132.
[48] Valladares F., Chico J.M., Aranda I., Balaguer L., Dizengremel P.,
Manrique E., Dreyer E., The greater seedling high-light tolerance of
Quercus robur over Fagus sylvatica is linked to a greater physiolo-
gical plasticity, Trees 16 (2002) 395–403.
[49] Van Kooten O., Snel J.F.H., The use of chlorophyll fluorescence
nomenclature in plant stress physiology, Photosynth. Res. 25
(1990) 147–150.
[50] Wagner R.G., Radosevich R., Neighborhood predictors of interspe-
cific competition in young Douglas-fir plantation, Can. J. For. Res.
21 (1991) 821–828.
[51] Wang G.G., Van Lear D.H., Bauerle W.L., Effects of prescribed
fires on the survival and growth of white oak (Quercus alba L.) see-
dlings, For. Ecol. Manage. 213 (2005) 328–337.
[52]Wang G.G., Siemens J.A., Keenan V., Philippot D., Survival and
growth of black and white spruce seedlings in relation to stock type,
site preparation and plantation type in southeastern Manitoba, For.
Chron. 76 (2000) 775–782.
[53]Ziegenhagen B., Kausch W., Productivity of young shaded oaks
(Quercus robur L.) as corresponding to shoot morphology and leaf
anatomy, For. Ecol. Manage. 72 (1995) 97–108.