Báo cáo lâm nghiệp: "A fire probability model for forest stands in Catalonia (north-east Spain)" pptx
Bạn đang xem bản rút gọn của tài liệu. Xem và tải ngay bản đầy đủ của tài liệu tại đây (1.02 MB, 8 trang )
169
Ann. For. Sci. 63 (2006) 169–176
© INRA, EDP Sciences, 2006
DOI: 10.1051/forest:2005109
Original article
A fire probability model for forest stands in Catalonia
(north-east Spain)
José Ramón GONZÁLEZ
a
*, Marc PALAHÍ
a
, Antoni TRASOBARES
b
, Timo PUKKALA
c
a
Centre Tecnològic Forestal de Catalunya, Pujada del seminari s/n, 25280, Solsona, Spain
b
ForEco Technologies, Av. Diagonal 416, Estudio 2, Barcelona 08037, Spain
c
University of Joensuu, Faculty of Forestry, PO Box 111, 80101 Joensuu, Finland
(Received 25 April 2005; accepted 3 October 2005)
Abstract – The study presents a model for the probability of fire occurrence in forest stands of Catalonia. It was developed based on data from
the Second Spanish National Forest Inventory (II IFN) and perimeters of the forest fires that occurred in Catalonia during a 12-year period that
followed the II IFN measurement. The model was developed for forest planning, which means that the probability of fire was predicted from
variables that are known in forest planning calculations. The model is suitable for both even-aged and uneven-aged stands, as well as pure and
mixed stands. The variables included in the model represented easily measurable forest characteristics like elevation, tree size, stand structure
and species composition. According to the model, the probability of a forest stand to become affected by forest fire increased with: lower
altitudes, smaller diameters, larger basal areas, higher proportion of coniferous species and increasing variation in tree diameter. Although fire
occurrence is a highly stochastic phenomenon, the model and all its parameters were significant, and the test results were consistent. The
presented model can be used in stand and forest level optimizations that consider the effect of fire risk on optimal management.
fire / model / forest stands / Catalonia
Résumé – Modèle de probabilité de feux pour des peuplements forestiers de Catalogne (Nord-Est de l’Espagne). Cette étude présente un
modèle pour les probabilités d’occurrence des feux dans des peuplements forestiers en Catalogne. Il a été développé sur la base de données du
deuxième Inventaire Forestier National Espagnol (II IFN) et des périmètres des feux de forêts qui se sont produits en Catalogne pendant une
période de 12 ans qui a suivi les mesures du II IFN. Le modèle a été développé pour la planification forestière ce qui veut dire que la probabilité
de feux était prédite à partir de variables qui étaient connues dans les calculs de planification forestière. Le modèle est approprié pour les
peuplements équiennes et inéquiennes, de même que pour les peuplements purs ou les peuplements mélangés. Les variables incluses dans le
modèle sont des caractéristiques facilement mesurables comme l’altitude, la dimension des arbres, la structure des peuplements et les espèces
constituant le peuplement. D’après le modèle, la probabilité qu’un peuplement forestier soit affecté par un feu augmente avec : une altitude
basse, des petits diamètres, des surfaces terrières importantes, une forte proportion de conifères et une augmentation de la variation du diamètre
des arbres. Bien que l’occurrence d’un feu soit un phénomène hautement stochastique, le modèle et tous ses paramètres étaient significatifs, et
les résultats des tests étaient cohérents. Le présent modèle peut être utilisé à pour des optimisations, l’échelle du peuplement ou de la forêt, qui
prennent en compte le risque de feu pour une gestion optimale.
feu / modélisation / peuplements forestiers / Catalogne
1. INTRODUCTION
Fire is a major component in many forested ecosystems and
has a great influence on the ecological and economic functions
of forest in these places. In the Mediterranean basin, fire has
become a very serious problem during the last two decades and
is currently the main cause of forest destruction, with an aver-
age burned area of 500000 ha per year [32]. In Catalonia, where
1288 km
2
out of the total of 32000 km
2
burned during the last
decade [6], forest fires are perceived as the main environmental
problem [22]. Therefore, active and preventive forest manage-
ment through adequate fire risk reduction policies should have
a high priority in Catalonia. In this context, a fire risk assess-
ment model would be useful to assess forest management
options with respect to fire risk issues.
Variables that affect the probability that a fire hits the stand
may be divided into controllable and uncontrollable variables,
on one hand, and variables of known and unknown values, on
the other. Models used for predicting future states should
employ predictors whose future value is known with reasonable
accuracy. Of these variables, forest planning deals with con-
trollable variables, i.e. variables that are under the control of
* Corresponding author:
Article published by EDP Sciences and available at or />170 J.R. González et al.
the forest manager. If a low occurrence of fire is a management
objective, planning should find such values for the controllable
variables that keep the probability of fire at an acceptable level.
Examples of variables that are both controllable and known
to forest planning systems are stand density, species composi-
tion and vertical structure of the canopy. From previous
research it is known that all these variables correlate with the
likelihood of fire damage (e.g. [7, 19, 29]). By decreasing stand
density, removing low canopy layers and favoring hardwood
a manager may decrease the probability of fire damage and
make it easier to extinguish the fire if it starts.
The probability of fire depends significantly on weather con-
ditions (e.g. [1, 30]). Unfortunately, the exact weather condi-
tions of a particular forest in the future are not known, which
means that models based on weather factors cannot be used in
forest planning, the purpose of which is to predict the long-term
consequences of management alternatives. On the other hand,
the long-term averages of climatic factors are known, which
means that they could be used as model predictors. The long-
term averages of climatic factors correlate with site parameters
such as longitude, latitude, elevation and aspect, implying that
site parameters could replace climatic variables in modelling.
Many authors have remarked that the type, quantity and dis-
tribution of forest fuels affect fire occurrence and damage (e.g.
[15, 31]). The quantity and state of fuels is seldom known
exactly in forest planning since the amount of deadwood and
its state of decomposition are not usually measured or pre-
dicted. However, it may be assumed that the total amount and
the characteristics of fuels correlate with growing stock and site
characteristics, meaning that models based on stand and site
characteristics may, to some extent, also account for the vari-
ation in fire probability caused by the quantity and properties
of fuels.
Forest stands may be even-aged or uneven-aged, and the spe-
cies mixture may vary. A risk model useful for forest planning
should take stand structure and species composition into
account and it should involve variables that are available in for-
est inventories. Such a model, based on empirical data, should
be able to predict the effects of silvicultural treatments and
types of management on the risk of fire in a given stand. The
existent fire risk models seem not to fulfil all these require-
ments. Some predict age-dependent fire risk [18, 20], and oth-
ers like the fire hazard rating model used by Thompson et al.
[23], are based on qualitative expert assessments.
The aim of this study was to develop a stand-level model for
the probability of fire adequate for forest management planning
in Catalonia. The model should use variables that are normally
measured in forest inventories in the region or otherwise avail-
able in forest management planning. The model should be able
to predict the probability of fire occurrence for any forest stand
in Catalonia, depending on the site and structure of the stand.
2. MATERIALS AND METHODS
2.1. Inventory plots
The modelling data comprised inventory data of forest stands, on
one hand, and fire occurrence data, on the other hand. The data on for-
est stands were obtained from the Second Spanish National Forest
Inventory (II IFN) in Catalonia [9–12]. The IFN data consist of a sys-
tematic sample of permanent plots, distributed on a square grid of
1 km, with a re-measurement interval of 10 years. The sampling
method used circular plots with radius depending on the tree diameter
at breast height (dbh, 1.3 m): 5 m radius was used for trees with dbh
between 7.5 and 12.4 cm; 10 m for 12.5–22.4 cm; 15 m for 22.5–
42.4 cm; and 25 m for trees with dbh greater than or equal to 42.5 cm.
The following data were recorded for each sample tree: species, dbh,
height, and distance and azimuth from the plot centre. Information
about the abundance, mean height, and species composition of small
trees (dbh < 7.5 cm) and bushes was also collected.
The II IFN in Catalonia took place in 1989 and 1990 and covered
a surface area of 32114 km
2
. A total of 10855 inventory plots meas-
ured over the whole of Catalonia were used in this study. These plots
represented 52 different forest types depending on the dominant spe-
cies. The elevation of the plots ranged from sea level up to over 2300 m.
2.2. Fire data
The fire data consisted of the perimeters of forest fires larger than
20 ha for the entire Catalonian region, collected during the 12-year
period posterior to the II IFN (1991 to 2002). These fires accounted
for approximately 95% of the total burned area. The fire perimeters
were determined on a 1:50000 scale by the Department de Medi Ambi-
ent i Habitatge and the Institut Cartográfic de Catalunya as follows.
The information of the fire reports (date of the fire, initiation coordi-
nates, estimated area burned, etc.) was compared with images of the
burned areas (LANDSAT, SPOT, CASI or ortophotos). For each fire,
a file was created with georeferenced data from the affected area, both
before and after the fire. The data were processed to estimate the effect
of fire on the vegetation cover, using the Normalized Difference Veg-
etation Index (NDVI) [27] and principal components analysis. Digital
classification was used for delineating the fire perimeter. A posterior
control phase allowed a more accurate differentiation of the burned
and unburned areas. Unburned areas that were inside the perimeters
delineated in the first step were removed in the second step. A total
number of 4 699 burned areas were recorded during the 12 year period,
corresponding to 231 fires, with a total area of 141 317 ha.
2.3. Data preparation
After collecting the IFN and fire perimeter data, the next step was
to indicate if the plots of the II IFN for Catalonia were burned during
the studied period (1991–2002). A binary categoricalvariable was cre-
ated, equalling 0 if the plot was not burned and 1 if the plot was burned.
To obtain this information, spatial layers from both sets of data (IFN
plots and fire perimeters) were overlaid using GIS tools (Arc Map 8.3).
From this map, the IFN plots located within fire perimeters were clas-
sified as plots that were burned during the 12-years period. The data
showed that 770 out of 10 855 IFN plots were burned.
2.4. Fire probability modelling
Fire occurrence is a discrete event. Many distribution functions
have been proposed for the analysis of a dichotomous outcome vari-
able. Cox and Snell [3] discussed some of these. The logistic distri-
bution was used since it is mathematically flexible, easy to use, and
has a meaningful interpretation [8]. The logistic model offers a con-
venient way to constrain predictors to the interval {0, 1} [28]. After
the model form and error structure was hypothesized, the key question
was to specify a set of independent variables which could explain in
a logical and statistically significant way the probability of a fire to
occur in a given forest stand. Since the aim of the study was to develop
a fire probability model applicable to forest management planning,
Fire probability model for forest stands 171
variables that can be easily calculated from forest inventory data, or
predicted using growth models (e.g., [24, 25]), and which can be affected
through forest management, were tested as potential predictors.
In this study, the primary sources of risk were assumed to be related
to the structural and compositional characteristics of stands, as well
as site factors. Therefore, a number of potential independent variables
representing stand structure, species composition and site were tested.
A logistic model to predict the probability of fire in a forest stand was
fitted to the modelling data using the binary logistic procedure in SPSS.
The predictors were selected taking into account three criteria. Firstly,
log-likelihood ratio tests were used to determine whether the addition
of the variable improved the model significantly. Secondly, the impor-
tance of the variable in terms of forest inventory and management as
well as its simplicity was considered. Finally, the effect of adding the
variable on the odds ratio of the variables already in the model was
calculated. The odds for an event are defined as the probability that
the event occurs divided by the probability that the event does not occur
[13]. The odds ratio quantifies how many times more (or less) the event
is likely to occur at the known levels of the predictors.
3. RESULTS
3.1. Fire probability model
After analysing several combinations of predictors and con-
sidering that all predictors had to be significant at the 0.05 level,
the selected fire probability model was as follows:
See equation (1):
(1)
where P
fire
is the 12-year probability of fire occurring in a given
stand, Ele is elevation (in hundreds of meters), Dg is the basal-
area-weighted mean diameter (cm) of trees, G is the total basal
area (m
2
ha
–1
), P
hard
is the proportion of hardwood species of
the number of trees ha
–1
, and SD is the standard deviation of
the breast height diameters of trees (cm). The last predictor (SD/
(Dg + 0.01)) expresses the relative variability of tree diameters.
The variable is close to one in rather uneven stands and
approaches to zero in homogeneous stands.
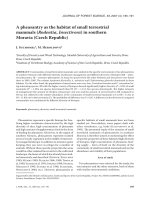
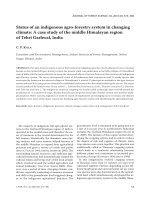
The logarithm of the maximum value of Ele-6 and 1 was
used to express the trend seen in the modeling data (Fig. 1)
which indicates that most fires occur at elevations ranging from
0 to 700 m. Beyond 700 m a.s.l. the fire occurrence declines
sharply (see Fig. 1). Several other variables expressing site fac-
tors like latitude, aspect and continentality were also tested, as
well as variables related to stand structure and species compo-
sition; like the amount of bushes, small trees and various spe-
cies groups. However, the best fit was obtained with the
variables given in equation (1), which gave a Nagelkerke R
Square of 0.181. Collinearity statistics were calculated to detect
the presence and severity of multicollinearity, and they showed
no significant multicollinearity.
All variables included in the logistic model (Tab. I) were sig-
nificant according to the Wald test (p < 0.05). The predictors
included in the fire probability model may be divided roughly
into three categories: variables describing stand structure,
namely G, Dg and the ratio between SD and Dg; a variable
describing the species composition (P
hard
) and a variable
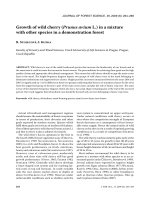
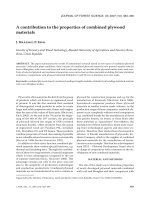
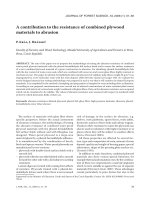
describing site (Ele). According to the model, the higher the eleva-
tion the lower is the probability of fire (Fig. 2). Furthermore, forest
stands with higher values of G and SD have a higher probability
P
fire
1
b
0
b
1
max Ele–6,1{}()b
2
Dg×+ln×+–
exp+
=
b
3
Gb
4
P
hard
b
5
SD
DG 0.01+
–1
×+×+×+
–1
Figure 1. Elevation ranges (a) and the potential evapotranspiration of thermal regions (b): 855 to 997 mm in Mesothermic III (B'3), 712 to
855 mm in Mesothermic II (B'2), 572 to 712 mm in Mesothermic I (B'1), 427 to 572 mm in Mesothermic II (C'2), and 286 to 427 mm in Meso-
thermic I (C'1). Fire perimeters during 1991–2002 are shown in both maps.
172 J.R. González et al.
of fire (Fig. 3), while stands with higher values of P
hard
and Dg
have a lower probability of fire (Fig. 3).
3.2. Odds ratio analyses
Due to the form of equation (1), the odds ratio of several pre-
dictors could not be obtained as by exponentiating the value of
the predictor [8]. For example, Ele and Dg do not have a con-
stant odds ratio across their different values since Ele is intro-
duced in a logarithmic form and Dg appears twice, once as such
and the other time in the variability ratio. Therefore, the odds
ratios were computed by exponentiating the algebraic differ-
ence between the logits at two reasonable levels of the risk
factor being compared. In this way, the odds ratios for different
units of change could be analyzed.
From the analyses conducted it can be interpreted that a
100 m decrease of elevation, from 800 m to 700 m, would
Table I. Regression coefficient of equation (1), their standard deviations (S.E.) and statistical significance.
Variable Coefficient S.E. Wald statistic Significance
Constant –1.925 0.085 510.255 0.000
ln(max{Ele-6, 1}) –2.256 0.181 155.389 0.000
Dg –0.015 0.006 5.942 0.015
G 0.012 0.006 5.086 0.024
P
hard
–1.763 0.121 211.328 0.000
SD/(Dg + 0.01) 2.081 0.541 14.780 0.000
Figure 3. Effect of basal-area-weighted mean diameter (Dg), standard deviation of dbh (SD), proportion of hardwood in number of trees (P
hard
),
and total basal area (G) on the probability of fire.
Figure 2. Effect of altitude on the probability of fire.
Fire probability model for forest stands 173
increase the probability of fire by almost 5 times. However, the
same decrease (100 m) happening from 1400 m to 1300 m
would increase the probability by only 1.35 times. On the other
hand, a change of 100 m from any elevation lower than or equal
to 700 would not have any effect on the probability of fire. The
effect of a change in Dg had also an important effect on the
probability of fire, but it was not constant across different val-
ues. For example, a change of Dg from 45 cm to 15 cm in a
stand with a value of SD of 10 (very uneven stand) would
increase the probability of fire by 4 times. However, the same
change in a stand with SD equal to zero (completely homoge-
neous stand) would increase the probability by only by
1.6 times.
Another model predictor having a strong relative effect was
P
hard
. The odds ratio for this predictor shows that a change of
0.1 in this predictor would increase the probability of fire by
1.2 times. A change of P
hard
from 1 (pure hardwood stand) to
0 (pure coniferous stand) would increase the probability of fire
by 5.8 times. In the case of G, the change of odds per one unit
change of the variable did not have a strong relative effect. An
increase of 10 m
2
ha
–1
would increase the risk of fire by
1.2 times. Finally, the variability ratio had also a very strong
relative effect; a change from 0.1 (even stand) to 1 (rather une-
ven stand) would increase the probability of fire by 6.5 times.
3.3. Predicted probability by species
Figure 4 shows the predicted vs. observed 12-year fire prob-
ability rates of plots with different main species. The overall
trend of predictions for different species is logical and close to
the observed fire occurrence. Predictions for Pinus pinea and
Pinus pinaster are higher than the observed fire occurrence,
while the predictions for stands dominated by Pinus nigra are
lower than the observed one. The last result can be explained
by the catastrophic fires of 1994 and 1998, which destroyed
together almost 30000 ha of Pinus nigra stands [4, 5]. The dif-
ference between the predicted and observed fire probabilities
in stands dominated by Pinus pinaster and Pinus pinea can be
explained by the small proportion of these type of forests in
Catalonia; the observed risk may be an underestimate in the
longer run whereas the model predictions seem logical.
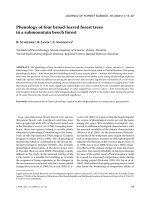
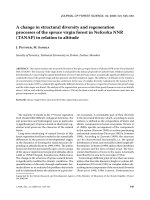
3.4. Application example
To evaluate the effects of potential management actions, the
fire risk model was used to compute the probability of fire for
several forest stands with an elevation of 700 m but different
size structures and species compositions. The 12-year fire prob-
ability was 0.209 for the pure coniferous stand with uneven-
aged structure (Fig. 5a). The stand resembling a two-layered
dense structure (Fig. 5b) had also a high probability (0.192).
These results can be explained by the high values of SD (9.2
and 12.7 cm, respectively for the uneven and the two-layered
stands), while Dg was not extremely high and the percentage
of hardwoods was zero. Figures 5c and 5d show how the prob-
ability of fire can be modified by two different management
operations with a starting point in Figure 5b. A complete
removal of the lower tree layer present in Figure 5b would mean
a reduction of fire risk from 0.192 to 0.090 (Fig. 5c). A heavy
high thinning in the stand of Figure 5b reduces the probability
of fire from 0.192 to 0.160 which is much less than the effect
of low thinning (Fig. 5d).
Figure 5e shows the probability of fire for a two-layered
stand with the same structural characteristics as in the stand of
Figure 5b except that the lower story consists of hardwoods. As
result of the high percentage of hardwoods (P
hard
= 0.87) the
probability of fire is low. Figures 5f, 5g and 5h show the prob-
ability of fire for pure hardwood stands with different stand
structures. Of these, the probability was the lowest for the
sparse stand resembling a mature stage, and highest for the two-
layered stand of Figure 5f. The stands in Figures 5f, 5g and 5h
have the same structural characteristics as the stands in
Figures 5b, 5c and 5d, respectively, differing only in species
composition.
4. DISCUSSION
The fire probability model for forest stands in Catalonia pre-
sented in this study opens many possibilities to integrate the risk
of fire into forest management planning and decision-making.
The parameters included in the model represented easily meas-
urable forest characteristics such as elevation, tree size, struc-
ture and species composition. Some of these variables, namely
stand structure and species composition are under the control
of the forest manager, which permit a forest landowner to have
the reduction of fire risk as a management objective in numer-
ical planning calculations. The variables included in the model
were assumed to have a clear relationship with variables nor-
mally used to explain potential fire behavior. For example,
stand composition and structure have a clear effect on the
amount and vertical distribution of aerial fuels, and they also
affect the amount of ground vegetation and deadwood through
competition and suppression processes. Even microclimatic
conditions inside the forest stand are partially regulated by can-
opy closure and light interception. Another model variable with
Figure 4. Twelve-year probability of fire for stands with different
main species as observed, calculated from the mean of the risks esti-
mated for each inventory plot, and estimated using the average values
of predictors in plots with different main species.
174 J.R. González et al.
Figure 5. Fire risk depending on stand structure and composition.
Fire probability model for forest stands 175
a great influence on fuel moisture is elevation which correlates
with precipitation and temperature.
Elevation appeared to be a very important variable in terms
of odds ratio. As shown in Figure 1, the number and sizes of
fires decrease sharply above 700 m a.s.l. It is also evident from
Figure 1 that evapotranspiration is highly correlated with ele-
vation, which can explain the importance of this variable. The
non-linear relationship of this variable with a constant fire
probability below a limiting elevation is consistent with a pre-
vious study by Schoenberg et al. [21] who report a non-linear
effect of fuel moisture, temperature and precipitation on the
burned area, the burned area changing with these variables up
to a certain threshold. Other factors related to elevation like the
presence of people could also play a role. However, further
research is needed to expand the model to include socio-eco-
nomic and infrastructural variables such as density of people
and proximity of roads.
Species composition of the stand is an important factor for
fire, and it was included in the model through the P
hard
variable.
This predictor is crucial to explain the significant difference
between fire occurrence in coniferous and hardwood stands
present in the modelling data. Many authors (e.g. [2, 28]) have
pointed out the high inflammability of coniferous species due
to their high content of resin and essential oils, which make
them vulnerable to fire. The other model predictors explain the
effect of several forest stand characteristics on the probability
of fire. The parameters of these predictors support previous
knowledge which states that stands resembling mature sparse
even-aged forests have a lower fire risk than dense and multi-
layered stands [19].
The logistic model has been used earlier for predicting wind
and snow damage probability as a function of stand variables
[13, 16], but no management-oriented model for the probability
of fire occurrence has been presented so far based on empirical
data. The model enables the quantification of the effects of
management on the probability of fire and therefore allows for
the development of silvicultural strategies that take the risk of
fire into account. For instance, the model can be used in stand-
level optimization studies [26] to find the optimal management
for different species and stand structures taking into account the
probability of fire. Landscape level forest planning studies can
also be conducted based on the fire probability model; the prob-
ability can be calculated for each of the stands in the landscape
and then spatial optimization techniques can be used to reduce
the continuity of risky stands or to create a fragmented land-
scape with respect to high risk stands [15]. The model presented
has also use in forest policy planning, enabling scenario anal-
yses of policy alternatives to take the risk of fires into account.
The National Forest Inventory plots (IFN II) and the fire
perimeter data for Catalonia provide an outstanding database
in terms of size and representation of forest conditions in Cata-
lonia. During the study period, according to historical fire
records, fires bigger than 20 ha account for over 95% of the for-
est area burned in Catalonia. The 12-year fire period used for
the study gives also representative information about the fire
regime in the region. However, since fire is a very erratic event,
longer observation periods will certainly enable future
improvements in the model.
The purpose of risk models is to estimate the probability that
a hazardous event will happen during a period of time in a cer-
tain place. Due to the highly stochastic nature of many distur-
bances like forest fires, the probability does not give us a certain
answer if the event will really happen in that place during that
period of time. In the case of fire the prediction becomes espe-
cially uncertain in small areas and short periods of time, where
the influence of ignition points of adjacent areas is great [14,
17]. The presented model gives us a clue about the endogenous
stand factors that affect fire probability, and how the probability
can be modified by varying these factors through forest man-
agement.
Acknowledgements: The authors want to thank the members of the
Servei de Prevenció d'Incendis Forestals of Catalonia for providing the
fire data used in this study. This study is enclosed in the EFORWOOD
project and has been conducted within the MEDFOREX program
coordinated by the Forest Technology Centre of Catalonia. We are
grateful to Mr. David Gritten for the linguistic revision of the manu-
script.
REFERENCES
[1] Andrews P.L., BEHAVE: Fire behavior prediction and fuel mode-
ling system-BURN subsystem, Part 1, Gen. Tech. Rep. INT-194.
Ogden, UT: US Department of Agriculture, Forest Service, Inter-
mountain Research Station, 1986, 130 p.
[2] Bond W.J., Van Wilgen, B.W., Why and how do ecosystems burn?
Fire and Plants, Chapman & Hall, 1996, pp. 17–33.
[3] Cox D.R., Snell E.J., Analysis of Binary Data, 2nd ed., Chapman &
Hall, London, 1989, 236 p.
[4] DGCN, Los incendios forestales en España durante el año 1994,
Dirección General de Conservación de la Naturaleza, MMA,
Madrid, 1994.
[5] DGCN, Los incendios forestales en España durante el año 1994,
Dirección General de Conservación de la Naturaleza, MMA,
Madrid, 1998.
[6] DGCN, Los incendios forestales en España. Decenio 1991–2000,
Dirección General de Conservación de la Naturaleza, MMA,
Madrid, 2002.
[7] Finney M.A., Modeling the spread and behavior of prescribed natu-
ral fires, Proc. 12th Conf. Fire and Forest Meteorology, 1994,
pp. 138–143.
[8] Hosmer D.W., Lemeshow S., Applied logistic regression, 2nd ed.,
Wiley, Series in Probability and Statistics, New York, 2000.
[9] ICONA, Segundo Inventario Forestal Nacional (1986–1995)
Cataluña: Barcelona, MAPA, Madrid, 1993.
[10] ICONA, Segundo Inventario Forestal Nacional (1986–1995)
Cataluña: Girona, MAPA, Madrid, 1993.
[11] ICONA, Segundo Inventario Forestal Nacional (1986–1995)
Cataluña: Lleida, MAPA, Madrid, 1993.
[12] ICONA, Segundo Inventario Forestal Nacional (1986–1995)
Cataluña: Tarragona, MAPA, Madrid, 1993.
[13] Jalkanen A., Mattila U., Logistic regression models for wind and
snow damage in northern Finland based on the National Forest
Inventory data, For. Ecol. Manage. 135 (2000) 315–330.
[14] Li C., Apps M.J., Effects of contagious disturbance on forest tem-
poral dynamics, Ecol. Model. 87 (1996) 143–151.
[15] Loehle C., Applying landscape principles to fire hazard reduction,
For. Ecol. Manage. 198 (2004) 261–267.
[16] Lohmander P., Helles F., Windthrow probability as a function of
stand characteristics and shelter, Scan. J. For. Res. 2 (1987) 227–238.
[17] McCarthy M.A., Gill A.M., Bradstock R.A., Theoretical fire inter-
val distributions, Int. J. Wildl. Fire 10 (2001) 73–77.
176 J.R. González et al.
[18] Moritz M.A., Spatiotemporal analysis of controls on shrubland fire
regimes: age dependency and fire hazard, Ecology 84 (2003) 351–
361.
[19] Pollet J., Omi P.N., Effect of thinning and prescribed burning on
crown fire severity in ponderosa pine forests, Int. J. Wildl. Fire 11
(2002) 1–10.
[20] Reed W., Estimating the Historic Probability of Stand-Replace-
ment Fire Using the Age-Class Distribution of Undisturbed Forest,
For. Sci. 40 (1994) 104–119.
[21] Schoenberg F.P., Peng R., Huang Z., Rundel P., Detection of non-
linearities in the dependence of burn area on fuel age and climatic
variables, Int. J. Wildl. Fire 12 (2003) 1–6.
[22] Tábara D., La percepció dels problemes del medi ambient, Beta
Editorial, Barcelona, 1996.
[23] Thompson W.A., Vertinsky I., Schreier H., Blackwell B.A., Using
forest fire hazard modelling in multiple use forest management
planning, For. Ecol. Manage. 134 (2000) 163–176.
[24] Trasobares A., Pukkala T., Miina J., Growth and yield model for
uneven-aged mixtures of Pinus sylvestris L. and Pinus nigra Arn.
in Catalonia, north-east Spain, Ann. For. Sci. 61 (2004) 9–24.
[25] Trasobares A., Pukkala T., Using past growth to improve indivi-
dual-tree diameter growth models for uneven-aged mixtures of
Pinus sylvestris L. and Pinus nigra Arn. in Catalonia, north-east
Spain, Ann. For. Sci. 61 (2004) 409–417.
[26] Trasobares A., Pukkala T. Optimising the management of uneven-
aged Pinus sylvestris L. and Pinus nigra Arn. mixed stands in Cata-
lonia, north-east Spain, Ann. For. Sci. 61 (2004) 747–758.
[27] Tucker C.J., Vanpraet C., Sharman M.J., Vanfnttersum G., Satellite
remote sensing of total herbaceous biomass production in the Sene-
galese Sahel: 1980–1984, Remote Sens Environ. 17 (1985) 233–
249.
[28] Vanclay J.K., Modelling forest growth and yield. Applications to
mixed tropical forests, CAB International, Wallingford, 1994, 312 p.
[29] Van Wagner C.E., Conditions for the start and spread of crown fire,
Can. J. For. Res. 7 (1977) 23–34.
[30] Van Wagner C.E., Development and structure of the Canadian
Forest Fire, Weather Index System, Can. For. Serv., Ottawa, Ont.,
For. Tech. Rep. 35, 1987, 37 p.
[31] Velez. R., Mediterranean forest fires: A regional perspective, Una-
sylva 162 (1990) 10–12.
[32] Velez R., Causes of fires in the Mediterranean Basin, EFI procee-
dings 45 (2002) 35–42.
To access this journal online:
www.edpsciences.org