Báo cáo lâm nghiệp: "Age-related physiological and structural traits of chestnut coppices at the Castelli Romani Park (Italy)" pot
Bạn đang xem bản rút gọn của tài liệu. Xem và tải ngay bản đầy đủ của tài liệu tại đây (739.98 KB, 9 trang )
239
Ann. For. Sci. 63 (2006) 239–247
© INRA, EDP Sciences, 2006
DOI: 10.1051/forest:2006002
Original article
Age-related physiological and structural traits of chestnut coppices
at the Castelli Romani Park (Italy)
Francesca COVONE*, Loretta GRATANI
Dipartimento di Biologia Vegetale, Università degli Studi di Roma “La Sapienza”, piazzale Aldo Moro n° 5, 00185 Roma, Italy
(Received 15 June 2005; accepted 27 October 2005)
Abstract – Coppices of Castanea sativa Miller (1, 5, 7, 10, 12, 17, 23, 26, and 30 years old stands) were investigated. Total basal area (BA)
ranged from 4.9 ± 1.9 m
2
ha
–1
(1 year old stands) to 41.0 ± 2.3 m
2
ha
–1
(30 years old stands), and Leaf Area Index (LAI) from 0.18 ± 0.08 m
2
m
–2
(1 year old stands) to 5.00 ± 0.22 m
2
m
–2
(12 years old stands). Morphological and physiological leaf traits were analysed in 5 (YC) and
23 years old stands (OC) to point out the functional responses to clearing impact. The results pointed out the high productivity of C. sativa in
the Park, due to favourable climatic and soil conditions. Significant differences of morpho-physiological leaf traits between YC and OC stands
were observed during the last period of the vegetative cycle; it could be due to the higher efficiency in resource use of YC leaves than OC.
chestnut coppice / age / LAI / leaf physiology / leaf morphology
Résumé – Effet de l’âge sur la physiologie et la morphologie foliaire des taillis de châtaigner dans le Parc de Castelli Romani (Italie).
Des taillis de Castanea sativa Miller (âgés de 1, 5, 7, 10, 12, 17, 23, 26, et 30 ans) ont été étudiés. La surface totale de base (BA) variait de 4,9 ±
1,9 m
2
ha
–1
(peuplement de 1 an) à 41,0 ± 2,3 m
2
ha
–1
(peuplement de 30 ans), et l’indice de surface foliaire (LAI) de 0,18 ± 0,08 m
2
m
–2
(peuplement de 1 an) à 5,00 ± 0,22 m
2
m
–2
(peuplement de 12 ans). La morphologie et la physiologie de caractéristiques foliaires ont été
examinées dans les peuplements âgés de 5 (YC) et 23 ans (OC), de façon à montrer les réponses fonctionnelles à l’impact de la coupe. Les
résultats montrent une productivité élevée du châtaigner dans le Parc, à la suite de favorables conditions du climat et du sol. Des différences
significatives entre les caractéristiques morpho-physiologiques des feuilles des peuplements YC et OC ont été observées pendant la dernière
période de la saison de végétation ; cela pourrait être dû à la plus grande efficacité d’utilisation des ressources dans les feuilles de YC par rapport
à celles de OC.
taillis de châtaigner / âge / LAI / physiologie foliaire / morphologie foliaire
1. INTRODUCTION
The structure of vegetation, as determined by the spatial
arrangement of its elements, is the integrated result of natural
selection in response to environmental factors and competitive
plant interactions [8, 15, 38, 55]. Knowledge of quantitative
relationships between stand structure and species composition
may contribute to more advanced indirect estimations of stand
carbon balance and plant productivity [29, 53, 65]. Forest man-
agement determines unavoidable changes in forest structure,
interfering with self-regulating processes and productivity, and
having considerable influence on forest stability [32, 54, 61].
Since the primary source of structural and physiological vari-
ability among managed forest stands is determined by differ-
ences in rotation stage (time since harvest) [31], understanding
the functional status of a managed forest requires an accurate
characterization of the different stage of development.
Sweet chestnut (Castanea sativa Miller) stands are distrib-
uted all around the western Mediterranean Basin; they are man-
aged as coppices and they are clear-cutted every 15–25 years,
according to the local productivity [6, 12, 57]. Chestnut is a
moderate heliophile species and, compared to other temperate
species, has rather high photosynthetic rates [11, 16, 44], con-
tributing to its fast growth [12, 13, 40]. New management sys-
tems underline the use of longer rotation period with a moderate
thinning [3, 7, 17], allowing the branch biomass to increase pro-
gressively, and contributing to the improvement of soil fertility,
which has been reduced in the past by short rotation periods [48,
49]. At the present, many chestnut coppices are improperly
managed resulting in a heavy and progressive reduction of their
ecological and economical value [4]. Thus, knowledge of struc-
tural and physiological traits of C. sativa is crucial to select the
best management option for a sustainable development [2].
Although several reports describe the effect of silvicultural
* Corresponding author:
Article published by EDP Sciences and available at or />240 F. Covone, L. Gratani
management on stand structure [3, 17, 19, 62], few papers ana-
lyse structural and physiological trait changes of chestnut cop-
pices during its growth [16].
The main objective of this research was to analyse the func-
tional responses of chestnut coppices of different age to clear-
ing impact. The general approach was: (1) to analyse plant
structural traits and leaf morphological and physiological traits
changes according to age, and (2) to analyse relationships
between structural and physiological traits. Moreover, physi-
cal-chemical soil analysis was conducted. The results obtained
could provide information on the status of this ecosystem,
offering recommendations for the best management options.
2. MATERIALS AND METHODS
2.1. Study area and climate
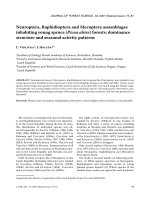
The study was carried out in chestnut stands of different age,
located inside the Castelli Romani Park (Italy, lat from 41° 41’ to 41°
49’ N, long from 12° 38’ to 12° 50’ E) (Fig. 1). Chestnut stands, gen-
erally pure, spread from 300 m (basins of Nemi and Albano lakes) to
956 m (Monte delle Faete and Monte Cavo) a.s.l. in the considered
area.
The soils were andisols, originated from incoherent, easily weath-
erable rocks (pyroclastites, volcanic ash); they had a very thick blackish
A horizon, soft and porous, high in organic matter, with a considerable
water retention capacity, directly overlying the strongly weathered
parent material (AC profiles); available soil nutrient content was high,
the base saturation was over 50% and homogeneity between stands
fairly good [27].
Climatic data were provided by the Velletri Meteorological Sta-
tion. Total annual rainfall was of 970 mm, most of it (67%) distributed
during autumn–winter. The mean minimum air temperature of the
coldest month (January) was 3.9 °C, the mean maximum air temper-
ature of the hottest month (August) was 28.8 °C and the mean annual
temperature was 15.6 °C (Tab. I) (mean of the years 2000–2004).
2.2. Measured stand structural traits
Plant structure measurements were carried out during the period
February 2003–June 2004 in even-aged monospecific chestnut (Cas-
tanea sativa Miller) coppice stands of different age (1, 5, 7, 10, 12,
17, 23, 26, and 30 years old). These stands were subjected to the same
management regime. The length of time rotation ranged around 18–
24 years, even though coppices aged 30 being quite frequent. During
the clear-cut, some trees (standards) were spared to provide seeds for
natural regeneration and these were clear-cut every two rotation periods.
Sample areas, 400 m
2
each, were established for each stand age
(20 per stand age), according to Aber [1], Gratani and Crescente [23],
and Newbould [41]. Measurements included stool density (STOd,
Figure 1. Location of the study area.
Table I. Monthly and annual mean maximum air temperature
(T
max
), monthly and annual mean minimum air temperatures (T
min
),
monthly and annual mean air temperature (T
m
) and total monthly
and annual rainfall (R) for the period 2000–2004 (Meteorological
Station of Velletri, lat 41° 41’ N, long 12° 50’ E, Rome).
T
max
T
min
T
m
R
(°C) (°C) (°C) (mm)
Jan 10.3 3.9 7.3 101.1
Feb 11.4 4.8 7.9 69.8
Mar 14.7 7.1 10.6 66.8
Apr 16.7 8.8 12.5 89.9
May 22.7 13.9 18.0 56.5
Jun 27.3 18.0 22.5 31.4
Jul 28.0 19.1 23.5 32.8
Aug 28.8 20.3 24.4 40.2
Sep 23.8 15.6 19.3 81.2
Oct 20.7 13.5 17.5 104.6
Nov 16.6 10.3 14.9 164.7
Dec 11.8 6.3 8.9 130.6
Annual 19.4 11.8 15.6 970
Influence of age on chestnut coppice 241
stool ha
–1
), shoot density (SHOd, ind ha
–1
), standard density (STAd,
ind ha
–1
), stem diameter at breast height (DBH, cm), and the dominant
shoot height of each stool (DH, m) in each stands, according to
Gallardo et al. [17] and Rubio and Escudero [54]. Total basal area (BA,
m
2
ha
–1
) was calculated.
Leaf Area Index (LAI, m
2
m
–2
) was measured in each sample area
(20 measurements per stand age) by the LAI 2000 Plant Canopy Ana-
lyser (LI-COR Inc., USA), according to Brenner et al. [8], Cutini et al.
[14] and Welles and Cohen [66]. Measurements were carried out at
the time of the maximum LAI according to Scurlock et al. [58] and
corresponding to full leaf lamina expansion [21] in the period 1st July–
1st September. In each measurement cycle, the reference measurement
was carried out in large clearings near each sample area. The below-
canopy measurements (8 per sample area) were carried out randomly
according to Li-Cor [36]. The fish-eye lens of the instrument was cov-
ered by a view cap with a 45° opening, in order to be sure that the ref-
erence measurements were not influenced by the trees surrounding the
clearings and by the operator [36]. All measurements were taken at
1 m above ground and under condition of totally diffuse light, with the
sun at or below the horizon to avoid confusing brightly sunlit leaves
for gaps [36]. Furthermore, in order to avoid rapid and transient
changes in sky conditions between reference and below-canopy read-
ings, cloudless or uniformly overcast days were chosen [14].
2.3. Soil analysis
Triplicate soil samples (per sample area) of about 1 kg were col-
lected in coppices of 5 (young coppice, YC) and 23 years old (old coppice,
OC). Soil samples were blended for granulometric analysis, pH, soil
organic matter content (SOM), soil total nitrogen content (N
t
).
All soil samples were collected at least 5 days after the last rainfall
(from 09/07/2004 to 13/07/2004), at –40 cm depth, using a drill. Soil
samples were air dried at room temperature for about 1 month and then
passed through 2 mm sieve [54]; pH in H
2
O was measured with a glass
electrode in a suspension of soil in deionized water; N
t
content (%)
was determined by Kjeldahl method, and SOM content (%) was deter-
mined according to Walkley [64]. Carbon nitrogen ratio (C/N) was cal-
culated.
Soil water content (SWC, %, ratio of water mass per fresh soil
mass) was determined on samples (500 g each) collected in YC and
OC on 13/07/2004, 30/08/2004, and 28/09/2004 (simultaneously at
physiological measurements), oven-dried at 90 °C to a constant mass [25].
2.4. Morphological and anatomical leaf traits
Morphological and anatomical measurements were carried out in
YC and OC, to point out differences between the different ages [16,
35]. Morphological leaf traits were analysed on 50 fully expanded
leaves (5 leaves per 10 selected plants), collected from the external
portion of the crown, in YC and OC coppices, on 13/07/2004 and 25/
10/2004. The selected plants consisted of 20–25 (YC) and 2–4 (OC)
re-sprouted shoots whose size was similar within and between plants.
The following parameters were measured: projected leaf surface
area (excluding petiole) (LSA, cm
2
), obtained by the Image Analysis
System (Delta-T Devices, UK); leaf dry mass (LDM, mg), determined
drying at 80 °C to constant mass.
Leaf mass per unit leaf area (LMA, mg cm
–2
) was calculated by
the ratio of leaf dry mass and one-sided leaf area [50]; specific leaf
area (SLA, cm
2
g
–1
) by the ratio of one-sided leaf area and leaf dry
mass; leaf tissue density (LTD, mg cm
–3
) by the ratio of LMA and total
leaf thickness [67].
Total leaf thickness (LT, µm) was measured from 20 fresh leaf sec-
tions (from both YC and OC) analysed by light microscopy, using an
image analysis system (ARKON, A&P, I).
2.5. Physiological leaf traits
Gas exchange measurements were carried out during the morning
(from 9.00 to 12.00 a.m.) in the following days: 20/06/2004, 13/07/
2004, 30/07/2004, 30/08/2004, 28/09/2004, and 25/10/2004 on cloud-
free days to ensure that maximum daily photosynthetic rates were
reached [51]. 20 mature leaves (4 leaves per 5 selected plants) from
the external portion of two south facing branches of each plant in YC
and OC stands were measured by a ladder, according to Radoglou [47].
Leaves were retained in their natural position during measurements.
Net photosynthetic rate (P
N
, µmol CO
2
m
–2
s
–1
), stomatal diffusive
conductance to water vapour (g
s
, mmol H
2
O m
–2
s
–1
), leaf transpira-
tion rate (E, mmol H
2
O m
–2
s
–1
), and photosynthetic active radiation
(PAR, µmol photon m
–2
s
–1
) were measured by an infrared gas ana-
lyser Ciras-1 open system (PP Systems, Hitchin, UK), equipped with
a 2.5 cm
2
leaf chamber (Ciras-1 Parkinson Leaf Cuvettes, Hitchin,
UK). Instantaneous water use efficiency (WUE, µmol CO
2
mmol
–1
H
2
O) was calculated as the ratio of P
N
and E [68].
Predawn and midday leaf water potential (Ψ
pd
, Ψ
md
, MPa, respec-
tively), and relative water content (RWC
pd
, RWC
md
, %, respectively)
measurements were carried out in the following days: 13/07/2004, 30/
08/2004, and 28/09/2004, in YC and OC stands (10 leaves per each
type) in the same position considered for gas exchange. Ψ was meas-
ured using a portable pressure chamber (SKPM 1400, Skye Instru-
ments, Llandrindod Wells, UK) with a sheet of wet filter paper inside
the chamber to avoid water loss during measurements [37]. RWC was
calculated by 100 × (fresh mass – dry mass) / (water saturated mass –
dry mass) [20]; the sample leaves were enclosed in plastic sheaths
immediately before cutting [63].
Air temperature (Te, °C) was measured by a portable Thermo-
Hygrometer (HD8901, Delta Ohm, I), simultaneously at physiological
measurements.
2.6. Statistics
All statistical tests were performed using a statistical software
package (Statistica, Statsoft Inc., USA). Significant differences
among means of the measured traits were determined by analysis of
variance (ANOVA) and Tukey test for multiple comparisons. Corre-
lation coefficients were calculated to examine relationships among the
measured traits.
3. RESULTS
3.1. Soil analysis
Differences among YC and OC soil physical characteristics
were not significant; on an average the soils of YC and OC were
characterized by a 35.7 ± 12.9% sand, 54.6 ± 9.0% silt, and
9.7 ± 5.8 clay (Tab. II). SOM and N
t
contents were respectively
67.8% and 67.7% significantly (P < 0.05) lower in YC than in
OC.
Significant differences were not observed in soil pH and C/N
ratio between YC and OC stands. On an average pH was 6.2 ±
0.5 and C/N ratio was 10.7 ± 1.3.
3.2. Stand structural traits
Significant differences of structural traits were measured
among the different stand ages (1, 5, 7, 10, 12, 17, 23, 26, and
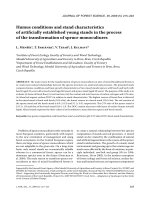
30 years old). STOd ranged from 525 ± 35 stool ha
–1
(30 years)
to 546 ± 35 stool ha
–1
(1 year); differences among stand ages
242 F. Covone, L. Gratani
were not significant (Fig. 2). STAd did not differ significantly
among the considered stand age (67.8 ± 23.6 ind ha
–1
, mean
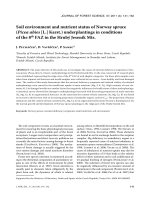
value) (Fig. 2). SHOd was 15825 ± 763 ind ha
–1
in 1 year old
stands (Fig. 3), significantly (P < 0.001) decreasing 50% in
7 years old stands and significantly (P < 0.001) decreased in
the following years, being 7% of the initial value at the end of
the time-rotation (30 years).
Shoot DBH and DH increased linearly with the age (Fig. 3),
being 1.0 ± 0.5 cm and 1.5 ± 0.8 m, respectively, in 1 year old
stands, and 19.6 ± 9.1 cm and 20.5 ± 1.1 m, respectively, in
30 years old stands.
BA was 4.9 ± 1.9 m
2
ha
–1
in 1 year old stands, significantly
(P < 0.001) increasing till 7 years; it did not changed significantly
from 7 to 23 years, and stabilizing close to 40 m
2
ha
–1
in the
oldest stands (26 and 30 years) (Fig. 3).
LAI values significantly varied among the considered cop-
pices (Fig. 3): it was the lowest (0.18 ± 0.08 m
2
m
–2
) in 1 year
old stands, reaching the highest value (5.00 ± 0.22 m
2
m
–2
) in
12 years old stands and decreasing in 23 years old stands
(3.60 ± 0.27 m
2
m
–2
).
The dependence of LAI upon the analysed structural traits
was tested by regressing these variables; there were significant
(P < 0.001) correlations among the considered traits, and the
best fit was a polynomial correlation (Tab. III).
3.3. Morphological and anatomical leaf traits
The considered leaf traits didn’t vary significantly among
YC and OC (Fig. 4) in July. On an average C. sativa had 605 ±
152 mg LDM, 83.3 ± 15.4 cm
2
LSA, 169.4 ± 18.2 µm LT, 7.2 ±
1.0 mg cm
–2
LMA, 426.3 ± 35.6 mg cm
–3
LTD, and 141.5 ±
22.9 cm
2
g
–1
SLA.
Tab le II. Soil physical and chemical characteristics in young cop-
pice (YC) and old coppice (OC).
YC OC
Sand (%) 35.4 ± 14.8
a
36.0 ± 12.9
a
Clay (%) 10.0 ± 7.1
a
9.4 ± 5.3
a
Silt (%) 54.6 ± 9.7
a
54.7 ± 9.7
a
pH 6.3 ± 0.7
a
6.1 ± 0.3
a
SOM (%) 3.0 ± 0.9
a
9.3 ± 4.0
b
N
t
(%) 0.15 ± 0.05
a
0.45 ± 0.16
b
C/N 10.3 ± 0.9
a
11.1 ± 1.7
a
SWC 20.3 ± 3.1
a
20.9 ± 2.5
a
SOM = soil organic matter content; N
t
= soil total nitrogen content; C/N
= carbon nitrogen ratio; SWC = soil water content (means among the
days 13/07/2004, 30/08/2004, and 28/09/2004). Means with the same
letter, between YC and OC, are not significantly different (ANOVA, P <
0.05). Standard deviation is shown.
Figure 2. Trend of stool density (STOd) and standard density (STAd),
in a chronosequence of chestnut coppice. Standard deviation is shown.
Each point is the mean of 20 sample plots.
Table III. Summary of significant (P < 0.001) correlations between
LAI and the considered plant traits (N = 180).
y–x Relationship r
LAI – DBH y = –0.0345x
2
+ 0.8225x + 0.1582 0.88
LAI – BA y = –0.0053x
2
+ 0.352x – 1.4109 0.94
LAI – SHOd y = –5E-08x
2
+ 0.0007x + 3.0413 0.93
LAI – DH y = –0.0287x
2
+ 0.8104x – 0.9419 0.93
LAI = Leaf Area Index; DBH = stem diameter at breast height; BA =
total basal area; SHOd = shoot density; DH = the dominant shoot height
of each stool; r = correlation coefficient.
Figure 3. Trend of shoot density (SHOd), stem diameter at breast hei-
ght (DBH), the dominant shoot height of each stool (DH), total basal
area (BA) and Leaf Area Index (LAI) in a chronosequence of chestnut
coppice. Standard deviation is shown. Each point is the mean of
20 sample plots.
Influence of age on chestnut coppice 243
The considered leaf traits showed significant (P < 0.001) dif-
ferences at the end of October: YC had 37%, 24%, 45% and
15% higher LDM, LT, LMA, and LTD, respectively, than OC
and 30% lower SLA.
3.4. Physiological traits
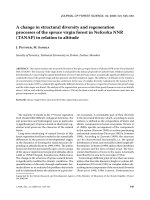
Figure 5 shows that P
N
had two peaks during the study
period, the first in the middle of July (20.8 °C mean air tem-
perature) and the second in September (19.5 °C mean air tem-
perature) in both YC and OC. P
N
did not differ significantly
between YC and OC (18.2 ± 2.5 and 15.8 ± 1.0 µmol m
–2
s
–1
,
respectively) in July but it was significantly (P < 0.01) higher
in YC (19.9 ± 2.6 µmol m
–2
s
–1
) than in OC (14.5 ± 2.3 µmol
m
–2
s
–1
) in September.
Low P
N
rates were monitored in YC at the end of July (14.6 ±
2.2 µmol m
–2
s
–1
) and in OC in August (10.7 ± 1.0 µmol m
–2
s
–1
); the lowest values were monitored at the end of October
in both YC and OC (on an average 6.1 ± 1.6 µmol m
–2
s
–1
).
Stomatal diffusive conductance to water vapour (g
s
) had the
same P
N
trend, showing two peaks (Fig. 5), the first in the mid-
dle of July (575 ± 103 and 554 ± 132 mmol m
–2
s
–1
, in YC and
OC, difference not significant) and the second in September
(471 ± 67 and 293 ± 65 mmol m
–2
s
–1
in YC and OC, values
significantly different). g
s
decreased 65% and 34% (respect the
maximum value) in OC and YC, respectively, in August.
The highest E values (4.04 ± 0.81 and 4.19 ± 0.35 mmol m
–2
s
–1
in YC and OC, respectively) were monitored at the end of
July when air temperature was 24.1 °C (difference between
ages not significant) (Fig. 5).
WUE reached the highest values in the middle of July (6.6 ±
1.3 and 6.8 ± 0.7 µmol mmol
–1
in YC and OC, respectively)
and in September (7.2 ± 1.2 and 6.2 ± 1.0 µmol mmol
–1
in YC
and OC, respectively) (Fig. 5); a reduction (50% respect to the
maximum) was observed at the end of July in YC and OC. Dif-
ferences between YC and OC stands were not significant.
Figure 4. Morpho-anatomical leaf traits of C. sativa in young coppice
(YC) and old coppice (OC) on 13/07/2004 and 25/10/2004. LDM =
leaf dry mass; LSA = projected leaf surface area; LT = total leaf thic-
kness; LMA = leaf mass per unit leaf area; LTD = leaf tissue density;
SLA = specific leaf area. Each point is the mean of 50 leaves for mor-
phological leaf traits and of 20 leaves for anatomical leaf traits. Means
significantly different are marked with *** (P < 0.001); n.s. not signi-
ficant. Standard deviation is shown.
Figure 5. Daily rainfall (R), trend of net photosynthetic rate (P
N
), sto-
matal diffusive conductance to water vapour (g
s
), transpiration rate
(E), instantaneous water use efficiency (WUE) of C. sativa in young
coppice (YC) and old coppice (OC) from the middle of June 2004 to
the end of October 2004. Te = air temperature. Standard deviation is
shown. Each point is the mean of 20 leaves.
244 F. Covone, L. Gratani
Figure 6 shows that the highest Ψ
pd
values were monitored
in YC and OC stands, at the middle of July (on an average
–0.50 ± 0.08 MPa, difference between YC and OC was not sig-
nificant); in the same period SWC was on an average 22.5%
(in YC and OC).
Ψ
pd
and Ψ
md
showed a higher decrease in OC (110 and 79%,
Ψ
pd
and Ψ
md
, respectively) than in YC (29% and 17%, Ψ
pd
and
Ψ
md
, respectively) in August (10.6 mm from 15/07/2004 to 30/
08/2004 of total rainfall); in the same period SWC significantly
(P < 0.01) decreased 28%.
Ψ
pd
recovered 96 and 81% in YC and OC, respectively, and
Ψ
md
23 and 75% in YC and OC, respectively, in September; in
the same period SWC was on an average 23.1% (in YC and
OC).
The highest RWC values (> 90%) were monitored in July
in both YC and OC (Fig. 6) (differences between YC and OC
were not significant) and RWC
md
was 2% lower than RWC
pd
(mean value between YC and OC).
A higher RWC decrease was observed in OC (5% and 29%,
RWC
pd
and RWC
md
,
respectively) than in YC (2% and 5%,
RWC
pd
and RWC
md
, respectively) in August. At the end of
September RWC
pd
recovered 83 and 88% in YC and OC,
respectively; there were not significantly differences between
YC and OC in both RWC
pd
and RWC
md
.
4. DISCUSSION
The analysed coppices were characterized by low STOd (on
an average 536 ± 7 stool ha
–1
), typical of chestnut coppices
derived from the conversion of fruit chestnut, according to
Bernetti [5]. The not significant differences in the number of
stools and standards per hectare (which were a non-time
dependent forestry parameter), between the analysed stands of
different age, reinforced our certainty about the homogeneity
of the management in the study area.
The high number of shoots developed after the clear-cut
from each stool (on an average 30 ± 11 shoots per stool) caused
a high SHOd in 1 year old coppices. SHOd decreased in the fol-
lowing years owing to the natural mortality of shoots. The high-
est values of BA in the oldest coppices were due to high values
of DBH (on an average 18.5 ± 1.6 cm), in accordance with the
results of Cutini [12].
The high LAI values in 5 years old coppices (20 times higher
than in 1 year old coppices) showed the rapid recovery of a
closed canopy. The capacity to rebuild the canopy reduced the
persistence of other problems associated to this perturbation,
mainly leaching.
The correlation analysis (Tab. III) underlined the depend-
ence of LAI on the considered structural traits of the stands. In
particular the correlations pointed out the increase of LAI with
the increase of DBH, BA, SHOd and DH, until a maximum
value falling in turn in the range 10–17 years. The highest value
(5.00 ± 0.22 m
2
m
–2
) was measured in 12 years old stands.
When DBH, BA, DH increased over 11.9 cm, 33.6 m
2
ha
–1
,
14.1 m, respectively, and SHOd decreased over 7000 ind ha
–1
(in the oldest stands), LAI decreased up to 3.45 ± 0.18 m
2
m
–2
.
The tendency of the oldest coppices to have a canopy cover
lower than younger coppices one could be mainly ascribed to
natural evolution of stand structure. It beyond the juvenile
phase showed discontinuity and gaps, according to the results
of Cutini [13]; this is owed to the low SHOd of the stands (on
an average 1350 ± 205 ind ha
–1
) which caused a low leaf area
density. LAI measured in the coppices of different age were in
accordance with the results of Gallardo et al. [17], Leonardi
et al. [34] and Scurlock et al. [58].
LAI between 10 and 17 years, corresponding to the highest
values, might be considered a good estimator of the maximum
biomass accumulation [54]. LAI was the most important factor
influencing C assimilation and water loss in plant communities
[21, 28, 39, 60] and it might provide an indicator of potential
productivity in response to changing factor [23, 25, 26, 42].
The analysis of the physiological traits trend underlined the
importance of these traits as indicator of the resources availa-
bility [24, 59]. The optimal P
N
values (17.1 ± 2.4 µmol m
–2
s
–1
)
corresponding to favourable air temperature (in the range
19–20 °C) for this species were in agreement with those meas-
ured by Deweirdt and Carlier [16] and Pontailler et al. [44], and
they were higher than those monitored by Gomes-Laranjo et al.
[18] and Proietti et al. [46]. The high P
N
rates could be primarily
attributed to the favourable climatic conditions and soil phys-
ical-chemical characteristics: the water content and SOM never
limitant, and the sand-silty and acid soil favour chestnut growth
in the Park, according to the results of Bernetti [5], Leonardi
et al. [34] and Rubio and Escudero [54]. The higher SOM and
Figure 6. Water potential at predawn (Ψ
pd
) and at midday (Ψ
md
), rela-
tive water content at predawn (RWC
pd
) and at midday (RWC
md
) of
C. sativa in young coppice (YC) and old coppice (OC) on 13/07/2004,
30/08/2004 and 28/09/2004. Each point is the mean of 10 leaves.
Means significantly different are marked with *(P < 0.05), **(P <
0.01) and ***(P < 0.001); n.s. not significant. Standard deviation is
shown. Values of soil water content in YC (SWC
YC
) and OC
(SWC
OC
) are shown.
Influence of age on chestnut coppice 245
N
t
contents in OC than in YC was due to the higher amount of
soil litter falling in OC over the years (data not shown), even
if the C/N ratio value close to 11 in both YC and OC pointed
out the good state of mineralization and humification processes
in both stands.
Moreover, some results underlined significant differences
between YC and OC stands, mainly detectable during the last
period of the vegetative cycle. P
N
and g
s
were on an average
respectively 32% and 50% lower in OC than YC stands in the
period from August to October, owed to the highest g
s
decrease
(65%) in OC stands, which caused the highest P
N
decrease
(32%).
The relatively high P
N
in YC was maintained even at low
Ψ, which showed a reduction at the end of August higher in OC
than in YC. RWC paralleled Ψ variability, dropping to 67% at
midday in OC, significantly lower than in YC, even if g
s
was
95% higher in YC than in OC. These results suggested that in
YC C. sativa could partly recover from water loss, maintaining
a more favourable ratio between water loss and uptake, result-
ing in a higher RWC value and higher P
N
rates. Moreover it
could also be due to a benefit from the existing root system of
this plant species, carbohydrate reserves of the stool and the
invigorating effects of decapitation which could cause an ini-
tially fast growing of the coppice sprouts, according to the
results of Kauppi and Kiviniitty [30] and Rinne et al. [52].
These considerations could also explain the high number of
shoots growing from each chestnut stool after the clear-cut and
the extremely rapid recovery of a closed canopy.
The not complete recovery of Ψ in September and the lower
P
N
values measured in October (2004) were due to the onset
of leaf senescence, according to the results of Gratani and Foti
[21] and Salleo et al. [56]; the lower P
N
and Ψ values in OC
than in YC might indicate an earlier senescence in OC, which would
lead to a worse resource use capacity of C. sativa in older cop-
pices, in accordance with the results of Deweirdt and Carlier [16].
The study of variations of leaf morphology in response to
stand age and in two different periods of the vegetative cycle
reflected the trend of physiological traits. The results were
indicative of chestnut adaptability to environmental constraints
and of its functional ecology according to Gratani and Bombelli
[22], Gratani and Varone [24], and Ponton et al. [45]. In July
there were not significant differences between YC and OC;
nevertheless YC leaves collected in October showed a higher
LDM, LT, LMA and LTD than in July (2004), improving resist-
ance during the hottest months [10, 22, 24]. The lower LDM,
LT, LMA, and LTD in OC than in YC confirmed the early onset
of senescence, according to the results of Buchanan et al. [9],
Gratani and Varone [24], and Ogaya and Peñuelas [43]. The
values of LT and LMA were in accordance with those reported
by Lauteri et al. [33] and Proietti et al. [46] for C. sativa.
In conclusion the higher values of P
N
rates measured in both
YC and OC in July than those reported in literature and the opti-
mal Ψ values pointed out the high productivity of C. sativa in
the Castelli Romani Park, due to the favourable climatic and
soil conditions for the species. Although the intensive exploi-
tation of this area, the analysed coppice showed the great capac-
ity to react rapidly and to quickly re-build a homogenous
canopy cover. Moreover our results clearly showed the better
resource use capacity of C. sativa in YC and the higher LAI in
YC (4.14 ± 0.45 m
2
m
–2
) than OC (3.60 ± 0.27 m
2
m
–2
): YC
seems to be more productive than OC. Such results are due to
neither a different SWC between the two stands nor a different
WUE of C. sativa; a more stressful condition of C. sativa in OC
could cause an earlier senescence and so lower Pn rates and Ψ
values.
REFERENCES
[1] Aber J.D., A method for estimated foliage-height profiles in broad-
leaved forests, J. Ecol. 67 (1979) 35–40.
[2] Amorini E., Analysis of different silvicultural systems in chestnut
coppices. Criteria to define a sustainable management, in: Romane
F. (Ed.), Second Annual Report of the Cast/Environment Project,
C.E.F.E./CNRS, Montpellier, 1996, pp. 71–75.
[3] Amorini E., Bruschini S., Manetti M.C., Alternative silvicultural
systems in chestnut (Castanea sativa Mill.) coppice: effects of sil-
vicultural practices on stand structure and tree growth, Ecol. Medi-
terr. 26 (2000) 155–162.
[4] Amorini E., Chatziphilippidis G., Ciancio O., Di Castri F., Giudici
F., Leonardi S., Manetti MC., Nocentini S., Pividori M., Rapp M.,
Romane F., Sevrin E., Zingg A., Sustainability of chestnut forest
ecosystems: Is it possible? Ecol. Mediterr. 26 (2000) 3–14.
[5] Bernetti G., Selvicoltura speciale, UTET, Torino, 1995.
[6] Berrocal M., Gallardo J.F., Cardeñoso J.M., El Castaño, Mundi-
Prensa, Madrid, 1998.
[7] Bourgoise C., Améliorer les taillis de châtaignier, Forêt Entreprise
44 (1987) 8–15.
[8] Brenner A.J., Cueto Romero M., García Haro J., Gilabert M.A.,
Incoll L.D., Martínez Fernández J., Porter E., Pugnaire F.I., Younis
M.T., A comparison of direct and indirect methods for measuring
leaf and surface area of individual bushes, Plant Cell Environ. 18
(1995) 1332–1340.
[9] Buchanan B.B., Gruissem W., Jones R.L., Biochemistry and Mole-
cular Biology of Plants, American Society of Plant Physiologists,
Rockville, MD, 2000.
[10] Castro-Díez P., Villar-Salvador P., Pérez-Rontomé C., Maestro-
Martínez M., Montserrat-Martí G., Leaf morphology, leaf chemical
composition and stem xylem characteristics in two Pistacia (Ana-
cardiaceae) species along a climatic gradient, Flora 193 (1998)
195–202.
[11] Ceulemans R., Saugier B., Photosynthesis, in: Raghavendra A.S.
(Ed.), Physiology of Trees, John Wiley and Sons, New York, 1991,
pp. 21–50.
[12] Cutini A., Biomass, litterfall and productivity in chestnut coppices
of various age at Monte Amiata (Central Italy), Ecol. Mediterr. 26
(2000) 33–41.
[13] Cutini A., New management options in chestnut coppices: an eva-
luation on ecological bases, For. Ecol. Manage. 141 (2001) 165–
174.
[14] Cutini A., Matteucci G., Scarascia Mugnozza G., Estimation of leaf
area index with the Li-Cor LAI 2000 in deciduous forests, For.
Ecol. Manage. 105 (1998) 55–65.
[15] Degen T., Devillez F., Jacquemart A.L., Gaps promote plant diver-
sity in beech forests (Luzulo-Fagetum), North Vosges, France,
Ann. For. Sci. 62 (2005) 429–440.
[16] Deweirdt C., Carlier C., Photosynthèse des feuilles de châtaigniers
(Castanea sativa Mill.) mesurée in situ dans des taillis par incorpo-
ration de
14
CO
2
, Acta Oecol. 9 (1988) 145–160.
[17] Gallardo J.F., Rico M., González M.I., Some ecological aspects of
a chestnut coppice located at the Sierra de Gata mountains (Western
Spain) and its relationship with a sustainable management, Ecol.
Mediterr. 26 (2000) 53–69.
246 F. Covone, L. Gratani
[18] Gomes-Laranjo J., Araújo-Alves J., Ferreira-Cardoso J., Pimentel-
Pereira M., Abreu C.G., Torres-Pereira J., Effect of Chestnut ink
disease on photosynthetic performance, J. Phytopathol. 152 (2004)
138–144.
[19] Gondard H., Romane F., Grandjanny M., Li J., Aronson J., Plant
species diversity changes in abandoned chestnut (Castanea sativa)
groves in southern France, Biodivers. Conserv. 10 (2001) 189– 207.
[20] Grammatikopoulos G., Mechanism for drought tolerance in two
Mediterranean seasonal dimorphic shrubs, Aust. J. Plant Physiol.
26 (1999) 587–593.
[21] Gratani L., Foti I., Estimating forest structure and shade tolerance
of the species in a mixed deciduous broad-leaved forest in Abruzzo,
Italy, Ann. Bot. Fenn. 35 (1998) 75–83.
[22] Gratani L., Bombelli A., Leaf anatomy, inclination, and gas
exchange relationships in evergreen sclerophyllous and drought
semideciduous shrub species, Photosynthetica 37 (1999) 573–585.
[23] Gratani L., Crescente M.F., Map-makings of plant biomass and leaf
area index for management of protected areas, Aliso 19 (2000) 1–11.
[24] Gratani L., Varone L., Leaf key traits of Erica arborea L., Erica
multiflora L. and Rosmarinus officinalis L. co-occurring in the
Mediterranean “maquis”, Flora 199 (2004) 58–69.
[25] Gratani L., Rossi A., Crescente M.F., Frattaroli A.R., Ecologia dei
pascoli di Campo Imperatore (Gran Sasso d’Italia) e carta della bio-
massa vegetale, Braun-Blanquetia, 16 (1999) 227–247.
[26] Gratani L., Bombelli A., Crescente M.F., Leaf area index (LAI)
map of a protected area within the caldera of Vico Lake (Italy),
Plant Biosyst. 137 (2003) 141–148.
[27] Guarrera P.M., Boschi e cespuglieti dei Colli Albani (o “Castelli
Romani”), in: Ambienti di particolare interesse naturalistico del
Lazio. Censimento del patrimonio vegetale del Lazio: quaderno n. 2,
Regione Lazio Assessorato alla Cultura, Dipartimento Biologia
Vegetale Università “La Sapienza”, Roma, Roma, Tipar, 1996,
pp. 241–246.
[28] Hoff C., Rambal S., An examination of the interaction between cli-
mate, soil and leaf area index in a Quercus ilex ecosystem, Ann.
For. Sci. 60 (2003) 153–161.
[29] Ishii H.T., Tanabe S., Hiura T., Exploring the relationships among
canopy structure, stand productivity, and biodiversity of temperate
forest ecosystems, For. Sci. 50 (2004) 342–355.
[30] Kauppi A., Kiviniitty M., Leaf morphology and photosynthetic rate
in birch seedlings and stump sprouts, Can. J. For. Res. 20 (1990)
952–960.
[31] Kowalski A.S., Loustau D., Berbigier P., Manca G., Tedeschi V.,
Borghetti M., Valentini R., Kolari P., Berninger F., Rannik Ü., Hari
P., Rayment M., Mencuccini M., Moncrieff J., Grace J., Paired
comparisons of carbon exchange between undisturbed and regene-
rating stands in four managed forests in Europe, Global Change
Biol. 10 (2004) 1–17.
[32] Larsen J.B., Ecological stability of forest and sustainable silvicul-
ture, For. Ecol. Manage. 73 (1995) 85–96.
[33] Lauteri M., Scartazza A., Guido M.C., Brugnoli E., Genetic varia-
tion in photosynthetic capacity, carbon isotope discrimination and
mesophyll conductance in provenances of Castanea sativa adapted
to different environments, Funct. Ecol. 11 (1997) 675–683.
[34] Leonardi S., Rapp M., Failla M., Guarnaccia D., Biomasse, produc-
tivité et transferts de matière organique dans une séquence altitudi-
nale de peuplements de Castanea sativa Mill de l’Etna, Ann. For.
Sci. 53 (1996) 1031–1048.
[35] Leonardi S., Santa Regina I., Rapp M., Gallego H.A., Rico M., Bio-
mass, litterfall and nutrient content in Castanea sativa coppice
stands of southern Europe, Ann. For. Sci. 53 (1996) 1071–1081.
[36] Li-Cor, LAI-2000 Plant Canopy Analyzer Operating Manual, Lin-
coln, NE, USA, 1991.
[37] Lo Gullo M.A., Salleo S., Different strategies of drought resistance
in three mediterranean sclerophyllous trees growing in the same
environmental conditions, New Phytol. 108 (1988) 267–276.
[38] Lyon J., Gross N.M., Patterns of plant diversity and plant–environ-
mental relationships across three riparian corridors, For. Ecol.
Manage. 204 (2005) 267–278.
[39] Morales D., Jiménez M.S., González-Rodriguez A.M., Cermák J.,
Laurel forests in Tenerife, Canary Islands: I. The site, stand struc-
ture and stand leaf area distribution, Trees 11 (1996) 34–40.
[40] Mousseau M., Effects of elevated CO
2
on growth, photosynthesis
and respiration of sweet chestnut (Castanea sativa Mill.), Vegetatio
104/105 (1993) 413–419.
[41] Newbould P.J., Methods for estimating the primary production of
forest, Blackwell Scientific Publications, Oxford, Edinburgh, 1967.
[42] Ni J., Zhang X., Scurlock J.M.O., Synthesis and analysis of bio-
mass and net primary productivity in Chinese forests, Ann. For. Sci.
58 (2001) 351–384.
[43] Ogaya R., Peñuelas J., Comparative seasonal gas exchange and
chlorophyll fluorescence of two dominant woody species in a Holm
Oak forest, Flora 198 (2003) 132–141.
[44] Pontailler J.Y., Leroux M., Saugier B., Évolution d’un taillis de
châtaigniers après coupe : photosynthèse et croissance des rejets,
Acta Oecol. 5 (1984) 89–99.
[45] Ponton S., Dupouey J.L., Dreyer E., Leaf morphology as species
indicator in seedlings of Quercus robur L. and Q. petraea (Matt.)
Liebl.: modulation by irradiance and growth flush, Ann. For. Sci.
61 (2004) 73–80.
[46] Proietti P., Palliotti A., Famiani F., Antognozzi E., Ferranti.,
Andreutti R., Frenguelli G., Influence of leaf position, fruit and
light availability on photosynthesis of two chestnut genotypes, Sci.
Hortic. 85 (2000) 63–73.
[47] Radoglou K., Environmental control of CO
2
assimilation rates and
stomatal conductance in five oak species growing under field con-
ditions in Greece, Ann. For. Sci. 53 (1996) 269–278.
[48] Ranger J., Nys C., Biomass and nutrient content of extensively and
intensively managed coppice stands, Forestry 69 (1996) 83–102.
[49] Ranger J., Félix C., Bouchon J., Nys C., Ravart M., Dynamique
d’incorporation du carbone et des éléments nutritifs dans un taillis
simple de châtaignier (Castanea sativa Milller.), Ann. For. Sci. 47
(1990) 413–433.
[50] Reich P.B., Walters M.B., Ellsworth D.S., Leaf life-span in relation
to leaf, plant, and stand characteristics among diverse ecosystems,
Ecol. Monogr. 62 (1992) 365–392.
[51] Reich P.B., Kloeppel B.D., Ellsworth D.S., Walters M.B., Different
photosynthesis-nitrogen relations in deciduous hardwood and ever-
green coniferous tree species, Oecologia 104 (1995) 24–30.
[52] Rinne P., Saarelainen A., Junttila O., Growth cessation and bud
dormancy in relation to ABA level in seedlings and coppice shoots
of Betula pubescens as affected by a short photoperiod, water stress
and chilling, Physiol. Plant. 90 (1994) 451–458.
[53] Romane F., Introduction and objectives, in: Romane F. (Ed.), Sus-
tainability of Mediterranean ecosystems. Case study of the chestnut
forest, European Commission, Brussels, Ecosystem research report
19, 1995, pp. 1–5.
[54] Rubio A., Escudero A., Clear-cut effects on chestnut forest soils
under stressful conditions: lengthening of time-rotation, For. Ecol.
Manage. 183 (2003) 195–204.
[55] Sala A., Sabaté S., García C., Tenhunen J.D., Canopy structure
within a Quercus ilex forested watershed: variations due to loca-
tion, phenological development, and water availability, Trees 8
(1994) 254–261.
[56] Salleo S., Nardini A., Lo Gullo M.A., Ghirardelli L.A., Changes in
stem and leaf hydraulics preceding leaf shedding in Castanea
sativa L., Biol. Plant. 45 (2002) 227–234.
Influence of age on chestnut coppice 247
[57] Santa Regina I., Organic matter distribution and nutrient fluxes
within a sweet chestnut (Castanea sativa Mill.) stand of the Sierra
de Gata, Spain, Ann. For. Sci. 57 (2000) 691–700.
[58] Scurlock J.M.O., Asner G.P., Gower S.T., Worldwide historical
estimates of leaf area index, 1932–2000, ORNL Technical Memo-
randum ORNL/TM-2001/268, Oak Ridge National Laboratory,
Oak Ridge, TE, 2001.
[59] Sellin A., Kupper P., Within-crown variation in leaf conductance of
Norway spruce: effects of irradiance, vapour pressure deficit, leaf
water status and plant hydraulic constraints, Ann. For. Sci. 61
(2004) 419–429.
[60] Specht R.L., Specht A., Canopy structure in Eucalyptus-dominated
communities in Australia along climatic gradients, Acta Oecol. 10
(1989) 191–213.
[61] Swanson F.J., Franklin J.F., New forestry principles from ecosys-
tem analysis of Pacific Northwest forest, Ecol. Appl. 2 (1992) 262–
274.
[62] Tindall J.R., Gerrath J.A., Melzer M., McKendry K., Husband
B.C., Boland G.J., Ecological status of American chestnut (Casta-
nea dentata) in its native range in Canada, Can. J. For. Res. 34
(2004) 2554–2563.
[63] Turner N.C., Technique and experimental approaches for measure-
ments of plant water status, Plant Sci. 58 (1981) 339–366.
[64] Walkley A., A critical examination of a rapid method of determi-
ning organic carbon in soil-effect of variations in digestion condi-
tions and of inorganic constituents, Soil Sci. 63 (1946) 251–263.
[65] Waring R.H., Estimating forest growth and efficiency in relation to
canopy leaf area, Adv. Ecol. Res. 13 (1983) 327–354.
[66] Welles J.M., Cohen S., Canopy structure measurement by gap frac-
tion analysis using commercial instrumentation, J. Exp. Bot. 47
(1996) 1335–1342.
[67] Wright I.J., Westoby M., Leaves at low versus high rainfall: coor-
dination of structure, lifespan and physiology, New Phytol. 155
(2002) 403–416.
[68] Wuenscher J.E., Kozlowski T.T., Relationship of gas-exchange
resistance to tree-seedling ecology, Ecology 52 (1971) 1016–1023.
To access this journal online:
www.edpsciences.org