Báo cáo lâm nghiệp: " Comparison of the hygroscopic behaviour of 205-year-old and recently cut juvenile wood from Pinus sylvestris L." pps
Bạn đang xem bản rút gọn của tài liệu. Xem và tải ngay bản đầy đủ của tài liệu tại đây (1.05 MB, 9 trang )
309
Ann. For. Sci. 63 (2006) 309– 317
© INRA, EDP Sciences, 2006
DOI: 10.1051/forest:2006010
Original article
Comparison of the hygroscopic behaviour of 205-year-old and recently
cut juvenile wood from Pinus sylvestris L.
Luis GARCÍA ESTEBAN
a
*, Francisco GARCÍA FERNÁNDEZ
b
, Antonio GUINDEO CASASÚS
a
,
Paloma DE PALACIOS DE PALACIOS
a
, Joseph GRIL
c
a
Universidad Politécnica de Madrid, Departamento de Ingeniería Forestal, Escuela Técnica Superior de Ingenieros de Montes,
Cátedra de Tecnología de la Madera, Ciudad Universitaria s/n, 28040 Madrid, Spain
b
Asociación de Investigación Técnica de las Industrias de la Madera y el Corcho, Flora 3 - 2º, 28013 Madrid, Spain
c
Laboratoire de Mécanique et Génie Civil, Université Montpellier 2, France
(Received 4 April 2005; accepted 27 September 2005)
Abstract – The hygroscopic response of the juvenile wood of Pinus sylvestris L. from recently cut trees from the Valsaín Forest in Segovia,
Spain (new wood) was compared to that of the juvenile wood of the same species used in roof rafters installed at the end of the eighteenth
century (old wood), which came from the same forest. The 35 ºC isotherms were plotted using the saturated salts method, and the mathematical
fit used was the GAB model. The infrared spectrums and the X-ray diffractograms were used in order to study the possible chemical variations
and crystallinity indices of the cell wall. The adsorption-desorption loop of the old wood is above the loop of the new wood, although the
hysteresis coefficient is higher in the old wood. The peaks corresponding to the -OH groups are similar, although the degree of crystallinity is
significantly lower in the old wood. While cellulose crystallinity differs between the old and new wood, and has a major influence on wood
hygroscopicity, other modifications in the amorphous components of the cell wall may have contributed to the changes in hygroscopicity
between the old and new wood.
hygroscopicity / sorption isotherm / juvenile wood / Fourier transform infrared spectroscopy (FTIR) / X-ray diffraction (XRD)
Résumé – Comparaison du comportement hygroscopique d’un bois juvénile de Pinus sylvestris L. âgé de 205 ans avec celui d’un bois
juvénile récemment coupé. La réponse hygroscopique du bois juvénile de Pinus sylvestris L. provenant d’arbres récemment coupés de la forêt
de Valsaín en Segovia, Espagne (bois récent) a été comparée à celle de bois juvénile de la même espèce utilisé comme bois de charpente à la
fin du
XIII
e
siècle (vieux bois), originaire de la même forêt. Les isothermes de sorption à 35 ºC ont été obtenus par la méthode des sels saturés,
et l’ajustement mathématique utilisé était le modèle GAB. La spectrographie infrarouge et la diffractométrie par rayons X- ont été utilisées pour
étudier d’éventuelles différences de composition chimique et d’indices de cristallinité de la paroi cellulaire. La boucle d’adsorption-désorption
du vieux bois est au-dessus de celle du bois récent, tandis que le coefficient d’hystérésis est plus élevé dans le vieux bois. Les pics correspondant
aux groupes -OH sont similaires, bien que le degré de cristallinité soit significativement plus bas dans le vieux bois. Bien que ces différences
de cristallinité puissent expliquer pour une bonne part le contraste hygroscopique entre bois vieux et actuel, des modifications au niveau des
composés amorphes de la paroi peuvent également être invoquées.
hygroscopicité / isotherme de sorption / bois juvénile / spectroscopie infrarouge par transformée de Fourier / diffraction par rayons X
1. INTRODUCTION
Wood is a hygroscopic material because of the presence of
-OH groups in the hydrophilic polymers of the cell wall, cel-
luloses and hemicelluloses, which are capable of fixing water
molecules by means of hydrogen bonds. However, not all the
-OH groups can be reached by the water vapour molecules,
because the cellulose molecules form crystalline regions where
the -OH groups of the adjacent molecules are in a parallel arran-
gement [33]. As a result of this process, wood varies its mois-
ture content in relation to the temperature and the relative
humidity of the surrounding air. Plotting the adsorption and
desorption isotherms of wood at given temperatures provides
information about its hygroscopic behaviour, enabling compa-
risons to be made between wood of different species and within
the same species. Wood hygroscopicity can be modified by
physical or chemical means, or by biological degradation. It is
reduced by exposure to high temperatures [20], due to a
decrease in the hemicellulose content [10]. From the chemical
point of view, acylation is a generic process which includes
acetylated, butyrylated and hexanoylated wood. All of these
chemical processes cause a decrease of the hydroxyl groups in
* Corresponding author:
Article published by EDP Sciences and available at or />310 L. García Esteban et al.
the wood, resulting in lower wood hygroscopicity [7, 35].
Finally, the hygroscopic behaviour of wood degraded by fun-
gus depends on the fraction of wood eliminated: if it is hemi-
cellulose, for example, the hygroscopicity decreases, as this is
the most hygroscopic component [18]. However, wood also
modifies its hygroscopic behaviour naturally with the passage
of time, due to the reorientation of the molecules that are likely
to participate in the sorption process [31]. This affirmation is
related to the degree of crystallinity, as the ability of wood to
take up water by sorption decreases as the degree of crystalli-
nity of the material increases [24]. Some studies have been done
on the degree of crystallinity and its possible implications in
the hygroscopic response [29, 37].
Very few studies have been done on the hygroscopicity of
old wood, although from the point of view of reusing materials,
such studies are of great importance given that hygroscopicity
is an important property which has a direct effect on the dimen-
sional stability of wood. The aim of this study was to compare
the hygroscopicity of 205-year-old wood of Pinus sylvestris L.
with recently cut wood of the same species, both from the same
forest, by plotting their 35 ºC isotherms, analysing the crystal-
linity index of the cellulose and using Fourier transform infra-
red spectroscopy (FTIR).
2. MATERIALS AND METHODS
The samples of old wood were obtained from the renovation work
carried out on the Casa del Gobernador (Governor’s House) in Aran-
juez, Madrid, Spain. The original house was the work of the architect
Juan de Villanueva, and dates from the end of the eighteenth century.
The samples were taken from the principal roof rafters, which had been
taken down at the end of 2000 and held in a storehouse in Madrid.
The old wood used for this study was protected from sunlight at
all times, both during its use in the building and subsequent storage.
The average annual atmospheric climatic conditions were 14.4 ºC and
59% relative humidity while the wood formed part of the building, and
15.1 ºC and 56% relative humidity during storage in Madrid. The mix-
ture of straw and mud between the planking and the tiling meant that
the rafters did not reach high temperatures and therefore thermal deg-
radation of the wood was avoided. Brown-rot fungi observed at both
ends of two of the rafters was removed. Special care was taken not to
use old wood with traces of fungi for determining the EMC in order
to avoid modifications in the hemicellulose content.
According to the architectural project information, the wood used
for the construction of the Casa del Gobernador was Valsaín pine
(Pinus sylvestris L.). This was verified by means of appropriate micro-
scopic identification.
Slices were obtained from each rafter, and from these a radial slice
was obtained using a radial saw, from which the final test pieces were
obtained using a slicer. A check was made to ascertain whether the
pieces studied were from mature or juvenile wood, as the hygroscopic
response of the two types of wood is significantly different [3, 5, 14].
The method developed by Macaya [22] for Pinus sylvestris L. was
used, which relates the juvenile-mature cambial age to the number of
rays/mm
2
. It was determined that all the pieces were of juvenile wood.
.
The application of this model determined that the age of the pieces
of old wood was from 25 to 30 years. Other studies on the same wood
presume it to be mature at this age [25]. However, as the cambial age
is quite variable between trees of the same forest and between different
regions of provenance, particularly in conifers, the old wood samples
were considered to be of juvenile wood in accordance with the specific
preliminary study on the forest from which they came, in terms of the
number of rays and the length of the tracheids, which enabled it to be
established that up to ring 40, with a 5% confidence level, the juvenile-
mature cambial age did not occur [22].
The new wood was obtained from six trees felled during scheduled
cutting of Pinus sylvestris L. in the Valsaín Forest in Segovia, Spain,
located in region of origin 10, Sierra de Guadarrama [6]. The first or
basal log was selected from each of the six trees and the central radial
board was cut out of each log in a sawmill. The wood was immediately
air-dried to a moisture content of 35% and then cut with a radial saw
to obtain test samples between rings 25 and 30. The old and new wood
test samples for sorption tests were 15 mm long (L), 10 mm wide (R)
and 1 mm thick (T). In both cases there were fifteen test samples for
each moisture equilibrium point, divided into three flasks holding five
samples each.
The COST Action E8 saturated salts method was used to plot the
35 ºC adsorption-desorption curves. The thermostatic baths were verified
by using microcrystalline cellulose in accordance with the Community
Bureau of Reference protocol, Certified Reference Materials CRM
302 “Water content of microcrystalline cellulose (MCC) in equilib-
rium with the atmosphere above specified aqueous saturated SALT
solutions at 25 ºC”. After the humidity content of each of the salts was
obtained, the values were compared with the certified value of the
Community Bureau of Reference, CRM 302. According to the COST
Action E8 protocol and the Community Bureau of Reference, the
equipment is regarded as suitable if Value
certified
– uncertainty
CRM302
≤ Value
obtained
≤ Value
certified
+ uncertainty
CRM302
[9, 16].
Nine equilibrium points per isotherm were obtained, corresponding to
the nine salts shown in Table I. For the plotting of the desorption
isotherm of the old wood, the first step consisted of placing the test
samples in water for three days in order to saturate them. When this
was achieved, the test samples were removed to eliminate excess water
and placed in the sample flask of each salt, where they remained until
equilibrium was reached in all the salts; that is, when the results of two
consecutive weighings taken twenty four hours apart showed a
difference of no more than 0.1%. This process took up to 2 months,
after which the test samples were weighed in order to obtain the wet
weight and then placed in a desiccator with phosphorous pentoxide in
order to attain the anhydrous state and calculate the equilibrium mois-
ture contents (EMC) by means of the following equation:
P
w
: wet weight;
P
0
: anhydrous weight.
In the case of the new wood, the test samples were placed directly
in the sample holders, still with the moisture contents above the fibre
saturation point, after which the same procedure was followed as for
the old wood. Once the desorption process had finished, all the sample
pieces were dried in phosphorous pentoxide for 40 days until anhy-
drous weight was reached, after which the adsorption isotherms were
plotted following the same criteria as for desorption. This process took
up to 30 days.
The Guggenheim, Anderson and Boer-Dent (GAB) model was
used to plot the isotherms. This model is particularly appropriate for
obtaining a good fit in studies which include high relative humidities
of over 90%, in which adsorption through capillarity and the multi-
layer effect play a relevant role [38]. The fit for GAB model corre-
sponds to the equation:
where,
X: equilibrium moisture content;
ray density 59.541 0.96900 · age
4636.8
1 88.476·age–
––=
EMC%
P
w
P
0
–
P
0
·100=
XX
m
·
C · K · a
w
1 K · a
w
–()1 K · a
w
– C · K · a
w
+()
=
Hygroscopic behaviour of old and new wood 311
X
m
: moisture content corresponding to complete monolayer cov-
erage of all available sorption sites;
C: constant;
K: Guggenheim constant;
a
w
: RH, relative humidity or water activity on a scale of zero to one.
The fit, both in desorption and adsorption, was regarded as valid
if the regression coefficient R was greater than 0.990 and the RMS was
less than 4% [2, 12, 38]. A hysteresis coefficient was used for com-
paring the isotherms of the old and the recently cut wood, as the values
of this coefficient make it possible to know how much more stable the
wood is in relation to the changes of relative humidity which cause
the wood to change from a state of adsorption to desorption and vice
versa:
c
H
: hysteresis coefficient;
EMC
a
: equilibrium moisture content in adsorption;
EMC
d
: equilibrium moisture content in desorption.
All the glass material required was produced using the models spec-
ified in the European Community document for obtaining the sorption
curves of cellulose [16]. The thermostatic baths used were of the Grant
brand, model Y38, with a 38-L capacity, forced circulation, a range
of 20–99 ºC and a precision of 0.1 ºC. The scales used for the weigh-
ings were of the Sartorius brand, model Handy H110, with a range of
0–100 g and a precision of 0.0001 g. The oven used to reach the anhy-
drous weight was of the Heraeus brand, model VT6025, with a range
of 0–200 ºC and a precision of 0.1 ºC.
FTIR was used as a qualitative tool for identifying functional
groups because of its high specificity in terms of assigning absorption
bands [28]. Any chemical change that may have introduced new
bonds, such as carbonyl or carboxyl bonds in the case of an acylation,
would be shown in the spectrum by the corresponding absorption
band. The qualitative analysis was done from the identification of the
functional groups by comparing them with tabulated data (Tab. III).
FTIR is particularly useful for detecting the -OH groups, which are
responsible for wood hygroscopicity. There are even a number of stud-
ies distinguishing free-OH groups from those involved in inter-molec-
ular and intra-molecular bonds [23]. For the infrared analysis a sample
of each of the woods used in the plotting of the sorption curves was
prepared, as well as a control sample of pure cellulose. Sawdust was
obtained from each of the pieces of wood for this purpose, and the saw-
dust and the cellulose were dried in an oven at 103 ± 2 ºC for 24 h.
The reason for using totally anhydrous samples is to remove all the
-OH groups belonging to water molecules. The samples were cooled
in a desiccator with silicagel at room temperature. Thirty milligrams
was taken from each one and mixed with potassium bromide, and all
the material became finely separated dust. This was compressed into
a disc in a vacuum press for 5 min. A Perkin-Elmer 1605 FTIR spec-
trophotometer with a resolution of 4 cm
–1
was used.
In order to analyse the possible changes in the crystalline fraction
of the cellulose, X-ray diffraction was used (XRD Technique) as estab-
lished by Hermans and Weidinger [15]. By using the diffractograms
the crystallinity index CrI% was calculated [24, 39] as well as the
length of the crystallite, L
hkl
[11]:
CrI%: crystallinity index;
I
002
: maximum intensity;
I
AM
: lowest diffraction intensity at 2θ = 22º.
K: correction factor, K = [0.9];
λ: emitting wavelength. 8 = 1.54056A;
d(2ϑ): full width at half maximum (in radians) (FWHM).
The samples were obtained between rings 25 and 30, as the degree
of cellulose crystallinity does not remain constant throughout the tree
but rather increases from the pith to the bark, although from ring 15
it does remain practically constant [39]. The equipment used consisted
of a Philips X’Pert diffractometer, whose measuring conditions are
45 Kv tension, 40 mA intensity and 1800 w power. The samples were
measured from 2θ = 5º to 2θ = 90º, with step size ∆θ = 0.04º and a
time interval of 1 s on continuous mode. The total time for each dif-
fractogram was 35 min. One degree slits were used in primary and sec-
ondary optics and a receiving slit of 0.15 mm.
ANOVA tests were conducted in cases where the normality and
homocedasticity hypotheses were met and the Kruskal-Wallis test was
used for cases in which either of the two hypotheses was not met. The
statistical calculations were done using the MATLAB V.6.5 Release
13 programme for a 95% significance level.
3. RESULTS
The thermostatic baths were shown to be in compliance with
the Bureau of Reference Materials CRM 302 requirements.
Table I shows the equilibrium moisture contents and the hys-
teresis coefficients for old wood and new wood.
Table I. Equilibrium humidity contents and hysteresis coefficients (C
H
) for 35 ºC isotherms.
Salt a
w
Old wood New wood
EMC
d
(%) EMC
a
(%) C
H
EMC
d
(%) EMC
a
(%) C
H
LiCl 0.1117 2.44 2.44 1.00 1.62 1.40 0.86
CH
3
COOK 0.2137 4.48 3.64 0.81 3.59 2.92 0.81
MgCl
2
0.3200 6.14 4.97 0.81 4.10 3.27 0.80
K
2
CO
3
0.4255 6.96 6.07 0.87 5.38 4.34 0.81
Mg(NO
3
)
2
0.4972 8.58 7.21 0.84 6.09 4.90 0.80
SrCl
2
0.6608 11.58 9.87 0.85 8.21 6.55 0.80
NaCl 0.7511 13.15 11.56 0.88 9.96 7.99 0.80
KCl 0.8295 15.68 13.77 0.88 11.60 9.62 0.82
BaCl
2
0.8940 18.73 16.43 0.88 14.96 13.06 0.87
c
H
EMC
a
EMC
d
=
CrI % 100 ·
I
002
I
AM
–
I
002
=
L
hkl
K · λ
d 2θ() · θcos
=
312 L. García Esteban et al.
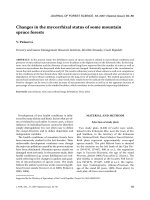
The four isotherms show appropriate fits for a type II (C > 2)
curve [21, 34]. They also have regression coefficients higher
than 0.990, and the RMS is lower than 4% (Fig. 1).
Table II shows the points after which multilayer sorption
begins to prevail. These points were obtained by using the mini-
mum of the derivative of equilibrium moisture content in rela-
tion to the relative humidity [1]. In the old wood the monolayer
saturation moisture content in desorption X
m
, meaning the
maximum amount of water taken up by the sample via mono-
layer sorption, is 6.4%. Furthermore, the point of inflexion of
the isotherm corresponds to a moisture content of 5.7% and
occurs at 31.6% relative humidity. These findings indicate that
from 31.6% to 100% relative humidity the water taken up by
the sample via monolayer sorption is minimal, at only 0.7% of
the total. In the case of the new wood, an X
m
of 4.9% and an
inflexion point of 4.1% occurring at 31.4% relative humidity
were obtained. From 31.4% the water taken up via monolayer
sorption was 0.8%. If the desorption results of both isotherms
are compared, it can be seen that there is a notable difference
in the monolayer saturation moisture content, which is higher
in the old wood (by 1.5%), although the relative humidity per-
centage at which multilayer sorption begins to prevail over
monolayer sorption is practically the same in both cases (31.6
and 31.4%, respectively).
Table II. Thirty-five degree Celsius isotherm values. RMS: Root Medium Square.
Isotherm
Old wood New wood
X
m
KCX
m
KC
Desorption
6.415 ± 0.191 0.7744 ± 0.223 6.308 ± 0.0473 4.941 ± 0.298 0.7619 ± 0.366 5.53 ± 0.0925
Correlation coefficient RMS (%) Correlation coefficient RMS (%)
0.9901 1.125 0.9968 1.803
RH (%) EMC
d
(%) RH (%) EMC
d
(%)
31.6 5.70 31.4 4.12
Adsorption
5.023 ± 0.104 0.8047 ± 0.1507 7.78 ± 0.0246 3.544 ± 0.297 0.8113 ± 0.491 6.727 ± 0.0916
Correlation coefficient RMS (%) Correlation coefficient RMS (%)
0.9969 0.420 0.9962 1.491
RH (%) EMC
a
(%) RH (%) EMC
a
(%)
31.0 4.82 30.4 3.23
Figure 1. Sorption isotherms at 35 ºC.
Hygroscopic behaviour of old and new wood 313
In the case of old wood in adsorption, the monolayer satu-
ration moisture content is X
m
= 5.0% and the point of inflexion
of the sorption curve of the isotherm corresponds to a moisture
content of 4.8% and occurs at 31% relative humidity. From
31% the water taken up via monolayer sorption is only 0.2%.
For new wood in adsorption, the monolayer saturation moisture
content is X
m
= 3.5% and the point of inflexion of the sorption
curve of the isotherm corresponds to a moisture content of 3.2%
and occurs at 30.4% relative humidity. From 30.4% the water
taken up via monolayer sorption is only 0.3%.
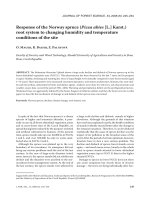
Regardless of the age of the wood, the point of inflexion in
desorption or adsorption – after which the prevalence of mul-
tilayer sorption over monolayer sorption occurs – remains
practically constant (Fig. 2). In both groups of isotherms, after
the point at which multilayer sorption begins to prevail over
monolayer sorption the water taken up via monolayer sorption
in the wood is less in the old wood than in the new wood, by
around 0.1%, in both desorption and adsorption.
On applying the mean test at the significance level of 0.95,
the hysteresis coefficient EMC
a
/EMC
d
of the old wood is
higher than that of the new wood. If they are compared point
by point, all the coefficients show values which agree with this
affirmation. Despite the fact that at point 11.17% of the LiCl
salt the old wood has a higher hysteresis coefficient than in the
new wood (1.00 as opposed to 0.86), it was considered that this
point should be removed as there was a possibility that entropy
peaks may have an influence at low humidities [41]. Kadita
et al. [17] speculated that these peaks were due to the fact that
the hydroxyl groups in the amorphous region form bonds in the
wood when the wood is oven-dried. They consider that when
a small number of water molecules are adsorbed in these places,
the molecule chains regroup in a different manner. Without
considering the point corresponding to LiCl, the mean of the
hysteresis coefficient is 0.85 in old wood and 0.81 in new wood.
This means that a decrease in the free energy within the hyste-
resis cycle has occurred [32] and therefore the old wood is more
hygroscopically stable than the new wood.
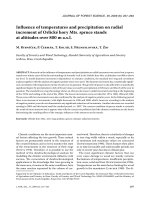
In relation to the use of FTIR, the cellulose spectrum was
examined first (Fig. 3) and it was shown that the cellulose is
material with a clear peak of the -OH groups (3 342 cm
–1
). This
peak is associated with the water linked by hydrogen bonds to
the -OH groups of the cellulose and hemicellulose and does not
appear at all in the spectrums of the pure water [28]. Another
clear peak in the cellulose is that of the carbon-hydrogen links, at
2 899 cm
–1
, and the deformation peak of this link at 1 431 cm
–1
.
No other peaks typical of wood appear, such as C = O or C-O
bonds, or the peak characteristic of lignin at 1 510 cm
–1
[4].
From the results shown in Table III, no chemical change can
be noted between the spectrums of the old or new wood, which
could have a significant influence on the hygroscopicity of the
wood. The appearance of carbonyl and carboxyl peaks does not
seem to be the result of a change in the wood over time, as these
peaks appear in both the old and the new wood. Rather, their
origin is due to the numerous bonds of this type which appear
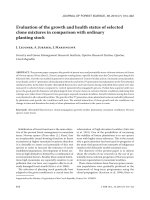
in the lignin molecule. Slight variations can be seen in the car-
bonyl peak, but it is quite a confused zone with two very close
peaks where one may hide the other (Fig. 4). Acylations that
would have caused a very characteristic peak at 1 740 cm
–1
were not detected [4, 7, 8].
The chemical changes that the wood may have undergone
and which may have resulted in a variation of the sorption pro-
perties should act on the hydroxyl groups, replacing them with
other groups or giving rise to bonds between them.
Figure 2. Derivatives of the wood sorption curves at 35 ºC.
314 L. García Esteban et al.
In relation to the use of X-ray diffraction (XRD Technique),
it can be seen that the crystallinity index of the old wood is lower
than in the new wood by around 4% (Tab. IV). This was con-
sidered a substantial difference, as Mihranyan et al. [24] deter-
mined that variations in the crystallinity indices in pure
cellulose from 81 to 93% for low relative humidities (11%)
modify the EMC by around 1%, while for 75% relative humi-
dities they modify the EMC by 2%.
As the water sorption capacity decreases with the increase
in the degree of crystallinity of the material, this means that the
old wood must show higher equilibrium moisture contents [24,
40]. The mean length of the cellulose crystal in the old wood
is less than in the new wood, which means that the degree of
crystallinity of the new wood is greater than in the old wood.
The application of a mean test confirms that the data obtained
is significantly different, with a probability of 95%. It can the-
refore be stated that the old wood presents a higher equilibrium
moisture content than the new wood because it has a crystalli-
nity index lower than the new wood.
The use of high temperatures causes changes in the wood
hygroscopicity which cause physical and chemical changes in
Figure 3. FTIR spectrum of cellulose.
Table III. Main functional groups present in wood and its absorption band. Barker and Owen [4]; Michell and Higgins [23]. Chang and Chang
[7]. Functional groups of old wood and new wood.
Functional group Wavenumber (cm
–1
)
Old wood New wood
σσ
Hydroxyl (–OH) 3400–3500 3382.4 2.9 3360.3 2.0
C-H bond 2890–2930 2912.0 12.8 2912.4 18.2
Carbonyl (C = O)
1
1730–1750 1720.0 17.4 1708.2 22.0
Lignin
2
1510 1511.0 0.2 1509.7 0.6
Deformation strains CH
3
, CH
2
3
1370 1372.5 0.3 1372.8 1.1
Carboxyl (C–O) 1200 1269.7 0.6 1269.7 1.2
Ester linkages 1030–1170 1099.7 8.3 1117.2 37.9
1
Vibration of the acetyl and carboxyl groups of the “xylan” ring.
2
Vibrations of the benzene ring in the lignin.
3
Deformation in both the cellulose and the hemicellulose.
x x
Table IV. Crystallite length L
hkl
and crystallinity indices CrI%.
L
hkl
CrI%
ss
New wood 246.61 3.15 92.89 6.94
Old wood 225.83 2.71 88.77 4.49
x x
Hygroscopic behaviour of old and new wood 315
the wood that are different from natural ageing. In fact, the
reduction of hygroscopicity in wood subjected to a high tem-
perature cannot be explained by recrystallisation of the cellu-
lose, but fundamentally by chemical changes in the amorphous
substances [26]. Therefore, the changes that wood undergoes
through natural ageing are not necessarily similar to ageing
through artificial processes [13]. Although cellulose is the
determining component of the cell wall for water sorption [19],
other variations in the amorphous components of the wood
(hemicelluloses and lignin) and volatile components may have
contributed both to the lower crystallisation coefficient of the
old wood and to an increase in its hygroscopicity. In terms of
the volatile components such as polyphenols, a high concen-
tration of these contributes to low wood hygroscopicity [36],
while the influence of the alcohol-benzene extractives has an
uncertain influence on the hygroscopicity [40]. Perhaps a natu-
ral depolymerisation of the hemicelluloses, similar to that pro-
duced by high temperatures [27], and the appearance of new
regions of accessible OH groups similar to those produced arti-
ficially by chemical reaction with organosilicon compounds
[30] contribute to the increase in the hygroscopicity of the old
wood after centuries of natural ageing.
In relation to the crystallinity index, one factor that directly
contributes to the decrease it undergoes is the increase of lignin.
Figure 4. (a) FTIR spectrum of new wood, (b) FTIR spectrum of old wood.
(a)
(b)
316 L. García Esteban et al.
Passialis [29] showed that in wood submerged for thousands
of years the lignin content increases up to 3.6 times in compa-
rison with new wood. Although the wood in the present study
was not submerged, natural ageing may have caused changes
in the chemical composition by decreasing the fraction of car-
bohydrate composites in favour of the lignin content. Future
studies with samples whose ageing process is known will ena-
ble these theories to be confirmed.
4. CONCLUSIONS
The old wood presents higher equilibrium moisture content
than the new wood, both in adsorption and desorption.
The old wood presents higher hysteresis coefficients than the
new wood. This means that a decrease in the free energy within
the hysteresis cycle has occurred, and therefore the old wood
is more hygroscopically stable than the new wood.
Regardless of the age of the wood, the point of inflexion in
desorption or adsorption, after which multilayer sorption pre-
vails over monolayer sorption, remains practically constant, at
30–32% relative humidity.
The total amount of water taken up by monolayer sorption
in the old wood is greater than in the new wood, although from
the point at which multilayer sorption prevails over monolayer
sorption (30–32% RH) less water is taken up via monolayer
sorption in the old wood than in the new wood: around 0.1%
in both desorption and adsorption.
The old wood and the new wood present similar infrared
spectrums, and the hygroscopic differences of the two types of
wood cannot be attributed to a chemical change in the cell wall.
The passage of time causes a decrease in the cellulose crys-
tallinity index in the wood, which means that the proportion of
amorphous zones increases.
Acknowledgments: We are grateful to the two anonymous reviewers
whose suggestions helped to improve this article. We are also grateful
to Paz Arraiza, from the Cátedra de Operaciones Básicas y Análisis
Instrumental of the Escuela Técnica Superior de Ingenieros de Montes
of the Universidad Politécnica de Madrid for her assistance in obtain-
ing the infrared spectrums of the samples, and to Doctor María Pedrero
and Doctor Julián Velázquez from the Facultad de Ciencias Químicas
of the Universidad Complutense de Madrid, for their help in the anal-
ysis of the samples using XRD Technique.
REFERENCES
[1] Avramidis S., The Basis of Sorption. International Conference of
COST Action E8, Mechanical Performance of Wood and Wood
Products, Copenhagen, Denmark, June 16–17, 1997.
[2] Bacour P., Daudin J.D., Development of a new method for fast
measurement of water sorption isotherms in the high humidity
range. Validation on gelatine gel, J. Food Eng. 44 (2000) 97–107.
[3] Bao F.C., Jiang Z.H., Jiang H.M., Lu X.X., Luo X.Q., Zhang S.Y.,
Differences in wood properties between juvenile wood and mature
wood in 10 species grown in China, Wood Sci. Technol. 35 (2001)
363–375.
[4] Barker B., Owen N.L., Identifying softwoods and hardwoods by
infrared spectroscopy, J. Chem. Educ. 76 (1999) 1706–1709.
[5] Bhat K.M., Priya P.B., Rugmini P., Characterisation of juvenile
wood in teak, Wood Sci. Technol. 34 (2001) 517–532.
[6] Catalán G., Las regiones de procedencia de Pinus sylvestris L. y
Pinus nigra Arn. subsp. salzmannii (Dunal) Franco en España,
INIA e ICONA, España, 1991.
[7] Chang H.T., Chang S.T., Moisture excluding efficiency and dimen-
sional stability of wood improved by acylation, Bioresource Tech-
nol. 85 (2002) 201–204.
[8] Chauhan S.S., Aggarwal P., Karmarkar A., Pandley K.K., Moisture
adsorption behaviour of esterified rubber wood (Hevea brasilien-
sis), Holz Roh Werkst. 59 (2001) 250–253.
[9] Community Bureau of Reference-CBR, Certified Reference Mate-
rial, Certificate of Measurement CRM 302, Water content of micro-
crystalline cellulose (MCC) in equilibrium with the atmosphere
above specified aqueous saturated SALT solutions at 25 ºC, 1989.
[10] Edvardsen K., Sandland K.M., Increasing drying temperature, its
influence on the dimensional stability of wood, Holz Roh Werkst.
57 (1999) 207–209.
[11] Elesini U.S., Cuden A.P., Richards A.F., Study of Green Cotton
Fibres, Acta Chim. Slov. 49 (2002) 815–833.
[12] García Esteban L., Guindeo A., Palacios P., García Fernández F.,
Saturated salt method determination of hysteresis of Pinus sylves-
tris L. wood for 35 ºC isotherms, Mater. Constr. 54 (2004) 51–64.
[13] García Esteban L., Gril J., Palacios P., Guindeo A., Reduction of
wood hygroscopicity and associated dimensional response by
repeated humidity cycles, Ann. For. Sci. 62 (2005) 275–284.
[14] Heliñska-Raczkowska L., Fabisiak E., Radial variation of ear-
lywood vessel lumen diameter as an indicator of the juvenile
growth period in ash (Fraxinus excelsior L.), Holz Roh Werkst. 57
(1999) 283–286.
[15] Hermans P.H., Weidinger A., Quantitative X-ray investigations on
the crystallinity of cellulose fibers, J. Appl. Physics 19 (1948) 491–
506. (In: Anderson S., Serimaa R., Paakkari T., Sarampää P., Peso-
nen E., Crystallinity of wood and the size of cellulose crystallites in
Norway spruce (Picea abies), J. Wood Sci. 49 (2003) 531–537).
[16] Jowitt R., Wagstaffe P.J., The certification of the water content of
microcrystaline cellulose (MCC) at 10 water activities, CRM 302,
Commission of the European Communities, Community Bureau of
Reference, EUR 12429, 1989.
[17] Kadita S., Yamada T., Suzuki M., Studies on rheological properties
of wood. I. Effect of moisture content on the dynamic Young’s
modulus of wood, Mokuzai Gakkaishi. 7 (1961) 29–33.
[18] Khali D.P., Rawat S.P.S., Clustering of water molecules during
adsorption of water in brown rot decayed and undecayed wood
blocks of Pinus sylvestris, Holz Roh Werkst. 58 (2000) 340–341.
[19] Kolin B., Janezic T.S., The effect of temperature, density and che-
mical composition upon the limit of hygroscopicity of wood, Holz-
forschung 50 (1996) 263–268.
[20] Kolin B., Danon G., Influence of temperature upon some physical
and chemical properties of wood, Drev. Vysk. 43(3-4) (1998) 21–27.
[21] Labuza T.P., Moisture sorption: practical aspects of isotherm
measurement and use, Amer. Assoc. Cereal Chemists, St. Paul,
1984.
[22] Macaya D., Diferenciación anatómica de la madera de Pinus sylves-
tris L. y de Pinus nigra Arnold subsp. salzmannii (Dunal) Franco
en poblaciones sorianas, Proyecto Fin de Carrera, E.T.S.I. Montes,
Universidad Politécnica de Madrid, 2002.
Hygroscopic behaviour of old and new wood 317
[23] Michell A.J., Higgins H.G., Infrared Spectroscopy in Forest Pro-
ducts Research, CSIRO Forestry and Forest Products, Melbourne,
Australia, 2002.
[24] Mihranyan A., Piñas Llagostera A., Karmhag R., Stromme M., Ek
R., Moisture sorption by cellulose powders of varying crystallinity,
Int. J. Pharm. 269 (2004) 433–442.
[25] Mutz R., Guilley E., Sauter U.H., Nepveu G., Modelling juvenile-
mature wood transition in Scots pine (Pinus sylvestris L.) using
nonlinear mixed-effects models, Ann. For. Sci. 61 (2004) 831–841.
[26] Obataya E., Tanaka F., Norimoto M., Tomita B., Hygroscopicity of
heat-treated wood: I. Effects of after-treatments on the hygroscopi-
city of heat-treated wood, Mokuzai Gakkaishi 46 (2000) 77–87.
[27] Obataya E., Higashihara T., Tomita B., Hygroscopicity of heat-
treated wood: III. Effects of steaming on the hygroscopicity of
wood, Mokuzai Gakkaishi. 48 (2002) 348–355.
[28] Olsson A.M., Salmen L., The association of water to cellulose and
hemicellulose in paper examined by FTIR spectroscopy, Carbohyd.
Res. 339 (2004) 813–818.
[29] Passialis C., Physico-chemical characteristics of waterlogged
archaeological wood, Holzforschung 51 (1997) 111–113.
[30] Sèbe G., De Jéso B., The dimensional stabilisation of maritime pine
sapwood (Pinus pinaster) by chemical reaction with organosilicon
compounds, Holzforschung 54 (2000) 474–480.
[31] Sernek M., Comparative Analysis of Inactivated Wood Surfaces,
Dissertation submitted to the Faculty of the Virginia Polytechnic
Institute and State University for the degree of Doctor of Philoso-
phy in Wood Science and Forest Products, Virginia, 2002.
[32] Siau J.F., Wood: Influence of moisture on physical properties,
Department of Wood Science and Forest Products, Virginia Poly-
technic Institute and State University, 1995.
[33] Simpson W., Sorption theories applied to wood, Wood Fiber Sci.
12 (1980) 183–195.
[34] Singh P.C., Singh R.K., Application of GAB model for water sorp-
tion isotherms of food products, J. Food Process. Pres. 20 (1996)
203–220.
[35] Vaca-García C., Borredón M.E., Solvent-free fatty acylation of cel-
lulose and lignocellulosic wastes: Part 2. Reactions with fatty acid,
Bioresource Technol. 70 (1999) 135–142.
[36] Venalainen M., Harju AM., Saranpää P., Kainulainen P., Tiitta M.,
Velling P., The concentration of phenolics in brown-rot decay
resistant and susceptible Scots pine heartwood, Wood Sci. Technol.
38 (2004) 109–118.
[37] Viel S., Capitani D., Proietti N., Ziarelli F., Segre A.L., NMR spec-
troscopy applied to the Cultural Heritage: a preliminary study on
ancient wood characterisation, Appl. Phys A Mater. 79 (2004)
357–361.
[38] Violaz P.E., Rovedo C.O., Equilibrium sorption isotherms and ther-
modynamic properties of starch and gluten, J. Food Eng. 40 (1999)
287–292.
[39] Wang S.Y., Chio C.M., The wood properties of Japanese cedar ori-
ginated by seed and vegetative reproduction in Taiwan IV. The
variation of the degree of crystallinity of cellulose, Mokuzai Gak-
kaishi. 36 (1990) 909–916.
[40] Wang S.Y., Chio C.M., Equilibrium moisture contents of six wood
species and their influences, Mokuzai Gakkaishi. 39 (1993) 126–
137.
[41] Yasuda R., Minato K., Norimoto M., Moisture adsorption thermo-
dynamics of chemically modified wood, Holzforschung 49 (1995)
548–554.
To access this journal online:
www.edpsciences.org