Báo cáo lâm nghiệp: " On the niche breadth of Fagus sylvatica: soil nutrient status in 50 Central European beech stands on a broad range of bedrock types" potx
Bạn đang xem bản rút gọn của tài liệu. Xem và tải ngay bản đầy đủ của tài liệu tại đây (883.87 KB, 14 trang )
Ann. For. Sci. 63 (2006) 355–368 355
c
INRA, EDP Sciences, 2006
DOI: 10.1051/forest:2006016
Original article
On the niche breadth of Fagus sylvatica: soil nutrient status in 50
Central European beech stands on a broad range of bedrock types
Christoph L
*
,InaC.M
, Dietrich H
Plant Ecology, Albrecht-von-Haller-Institute of Plant Sciences, University of Göttingen, Untere Karspüle 2, 370737 Göttingen, Germany
(Received 1 June 2005; accepted 4 January 2006)
Abstract – The soil nutrient status of 50 Central European stands of Fagus sylvatica on 13 acidic to basic bedrock types was investigated with the aim
(i) to define the extremes of important soil chemical and nutrient status parameters tolerated by beech forests, (ii) to investigate the dependency of these
parameters on bedrock type and soil acidity, and (iii) to analyse the importance of the organic layer for the nutrient status of beech forests. Based on the
parameters exchangeable cation pool (Ca + Mg + K
ex
), N/P ratio of the organic layer and C/N ratio of the mineral soil, three nutrient supply classes
were identified: (1) limestone and claystone soils (C/N 15–18 mol mol
−1
,N/P 20–26 mol mol
−1
,(Ca+ Mg + K)
ex
5–38 mol m
−2
per 10 cm soil),
(2) silicate-rich sandstone, tertiary sand, loamy loess and moraine soils (C/N 20–26 mol mol
−1
,N/P 24–45 mol mol
−1
,(Ca+ Mg + K)
ex
2–3 mol m
−2
10 cm
−1
), and (3) soils derived from silicate-poor sandy deposits (C/N 28–34 mol mol
−1
,N/P 47–59 mol mol
−1
,(Ca+ Mg + K)
ex
1–3 mol m
−2
10 cm
−1
).
Soil chemical extremes tolerated by beech were 3–99% base saturation, 3.2–7.3 of pH (H
2
O), and minima of resin-exchangeable P of 11 mol m
−2
,and
of (Ca + Mg + K)
ex
of 0.4 mol m
−2
in the topsoil (0–10 cm). A highly variable amount of exchangeable Al in the mineral soil was identified as the
key factor controlling the accumulation of C in the organic layer (OL, OF, OH). Increasing organic layer N/P ratios (19 to 59 mol mol
−1
) from basic to
acidic soils point at a growing importance of P limitation over N limitation with increasing acidity in beech forest soils.
base saturation / C/Nratio/ exchangeable cations / N/Pratio
Résumé – Sur la niche écologique du hêtre Fagus sylvatica : statut nutritif des sols de 50 peuplements de hêtre d’Europe centrale. Le statut
nutritif des sols de 50 peuplements de Hêtre (Fagus sylvatica) croissant sur 13 types de roches mère a été étudié dans le but de (i) définir les conditions
d’alimentation édaphiques extrêmes tolérées par le hêtre, (ii) étudier les relations roche mère-conditions édaphiques, et (iii) analyser l’importance de
couche organique pour le statut nutritif des forêts de hêtre. En se basant sur la réserve de cations échangeables, le rapport N/P de la couche organique
et le rapport C/P du sol minéral, trois classes d’alimentation minérale ont été identifiées : (1) sols calcaire et argileux (C/N 15–18 mol mol
−1
,N/P
20–26 mol mol
−1
,(Ca+ Mg + K)
ex
5–38 mol m
−2
par 10 cm de sol), (2) grès siliceux, sables tertiaires, loess limoneux et sols de moraine (C/N
20–26 mol mol
−1
,N/P 24–45 mol mol
−1
,(Ca+ Mg + K)
ex
2–3 mol m
−2
10 cm
−1
), et (3) sols dérivés de dépôts siliceux pauvres en bases (C/N 28–
34 mol mol
−1
,N/P 47–59 mol mol
−1
,(Ca+ Mg + K)
ex
1–3 mol m
−2
10 cm
−1
). Le hêtre tolère les valeurs chimiques extrêmes suivantes : saturation
en base de 3 à 99 %, pH (H
2
O) de 3.2 à 7.3, valeur minimale de P échangeable de 11 mol m
−2
,etde(Ca+ Mg + K)
ex
de 0.4 mol m
−2
dans l’horizon
supérieur (0–10 cm). La quantité très variable d’Al échangeable dans le sol minéral a été identifiée comme le facteur clé contrôlant l’accumulation de
C dans la couche organique (OL, OF, OH). L’augmentation du rapport N/P des humus des sols basiques aux sols acides indique dans les sols de hêtraie
une limitation croissante par le P par rapport au N lorsque l’acidité augmente.
saturation en base / C/N / cations échangeables / N/P
1. INTRODUCTION
European beech (Fagus sylvatica L.) is exceptional among
temperate tree species in forming mono-specific stands in the
largest part of its distribution range. Prior to man’s alteration
of the forested landscape, this species dominated in an area
far exceeding 300 000 km
2
in Central Europe. Moreover, Fa-
gus sylvatica is remarkably tolerant against a broad range of
hydrological and soil chemical factors including soil mois-
ture, hydrogen and aluminium ion concentrations, and nitro-
gen availability [14, 18]. In fact, vital mono-specific beech
forests are found on highly acidic quartzitic soils and on basic
carbonate-rich soils, and they occur in regions with less than
550 to more than 2000 mm of annual rainfall [26, 35]. Beech
* Corresponding author:
forests grow on nearly all geological substrates if drainage is
sufficient [18]. Thus, this species realizes a very broad ecolog-
ical niche in terms of soil chemical properties and water avail-
ability. With respect to the area where this species is dominant
Fagus sylvatica must undoubtedly be considered as the most
successful Central European plant species.
In this comparative study in 50 beech forests, we explored
the effect of variable bedrock types on chemical properties and
the nutrient status of beech forest soils under a temperate subo-
ceanic climate in order to quantitatively analyse the ecological
niche of this species. The extraordinarily broad range of beech
forest sites found in Central Europe represents an outstanding
natural framework for analysing patterns and possible causes
of variation in the soil nutrient status of forests. Our principal
study aims were (1) to define the range (maximum and mini-
mum) and variability of important soil chemical and nutrient
Article published by EDP Sciences and available at or />356 C. Leuschner et al.
status parameters among Central European beech forests, (2)
to investigate the dependency of these parameters on bedrock
type and soil acidity, and (3) to analyse the importance of the
organic layer for the nutrient status of beech forests.
2. MATERIALS AND METHODS
2.1. Study sites, geology and climate
We investigated 50 mature beech stands in a restricted area of Cen-
tral Germany on a broad range of bedrock types with each geological
substrate being replicated four times allowing for statistical analyses
of the soil chemical data. Among the five ‘ecosystem state factors’
defined by Jenny [15] – climate, relief, organisms, parent material
and time – four could be held more or less constant in our study. This
allowed us to investigate the role of the fifth factor, parent material, on
soil nutrient status. Variation in climate and relief could be reduced to
a minimum by selecting suitable beech stands in similar topographic
positions within a limited area. The time factor had a similar influ-
ence at all studied forest sites because all soils have developed during
the Holocene for about 12 000 years, and all beech stands were of
similar age and belonged to ‘ancient woodland’ that presumably has
never been clear-cut in historic time. A major strength of our study
is that we compared single-species stands of the same tree species,
which largely eliminates Jenny’s [15] organism factor. This is impor-
tant because there is increasing evidence that tree species can have a
profound influence on the properties of forest floor and mineral top-
soil [4, 25, 28, 36, 37].
The 50 mono-specific mature beech forests were chosen in north-
eastern and southern Lower Saxony (Germany) at a maximum dis-
tance to each other of 200 km. The stands were selected on a soil
chemical gradient from extremely acidic sandy soils to base-rich, cal-
careous soils covering the whole range of soil types found under Cen-
tral European beech forests. Sandy glacial deposits of the penultimate
Ice Age (Saalian) cover the north of the study region (Lüneburger
Heide area), whereas the south (Leine-Weser-Bergland) represents
a small-scale mosaic of various Mesozoic and Kaenozoic bedrock
types. Thirteen bedrock types were chosen with each being repre-
sented by four sites (one bedrock type, i.e. fluvioglacial sands, was
represented by two sites only). For avoiding pseudo-replication, the
minimum distance between two neighbouring sites was set at 5 km.
Selection criteria for the 50 study sites were comparability with re-
spect to stand age, stand structure, and canopy closure. Sites with sig-
nificant cover layers of quaternary loess were not considered (except
for the loess sites Nos. 33–36). All stands represented closed mono-
specific beech forests with an age of about 100 years; small portions
of other broad-leaved trees (< 5% of the stems) were only present
at the sites on calcareous substrates. All study plots (20 × 20 m in
size) were placed by random in stand sections with more or less ho-
mogeneous stand structure, closed canopy and comparable stem den-
sity (150–250 stems ha
−1
). All sites were located below 520 m a.s.l.
mostly in the colline and submontane belts at level to slightly slop-
ing terrain (0–17˚). All stands with impact of past compensatory soil
liming were excluded from study. For a number of sites (Nos. 17, 18,
25, 27–31), however, complete absence of soil liming could not be
proven. In these cases, if liming was conducted, it should have oc-
curred at least 17 to 19 years ago, which minimises possible effects
on today’s soil chemical state [29].
The southern part of the study region (Leine-Weser-Bergland) rep-
resents hilly uplands (‘Mittelgebirge’) formed by Triassic, Jurassic
and Cretaceous sediments. In certain regions, a few centimeters to
several meters of Pleistocene loamy loess of the last glacial (Weich-
selian) covers these sediments. The soils are locally influenced by
periglacial cryoturbation and solifluctuation. At least in their upper
sections, all recent soil profiles are, therefore, not older than about
12 000 y. The northern part of the study region has been shaped
by the deposits of the Saalian Ice Age, while being influenced by
periglacial processes during the last glaciation (Weichselian). Char-
acteristic landscape elements are large fluvioglacial sand plains. In
addition, basal moraines with a high content of either sand or loam
cover extended areas. Locally, sandy loess has been deposited with a
thickness of several centimeters to a few meters.
The bedrock types chosen range from the Triassic to the Quater-
nary, thus spanning an epoch of about 240 M y. They include various
types of sandstone, limestone, claystone, sandy deposits, loess, and
glacial deposits (Tab. I). The soils are mainly Umbrisols (on sands,
sandstones, and glacial deposits), Cambisols (on claystones, lime-
stones, and loess), and Leptosols (on sandstones and limestones) in a
variety of sub-types. None of the sites is influenced by ground water.
Humus forms were classified according to Green et al. [12], soil types
after ISSS-ISRIC-FAO [34].
The study region has a temperate sub-oceanic climate with annual
mean temperatures of 7 to 9
◦
C. With only a few exceptions mean
precipitation is between 600 and 950 mm y
−1
(Tab. I). Study sites at
higher elevations regularly have a somewhat higher rainfall and lower
temperatures (the lapse rate is about 6 K km
−1
).
2.2. Soil sampling and chemical analyses
First, a soil profile examination in a representative pit was carried
out at every study site following the criteria of [2]. Soil samples were
taken with a soil corer of 20 mm diameter in the period August to
December 2000 at five randomly chosen points within the 20 × 20 m
study plot in both the organic layer and the mineral soil (0–10 and
10–20 cm depth). Thus, the soil chemical data given in this paper are
averages of 5 replicate samples each. To account for spatial variabil-
ity, each of the five samples itself consisted of four sub-samples that
were taken at random locations within a 50 cm radius around the re-
spective sampling point. These sub-samples were mixed and used for
a single analysis. Sample preparation and chemical analyses followed
mainly the protocol given by “Bundesweite Bodenzustandserhebung
im Wald” [6].
In the organic layer, the stocks of organic matter and carbon were
determined by sampling the entire layer to the surface of the mineral
soil with a soil corer (diameter 33 mm, length 100 mm), drying the
material (110
◦
C, 48 h) and weighing it. The stock was calculated
by relating the organic mass of the entire layer to corer aperture.
The pH was measured in water using a 1:2.5 humus/water suspen-
sion. Total carbon and nitrogen in the humus material were deter-
mined in samples dried at 60
◦
CusingaC/N elemental analyser (vario
EL III, elementar, Hanau, Germany); total phosphorus was detected
by yellow-dyeing and photometric measurement after digestion with
65% HNO
3
at 195
◦
C. The pools of Ca, Mg and K in the humus mate-
rial were analysed by atomic absorption spectroscopy (AAS vario 6,
analytik jena, Jena, Germany) after HNO
3
digestion.
Fresh mineral soil samples (0–10 and 10–20 cm depth) were anal-
ysed for pH in water using a 1:2.5 soil/water suspension. The con-
centrations of salt-extractable cations in the 0–10 cm horizon were
determined by percolating 2.5 g of soil with 100 mL of 1 M NH
4
Cl
solution for 4 h. The solution concentrations of K, Mg, Ca, Mn, Al
Nutrient availability in Fagus sylvatica forests 357
Table I. Location, altitude, geological epoch, parent material, soil type (classification according to [25]), mean annual precipitation and tem-
perature, and forest association of the 50 studied beech stands on thirteen different bedrock types in Lower Saxony, Germany. Precipitation and
temperature were derived from weather station data that were corrected for altitude.
Site Longitude Latitude Altitude Geol. Parent Soil type Prec. Temp. Assoc. Source
No. (E) (N) (m a.s.l.) epoch material (mm) (˚C)
1 10˚ 03’ 51˚ 32’ 420 l MU Limestone eCa-cCa 830 7.2 HF S
2 10˚ 03’ 51˚ 35’ 420 l MU Limestone rLe 790 7.2 HF S
3 09˚ 47’ 51˚ 25’ 335 l MU Limestone rLe 890 7.8 HF S
4 09˚ 50’ 51˚ 26’ 310 l MU Limestone rLe 770 7.9 HF S
5 09˚ 52’ 51˚ 55’ 300 u JU Limestone eCa-cCa 960 8.0 HF S
6 09˚ 33’ 52˚ 04’ 280 u JU Limestone eCa-cCa 850 8.1 HF S
7 09˚ 38’ 52˚ 03’ 340 u JU Limestone cCa-rLe 1030 7.7 CF S
8 10˚ 07’ 51˚ 52’ 280 u JU Limestone rLe 880 8.1 HF S
9 09˚ 54’ 51˚ 58’ 200 u CR Limestone rLe 810 8.7 CF S
10 09˚ 56’ 51˚ 58’ 290 u CR Limestone rLe 860 8.1 HF S
11 09˚ 47’ 51˚ 55’ 370 u CR Limestone rLe 880 7.5 HF S
12 09˚ 51’ 52˚ 01’ 285 u CR Limestone rLe-eCa 840 8.1 HF S
13 10˚ 05’ 51˚ 31’ 275 u BU Claystone vCa 740 8.2 HF S
14 10˚ 01’ 51˚ 28’ 260 u BU Claystone vCa (s) 760 8.3 HF S
15 09˚ 59’ 51˚ 26’ 410 u BU Claystone vCa 790 7.2 HF S
16 09˚ 49’ 51˚ 26’ 300 u BU Claystone vCa 770 8.0 HF S
17 09˚ 27’ 52˚ 05’ 330 m KE Claystone uLe-vCa 880 7.8 GF S
18 09˚ 12’ 52˚ 06’ 240 m KE Claystone Ca-Ph 830 8.4 GF S
19 09˚ 13’ 52˚ 03’ 210 m KE Claystone Ca 900 8.6 GF S
20 09˚ 53’ 51˚ 27’ 270 m KE Claystone Ca 760 8.2 GF S
21 09˚ 40’ 51˚43’ 380 m BU Sandstone Um-uLe (p) 950 7.4 LF S
22 09˚ 46’ 51˚ 40’ 260 m BU Sandstone Um 770 8.3 LF S
23 09˚39’ 51˚32’ 395 m BU Sandstone uLe-Um 820 7.3 LF S
24 10˚ 02’ 51˚ 57’ 250 m BU Sandstone p uLe-Um 860 8.4 LF S
25 09˚ 25’ 52˚ 11’ 320 l CR Sandstone p Um 980 7.9 LF S
26 09˚ 35’ 52˚ 08’ 220 l CR Sandstone p Um-uLe 940 8.6 LF S
27 09˚ 42’ 51˚ 58’ 310 l CR Sandstone p Um-uLe 870 7.9 LF S
28 09˚ 44’ 51˚ 55’ 270 l CR Sandstone p Um-uLe 860 8.2 LF S
29 09˚ 41’ 51˚ 26’ 270 TE Sand Um 760 8.2 LF S
30 09˚ 42’ 51˚ 21’ 520 TE Sand Um 810 6.5 LF S
31 09˚ 45’ 51˚ 26’ 425 TE Sand Um 790 7.1 LF S
32 09˚ 45’ 51˚ 29’ 440 TE Sand Um 840 7.0 LF S
33 09˚ 28’ 52˚ 07’ 142 pl LL Loess Ph-Ca 780 9.1 GF S
34 09˚ 25’ 52˚ 03’ 140 pl LL Loess p Ph 830 9.1 LF S
35 09˚ 17’ 52˚ 06’ 180 pl LL Loess Ca-Ph 800 8.8 GF S
36 10˚ 07’ 51˚ 31’ 250 pl LL Loess Ca-Ph 720 8.4 LF S
37 10˚ 33’ 53˚ 06’ 80 pl SL Loess p Lu 610 8.4 FQ Gö
38 10˚ 33’ 53˚ 06’ 80 pl SL Loess p Lu 610 8.4 FQ Gö
39 10˚ 29’ 53˚ 02’ 90 pl SL Loess p Lu 610 8.4 FQ Gö
40 10˚ 33’ 53˚ 06’ 80 pl SL Loess p Lu 610 8.4 FQ Gö
41 09˚ 37’ 52˚ 41’ 50 pl LM Glacial deposit St-Lu 670 9.1 FQ Gö
42 10˚ 29’ 53˚ 02’ 90 pl LM Glacial deposit St-Lu 610 8.4 FQ Gö
43 10˚ 22’ 53˚ 01’ 90 pl LM Glacial deposit St-Lu 610 8.4 FQ Gö
44 10˚ 35’ 53˚ 04’ 80 pl LM Glacial deposit St-Lu 610 8.4 FQ Gö
45 09˚ 36’ 52˚ 46’ 50 pl SM Glacial deposit p Um 670 9.1 FQ Gö
46 10˚ 22’ 53˚ 01’ 90 pl SM Glacial deposit p Um 610 8.4 FQ Gö
47 10˚ 29’ 53˚ 02’ 90 pl SM Glacial deposit p Um 610 8.4 FQ Gö
48 09˚ 19’ 52˚ 48’ 50 pl SM Glacial deposit p Um 670 9.1 FQ Gö
49 10˚ 30’ 52˚ 45’ 115 pl FS Glacial deposit p Um 800 8.1 FQ Le
50 10˚ 30’ 52˚ 45’ 115 pl FS Glacial deposit p Um 800 8.1 FQ Le
Geological epoch: l MU = Lower Muschelkalk; u JU = Upper Jurassic; u CR = Upper Cretaceous; u BU = Upper Bunter; m KE = Middle
Keuper; m BU = Middle Bunter; l CR = Lower Cretaceous; TE = Tertiary; pl LL = Pleistocene loamy loess, last Ice Age (Weichselian); pl SL =
Pleistocene sandy loess, last Ice Age (Weichselian); pl LM = Pleistocene loamy moraine, penultimate Ice Age (Saalian); pl SM = Pleistocene
sandy moraine, penultimate Ice Age (Saalian); pl FS = Pleistocene fluvioglacial sand, penultimate Ice Age (Saalian). Soil type (WRB): c =
chromic; Ca = Cambisol; e = eutric; Le = Leptosol; Lu = Luvisol; p = podzolic; Ph = Phaeozem; r = rendzic; s = stagnic; St = Stagnosol;
u = umbric; Um = Umbrisol; v = vertic. Association: CF = Carici-Fagetum; GF = Galio odorati-Fagetum; HF = Hordelymo-Fagetum; LF =
Luzulo-Fagetum; FQ = Fago-Quercetum (= Luzulo-Fagetum, lowland type). Source: S = data from this study; Gö = from Gönnert; Le = from
Leuschner and Rode (unpubl.).
358 C. Leuschner et al.
and Fe were analysed by atomic absorption spectroscopy. Fe was as-
sumed to be Fe
2+
. The concentration of hydrogen ions at the cation
exchangers was calculated from the observed pH change during the
percolation process. The effective cation exchange capacity (CEC
e
)
was calculated as the sum of all extractable cations in the NH
4
Cl ex-
traction [22]. The base saturation gives the percentage portion of Ca,
KandMginCEC
e
. Plant-available phosphorus (P
a
) according to [5]
was extracted by resin bags that were placed for 16 h in a solution
of 1 g of soil material suspended in 30 mL water [33]. P was then
re-exchanged by NaCl and NaOH solutions and analysed by blue-
dyeing [24] and photometric measurement. Total carbon and nitrogen
in the mineral soil were determined with a C/N elemental analyser.
The bulk density of the mineral soil was measured by weighing dried
soil samples of 100 cm
3
.C/NandN/P ratios are given in mol mol
−1
.
For most element species, analyses were only conducted in the 0–10
and 10–20 cm horizons. For C and N, a lower horizon (20–30 cm)
was also investigated in order to estimate profile totals of soil carbon
and nitrogen.
In about 10 profiles, the subsoil was analysed to a depth of 100 or
200 cm for establishing depth functions of soil C and N content. P
a
could not be investigated at all sites due to the large number of study
sites (only nine bedrock types).
2.3. Statistical analyses
In a first step, means and standard errors of the soil chemical data
were calculated from each five (fluvioglacial sands: ten) samples per
study site. Second, means and standard errors were calculated for the
thirteen bedrock types by treating the each four (fluvioglacial sands:
two) study sites of a given bedrock type as replicates. Statistical anal-
yses were conducted with the package SAS 8.1 (Statistical Analy-
ses System, SAS Institute Inc., Cary, NC, USA). Probability of fit to
normal distribution was tested by a Shapiro-Wilk test. In the case of
Gaussian distribution, mean values of the bedrock types were com-
pared by a one-factorial analysis of variance followed by a Scheffé
test. Data sets deviating from normal distribution were compared by
one-way Kruskal-Wallis single factor analyses of variance. If H
0
(no
significant differences among any of the bedrock types) was rejected,
a non-parametric multiple comparison test after Wilcoxon was ap-
plied to locate the differences. We employed linear regression analy-
sis to quantify the influence of various soil chemical factors on each
other. Significance was determined at p < 0.05 in all tests. To anal-
yse the differentiation of the 50 study sites with respect to various soil
chemical parameters, a PCA analysis was applied to the standardised
data of the mineral soil and organic layer (package CANOCO, ver-
sion 4.5, Biometris, Wageningen, The Netherlands).
3. RESULTS
3.1. Soil types, humus profiles and soil chemistry
as dependent on bedrock type
Central European beech forests grow on a broad range of
soil types ranging from rendzic Leptozols and eutric Cam-
bisols on limestone substrates to podzolic Luvisols and Um-
brisols on the highly acidic glacial deposits (Tab. I). Under
limestone and claystone beech forests, the typical humus form
was a thin vermimull. Sandstones, Tertiary sands and loamy
loess showed a variety of humus types including leptomoders,
mullmoders and mormoders (Tab. II). The majority of glacial
deposits and sandy loess sites were characterised by more or
less thick mor profiles (raw humus) or mormoders.
We found a gradual increase in the soil acidity of the min-
eral topsoil (0–10 cm) from the limestone sites (pH in H
2
O
5.4 to 5.6) through the claystones (4.7 to 5.3) and the sand-
stone, sand and loess sites (3.3 to 4.3) to the glacial sands and
loams (3.3 to 3.7, Fig. 1a). The increase in acidity was paral-
leled by an increase in the mineral soil C/N ratio from about
16 mol mol
−1
on the limestones to values > 30 mol mol
−1
in some sandy glacial substrates (Tab. III). There was also a
general increase in the pool of salt-exchangeable aluminium
(Al
ex
) in the mineral topsoil (0–10 cm) from limestone sites
to the glacial sands. However, the variation in Al
ex
among
the four acidic glacial deposit types was very large (1.9–
7.8 mol m
−2
10 cm
−1
, Tab. III).
3.2. Variation in depth and quality of the organic layer
and related controlling factors
The 13 bedrock types differed by a factor of more than 10
in the amount of organic dry mass on top of the soil surface
(Tab. II). Only small humus amounts (1.4–2.9 kg d.m.m
−2
)
were found in beech forests on the five limestone and claystone
substrates, and in those on the Pleistocene loamy moraines
(plLM). The corresponding carbon pools ranged from 40 to
86 mol C m
−2
(Fig. 2a). Soils on sandstones, Pleistocene loess
or sandy moraine material contained 3.2 to 6.7 kg d.m.m
−2
of organic matter, or 90–193 mol C m
−2
. We found by
far the largest amounts on Tertiary sands (10.0 kg d.m.m
−2
or 221 mol C m
−2
) and on Pleistocene fluvioglacial sands
(19.2 kg d.m.m
−2
or 531 mol C m
−2
). The variation in or-
ganic layer dry mass was closely linked to the humus profile
sequence from vermimull or leptomoder to mor (Tab. II).
According to our regression analysis, the amount of C in the
organic layer was most closely related to exchangeable alu-
minium (Al
ex
) in the mineral soil (r
2
= 0.82). Base saturation
(r
2
= 0.40) and C/N ratio (r
2
= 0.35) of the mineral topsoil
had a smaller influence on the C pool. The pH effect (mineral
soil or organic layer) was only weak (Tabs. IV and V).
The accumulation of carbon in the organic layer was closely
linked to that of nitrogen as evidenced by a coefficient of deter-
mination of 0.99 for the C pool/N pool relation (Tab. IV), and
a remarkably uniform C/N ratio of the organic layer material
(22.7–29.7 mol mol
−1
) across the 13 bedrock types (Tab. II).
The pools of total N in the organic layer varied between 1.5
(limestone lMU) and 18.9 mol m
−2
(fluvioglacial sand plFS,
Fig. 2). On the other hand, the C/N ratio of the organic layer
was not correlated to any of the soil chemical properties in-
vestigated in the organic layer or the mineral soil (Tabs. IV
and V). The accumulation of N in the organic layer was highly
dependent on Al
ex
in the mineral soil, as was found for car-
bon accumulation. Total nitrogen in the organic layer showed
an exponential increase when the base saturation of the min-
eral soil fell below 50% (Fig. 3e), indicating that both Al
ex
Nutrient availability in Fagus sylvatica forests 359
Table II. Humus form, organic matter (dry mass), pH, C/N, pools of total nitrogen, total phosphorus, and of total calcium, magnesium, and potassium, and C/N, C/P, N/P, C/Ca,
C/Mg, and C/K ratios in the organic layer (forest floor) of beech forests on thirteen different bedrock types (means, standard errors of four (or two) stands per bedrock type). Values
relate to the entire organic layer (L, F, H layers). Different Latin or Greek letters in a row indicate significant differences among bedrock types. Data for pleistocene fluvioglacial
sands according to Leuschner and Rode (unpubl.), data for pleistocene loamy moraines, sandy moraines, and sandy loess according to Gönnert [9]. Humus forms according to Green
et al. [10].
Parent material Limestones Claystones Sandstones Sand Loess Glacial deposits
Geological epoch l MU u JU u CR u BU m KE m BU l CR TE pl LL pl SL pl LM pl SM pL FS
n 44444 4 44 4 4 4 4 2
Humusform vmvmvmvmvm m lmlm lm rh m rh mm
Organic matter (kg d.m.m
−2
) mean 1.4
C
2.4
C
2.9
BC
1.9
C
2.3
C
6.7
BC
4.4
BC
10.0
B
3.2
BC
3.2
BC
1.6
C
5.1
BC
19.2
A
s.e. 0.2 0.1 0.4 0.2 0.1 1.7 0.4 2.3 0.7 0.8 0.3 1.2 3.4
pH(H
2
O)
(org)
mean 5.9
ab
5.9
ab
5.9
a
5.8
abc
5.7
abc
4.7
bcde
4.5
cde
4.4
de
5.0
abcd
3.4
e
3.8
e
3.5
e
3.6
e
C/N
(org)
(mol mol
−1
) mean 29.7
β
26.3
αβ
25.4
αβ
23.3
αβ
24.1
αβ
24.8
αβ
24.3
αβ
24.5
αβ
25.3
αβ
29.7
β
22.7
α
28.1
αβ
28.2
αβ
s.e. 1.6 1.0 1.9 0.7 0.6 0.5 0.7 0.7 0.4 0.6 0.5 1.4 0.4
N
t (org)
(mol m
−2
) mean 1.5
C
2.4
BC
3.3
BC
2.2
BC
2.5
BC
7.9
BC
6.3
BC
9.1
B
3.6
BC
3.2
BC
1.8
BC
5.0
BC
18.9
A
s.e. 0.3 0.3 0.4 0.2 0.2 2.0 0.9 1.3 0.9 1.1 0.3 1.3 3.8
C/P
(org)
(mol mol
−1
) mean 579
a
979
ab
795
ab
499
a
940
ab
764
ab
1050
ab
612
a
1395
ab
679
a
1022
ab
1608
b
1646
b
s.e. 59 182 107 29 218 76 84 79 172 81 200 187 21
P
t (org)
(mmol m
−2
) mean 81
b
69
b
109
ab
102
ab
72
b
262
ab
160
ab
414
a
141
ab
65
b
40
b
89
b
322
ab
s.e. 12 8 9 9 15 78 7 134 38 13 8 24 57
N
t (org)
(mol mol
−1
) mean 19.3
α
36.9
αβ
30.7
αβ
21.5
α
39.3
αβ
31.1
αβ
43.1
αβ
23.9
αβ
27.0
αβ
47.2
αβ
45.3
αβ
56.8
β
58.5
β
s.e. 1.5 6.3 2.3 0.8 9.3 3.0 3.6 3.8 3.4 6.5 9.5 4.8 1.5
C/Ca
(org)
(mol mol
−1
) mean 72
A
69
A
60
A
83
A
104
A
332
ABC
333
ABC
261
AB
151
A
770
BC
237
AB
366
ABC
839
C
s.e. 3 6 9 5 18 109 72 20 51 236 38 50 169
C/Mg
(org)
(mol mol
−1
) mean 306
a
299
a
246
a
109
a
130
a
826
a
1116
ab
482
a
545
a
1224
ab
822
a
1143
ab
2250
b
s.e. 55 80 15 9 20 208 327 109 256 189 194 187 339
C/K
(org)
(mol mol
−1
) mean 250
α
352
α
259
α
145
α
165
α
541
α
1042
αβ
674
α
547
α
2115
βγ
1322
αβγ
2502
γ
1240
αβ
s.e. 47 147 41 12 76 92 151 107 115 302 313 358 126
(Ca + Mg + K)
t (org)
(mol m
−2
) mean 1.0
A
1.0
A
1.9
A
1.5
A
0.8
A
1.4
A
0.6
A
2.0
A
1.3
A
0.3
A
0.3
A
0.6
A
1.4
A
Geological epoch: l MU = Lower Muschelkalk; u JU = Upper Jurassic; u CR = Upper Cretaceous; u BU = Upper Bunter; m KE = Middle Keuper; m BU = Middle Bunter; l CR =
Lower Cretaceous; TE = Tertiary;plLL= Pleistocene loamy loess, last Ice Age (Weichselian); pl SL = Pleistocene sandy loess, last Ice Age (Weichselian); pl LM = Pleistocene
loamy moraine, penultimate Ice Age (Saalian); pl SM = Pleistocene sandy moraine, penultimate Ice Age (Saalian); pl FS = Pleistocene fluvioglacial sand, penultimate Ice Age
(Saalian). Humus form: lm = leptomoder; m = mullmoder; mm = mormoder; rh = raw humus, mor; vm = vermimull. a = plant-available content; ex = exchangeable content; t = total
content; min = mineral soil (0–10 cm); org = organic layer (forest floor).
360 C. Leuschner et al.
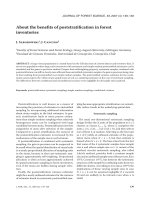
Figure 1. pH values (a), cation exchange capacity (b), pool of exchangeable calcium, magnesium, and potassium (c), and base saturation (d)
in the mineral soil (0–10 cm) of beech forests on thirteen different parent materials (means and standard errors of four (two) stands per
parent material). Different letters indicate significant differences among parent materials. Data for pleistocene fluvioglacial sands according to
Leuschner and Rode (unpubl.), data for pleistocene loamy moraines, sandy moraines, and sandy loess according to Gönnert [10].
Table III. Soil type, C concentration, C/N ratio and pools of plant-available phosphorus or exchangeable aluminium in the mineral soil (0–
10 cm) of beech forests on thirteen different bedrock types (means, standard errors of four (or two) stands per bedrock type). Different Latin
or Greek letters in a row indicate significant differences among bedrock types. Data for pleistocene fluvioglacial sands according to Leuschner
and Rode (unpubl.), data for pleistocene loamy moraines, sandy moraines, and sandy loess according to Gönnert [9]. Soil types according to
ISSS-ISRIC-FAO [25].
Parent material Limestones Claystones Sandstones Sand Loess Glacial deposits
Geological epoch l MU u JU u CR u BU m KE m BU l CR TE pl LL pl SL pl LM pl SM pL FS
n 44444 44 4 4 4442
Soil type rLe eCa-cCa rLe vCa Ca uLe-Um pUm-uLe Um Ca-Ph pLu St-Lu pUm pUm
C
org (min)
(%) mean 12.9
a
6.0
a
8.2
a
6.1
a
4.6
a
7.5
a
6.8
a
6.2
a
7.1
a
4.8
a
4.7
a
3.5
a
2.4
a
s.e. 3.3 0.9 1.9 1.0 1.3 0.8 1.1 1.3 2.9 0.1 0.5 0.5 0.0
C/N
(min)
(mol mol
−1
) mean 16.4
AB
16.5
AB
15.4
A
16.0
AB
17.9
AB
25.7
BCDE
24.5
ABCDE
23.6
ABCD
25.0
ABCDE
33.6
E
20.3
ABC
28.2
CDE
31.4
E
s.e. 0.2 1.0 0.4 0.8 0.9 0.9 1.1 1.4 1.7 1.2 1.1 2.8 4.6
P
a(min)
(mmol m
−2
) mean 563
a
418
a
298
a
521
a
599
a
475
a
607
a
386
a
416
a
n.i. n.i. n.i. n.i.
s.e. 113 76 46 65 139 73 145 65 52
Al
ex (min)
(mol m
−2
10 cm
−1
) mean 0.4
β
0.6
β
1.5
β
1.2
β
2.7
β
2.1
β
2.1
β
2.8
β
1.7
β
1.6
β
2.6
β
1.9
β
7.8
α
s.e. 0.3 0.3 0.7 0.3 0.8 0.3 0.2 0.3 0.2 0.3 0.2 0.5 1.7
Nutrient availability in Fagus sylvatica forests 361
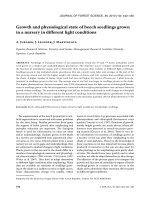
Figure 2. Carbon (a) and nitrogen (b) pools in the organic layer and the mineral soil (0–30 cm) of beech forests on thirteen parent materials
(means and standard errors of four (two) stands per parent material). Values relate to the entire organic layer (L, F, H layers). Mineral soil
data: filled bars: 0–30 cm, dotted bars: values extrapolated to 100 cm based on stone content and C (or N)-depth relationships derived from
representative profiles. Different letters indicate significant differences among parent materials.
Table IV. Results of correlation analyses of organic layer properties in beech forests on thirteen different bedrock types. Given is a positive or
negative sign for the slope b of the relationship, the determination coefficient r
2
and the probability of error p of linear equations (y = a + bx)to
relate the C pool, pH value, C/NandN/P ratio, total nitrogen and total phosphorus pools, and total calcium, magnesium, and potassium pools
in the organic layer to each other. All significant correlations (p ≤ 0.05) are in bold. For units refer to Table I and Figure 1.
Organic layer
pH (H
2
O) C/NN
t
P
t
N
t
/P
t
(Ca + Mg + K)
t
br
2
pbr
2
pbr
2
pbr
2
pbr
2
pbr
2
p
Organic layer
C
org
– 0.24 0.04 + 0.06 0.22 + 0.99 < 0.001 + 0.56 0.002 + 0.23 0.05 + 0.09 0.16
pH (H
2
O) – 0.07 0.20 – 0.23 0.05 – 0.07 0.20 – 0.56 0.002 + 0.18 0.07
C/N + 0.03 0.30 –0.006 0.40 + 0.09 0.16 – 0.05 0.24
N
t
+ 0.65 < 0.001 + 0.18 0.07 + 0.12 0.12
P
t
– 0.004 0.42 + 0.41 0.009
N
t
/P
t
– 0.30 0.02
(Ca + Mg + K)
t
and base saturation in the mineral soil are key factors for the
accumulation of C and N in the organic layer.
The total pool of phosphorus was particularly large in the
organic layer of the Tertiary sands and the fluvioglacial sands
(plFS, Tab. II), where large amounts of organic matter had
accumulated. However, the organic layer P
t
pool (and also
the Ca + Mg + K pool) depended much less on the organic
layer C pool (r
2
= 0.56 and 0.09) than did the N
t
pool
(r
2
= 0.99, Tab. IV). Other than C/N ratio, N/P of the organic
layer varied considerably among the bedrock types with ratios
> 45 mol mol
−1
in the Pleistocene sandy and loamy soils, and
values < 45 in all other substrates. The most influential organic
layer properties that influenced the N/P ratio were the pH with
a negative, and the organic layer C/Ca ratio with a positive,
influence on N/P (Figs. 3a and 3b).
Among the most variable parameters were the organic layer
C/Ca, C/Mg and C/K ratios which differed by factors of five to
ten between the limestone and the glacial deposit sites. Or-
ganic layer pH decreased from 5.9 (limestone sites) to 3.5
(glacial deposits).
3.3. Variation of mineral soil nutrient status
with bedrock type
The total pool of nitrogen in the mineral soil (0–30 cm) was
much smaller in the glacial sandy and loamy substrates than in
all other bedrock types. We measured 16 to 30 mol N m
−2
in
these highly acidified soils, whereas limestone, claystone and
sandstone soils contained at least twice as much with max-
ima reaching 141 mol m
−2
in the lMU sites (Fig. 2b). There
362 C. Leuschner et al.
Table V. Results of correlation analyses of mineral soil properties (0–10 cm) to organic layer and mineral soil properties in beech forests on thirteen different bedrock types. Given is
a positive or negative sign for the slope b of the relationship, the determination coefficient r
2
and the probability of error p of linear equations (y = a + bx). All significant correlations
(p ≤ 0.05) are in bold. For units refer to Table I and Figure 1.
Mineral soil
pH (H
2
O) C/NN
t
CEC Base saturation (Ca + Mg + K)
ex
Al
ex
br
2
pbr
2
pbr
2
pbr
2
pbr
2
pbr
2
pbr
2
p
Organic layer
C
org
– 0.15 0.09 + 0.35 0.02 – 0.11 0.14 – 0.12 0.12 – 0.40 0.01 –0.130.12 + 0.82 < 0.001
pH (H
2
O) + 0.92 < 0.001 – 0.77 < 0.001 + 0.52 0.003 + 0.55 0.002 + 0.70 < 0.001 + 0.52 0.003 – 0.27 0.03
C/N – 0.01 0.35 + 0.20 0.06 + 0.003 0.43 + 0.01 0.36 + < 0.001 0.47 + 0.04 0.20 + 0.003 0.43
N
t
– 0.16 0.09 + 0.33 0.02 – 0.09 0.15 – 0.13 0.11 – 0.42 0.008 – 0.14 0.10 + 0.80 < 0.001
P
t
– 0.06 0.21 + 0.13 0.11 + < 0.001 0.46 – 0.08 0.18 – 0.28 0.03 – 0.10 0.15 + 0.33 0.02
N
t
/P
t
– 0.44 0.007 + 0.43 0.007 – 0.72 < 0.001 – 0.22 0.05 – 0.34 0.02 –0.24 0.04 +0.33 0.02
(Ca + Mg + K)
t
+ 0.20 0.06 – 0.08 0.18 + 0.23 0.05 + 0.14 0.10 + 0.04 0.27 + 0.11 0.13 + 0.02 0.33
Mineral soil
pH (H
2
O) –0.71< 0.001 + 0.51 0.003 + 0.70 < 0.001 + 0.81 < 0.001 + 0.69 < 0.001 – 0.21 0.06
C/N – 0.41 0.009 – 0.51 0.003 – 0.70 < 0.001 – 0.49 0.004 + 0.27 0.03
N
t
+ 0.48 0.004 + 0.45 0.006 + 0.55 0.002 – 0.23 0.05
CEC + 0.74 < 0.001 + 0.97 < 0.001 – 0.18 0.07
Base saturation + 0.78 < 0.001 – 0.46 0.005
(Ca + Mg + K)
ex
– 0.20 0.06
Nutrient availability in Fagus sylvatica forests 363
Figure 3. Some relationships between organic layer properties (a and b), between organic layer and mineral soil properties (c–f), and between
mineral soil properties (g and h) in beech forests on thirteen different parent materials (means of four (two) stands per parent material). Given
are the relationships between N
t
/P
t
ratio of the organic layer and the pH or the C/Ca ratio of the organic layer (a and b), the relationships between
organic layer N/P and mineral soil (0–10 cm) N
t
(c), dry mass of the organic layer and exchangeable Al in the mineral soil (0–10 cm; d), N
t
of
the organic layer and base saturation (e) and C/N of the organic layer or the mineral soil to base saturation, (Ca + Mg + K)
ex
or the C/N ratio
of the mineral topsoil (f–h).
364 C. Leuschner et al.
was a remarkable difference in the N content within the min-
eralogically heterogeneous group of the sandy and loamy sub-
strates: Tertiary sands and Pleistocene loess sites contained 80
and 81 mol N m
−2
in the 0–30 cm profile which is three to four
times more than was found in the topsoil of Pleistocene sands
or loams. Similarly, the variation among the three limestone
substrates was also large (65–141 mol m
−2
).
The more N occurred in the mineral soil, the smaller was
the N pool in the organic layer on top of the soil because its
depth decreased toward the N-rich limestone soils (Fig. 2b).
Thus, similar to carbon, the soil N pool generally showed an
upward shift with increasing soil acidity or decreasing base
saturation. Extremes in this general trend were the limestone
sites on Muschelkalk (lMU) with a ratio of about 140 for the
mineral soil N pool (0–30 cm) vs. the organic layer pool. In
contrast, the fluvioglacial sand (plFS) held about three times
more N in the organic layer (19 mol m
−2
) than in the upper
mineral soil (6 mol m
−2
at 0–30 cm).
Plant-available phosphorus (resin-exchangeable P, P
a
)var-
ied by a factor of two among the nine investigated bedrock
types. We did not detect a significantly lower P availability in
the basic calcareous substrates than in the acidic sandstone and
sandy soils (Tab. III).
The pool of exchangeable Ca + Mg + K in the mineral
topsoil was very small in the glacial sandy and loamy de-
posits, as well as in the sandstones (0.9–2.4 mol m
−2
10 cm
−1
),
where a base saturation < 35% was found (Figs. 1c and
1d). The (Ca + Mg + K)
ex
pool increased toward the clay-
stones (4.1–10.5 mol m
−2
) and further to the limestones (21.2–
37.6 mol m
−2
), which both showed much higher base satura-
tions (44–95%).
Highly different coefficients of variation (CV) were found
for the measured soil chemical parameters if their variation
among the 13 bedrock types was considered. In the case of the
mineral soil parameters, a relatively high between-substrate
variation existed for the concentrations of (Ca + Mg + K)
ex
and H
+
(140 and 121%, respectively), an intermediate varia-
tion for cation exchange capacity (102%) and exchangeable
Al (83%), and a relatively low one for N
t
and base saturation
in the topsoil (67 and 65%). In the organic layer, highest vari-
ation was found for H
+
(144%), an intermediate one for the
N
t
and P
t
pools (92 and 77%, respectively) and for the C con-
centration (98%), and the lowest one for the base cation pool
(53%).
3.4. Interrelationships between mineral soil
and organic layer chemistry
Six of the seven chemical parameters studied in the mineral
soil were highly correlated to each other: pH (H
2
O), C/N, N
t
,
CEC, base saturation and exchangeable Ca + Mg + K pool
(Tab. V). Most relations were significant at p < 0.01. De-
creases in pH were correlated with highly significant decreases
in the (Ca + Mg + K)
ex
pool, N
t
, base saturation and also
CEC. Similar relationships were found between base satura-
tion and the mentioned parameters. The close negative relation
between base saturation and C/N ratio is depicted as an exam-
ple (Fig. 3h). The only mineral soil parameter with contrasting
behaviour was Al
ex
which showed a close negative relation to
C/N and base saturation, but it was not significantly related to
any of the other variables (Tab. V).
In the organic layer, the inter-relationship between the six
measured chemical parameters was much weaker (Tab. IV).
The N/P ratio of the organic material decreased exponentially
with increasing pH and C/Ca ratio of this material (Figs. 3a
and 3b). Remarkably, N/P in the organic material was not sig-
nificantly correlated with neither N
t
nor P
t
in the organic layer
itself, but it showed a highly significant relation to several pa-
rameters of the mineral soil including N content, C/N ratio
(Tab. V and Fig. 3c), pH and base saturation of the 0–10 cm
horizon (Tab. V).
4. DISCUSSION
4.1. Which soil chemical parameters are important
for an ecological grouping of beech forests?
We shall focus the discussion about key chemical parame-
ters in beech forest soils on those nutrient elements which are
known to be potentially limiting for plant growth in temper-
ate forests, i.e. the macro-elements N, P, K and Mg, with the
first two being of general importance and the latter two being
relevant in sandy and acidic soils [8, 9]. We also included Ca
as an element closely related to the carbonate buffering sys-
tem in the soil. On the other hand, Fe, S and all trace elements
were not considered. In the absence of a comprehensive set of
N mineralization data, we used total nitrogen and C/N ratio as
rough indicators of relative N availability.
Figure 1c shows that the 50 beech forests can be sharply
split into two groups based on the (Ca + Mg + K)
ex
pool in
the mineral soil (1–4 and 4–38 mol m
−2
in the 0–10 cm soil
horizon). Indeed, the pool of exchangeable base cations re-
vealed by far the largest substrate-related variation among all
nutrient fractions studied (CV = 140%). A similarly large in-
crease in (Ca + Mg + K)
ex
by a factor of 5 or more from
carbonate-free soils to limestone soils was found by Hantl [13]
in a survey of Northwest German forest soils. In our sample,
the increase in the (Ca + Mg + K)
ex
pool was partly caused
by higher cation exchange capacities (CEC) in the clay-rich
limestone and claystone sites (> 130 µmol
c
gd.m.
−1
)com-
pared to the majority of sandy and loamy substrates (about 40–
80 µmol
c
gd.m.
−1
, Fig. 1b). It has to be noted, however, that
our extraction method (1 M NH
4
Cl) may have substantially
overestimated CEC in the case of the carbonate-rich limestone
substrates.
Plant-availability of P in forest soils depends on various fac-
tors including soil acidity, which determines the size of the
insoluble Ca-P and Al-P fractions, the amount of organically-
bound P, and mycorrhizal activity. In Central German beech
forests, no clear dependence on soil type or forest commu-
nity type was found for various fractions of extractable P [31].
Phosphorus bound to organic compounds is probably the most
important P fraction in acidic forest soils with thick organic
Nutrient availability in Fagus sylvatica forests 365
layers; thus, the plant-availability of P in these soils is largely
dependent on the size of the soil carbon pool and the P-
mineralising activity of microorganisms and mycorrhizal hy-
phae. Since the C pools in organic layer and mineral soil were
highly variable among the bedrock types in our study, the size
of the P pool did also vary considerably.
Our data indicate that important information on the relative
availability of P can be deduced from the N
t
/P
t
ratio of the or-
ganic layer. This ratio changed more or less continuously from
< 20 mol mol
−1
in some base-rich limestone sites to > 55 in
the most acidic glacial sands. Koerselman and Meuleman [16]
have suggested that the foliar N/P ratio may serve as an in-
dicator of the kind of nutrient limitation of plant growth with
ratios < ca. 15 pointing at P limitation, ratios > ca. 15 standing
for N limitation. If N/P is an indicator of relative growth limi-
tation by N or P in trees as well, our data indicate that P limi-
tation, if existent, should prevail in beech soils on Pleistocene
sands and, to a lesser extent, on loess and sandstone substrates,
whereas beech stands on limestones and claystones should be
limited rather by N than by P. However, in the absence of ex-
perimental data on critical N/P ratios in mature beech forests,
these conclusions must remain speculative.
The total N pool in the soil is mainly dependent on the N
concentration in the mineral soil as reflected by the C/Nra-
tio, but it is also influenced by the thickness of the organic
layer. We found three to five times larger soil N pools in the
soils on limestone, claystone or loess substrates than on sandy
glacial deposits which most likely indicate higher annual N
supply rates to the plants on these bedrock types. A compi-
lation of experimentally obtained N mineralization data for
various beech forests provided evidence that N supply in the
mineral soil indeed increases with increasing N
t
content or de-
creasing C/N ratio. Yet, lower mineralization rates in the min-
eral soil of acidic soils are partly compensated by higher sup-
ply rates from thicker organic layers [18]. As a consequence,
Leuschner [18] concluded that, in recent times, Central Euro-
pean beech forests have rather similar N supply rates across a
broad spectrum of acidic and basic soils. Accordingly, N sup-
ply seems to differentiate much less between beech forests on
different bedrock types than does Ca + Mg + K or P avail-
ability. This finding is partly supported by the C/N ratios of
the organic layers that were more or less similar among the 13
bedrock types, in contrast to the mineral soil C/N ratios. Simi-
larly, Raulund-Rasmussen and Vejre [28] found only small dif-
ferences in the C/N ratio of the forest floor in Danish forests
stands across a large pH range which they attributed to atmo-
spheric N deposition in recent times.
The results of the principle components analysis confirmed
the prominent role of the three soil chemical variables (Ca +
Mg + K)
ex
and C/N ratio of the mineral soil, and N/P ratio
of the organic layer for differentiating the 50 beech forests
in terms of their soil nutrient status. The PCA separated the
main geological substrates along the first axis (eigenvalue =
0.474) in the sequence forests on limestones – claystones –
sandstones – sand/glacial deposits (Fig. 4). This axis was re-
lated to the three mentioned variables (variable loadings: (Ca
+ Mg + K)
ex
: 0.80, C/N: –0.87, N/P: –0.73). Based on the
three parameters we were able to identify three rather clearly
differentiated groups of beech forest soils:
(1) stands on various limestone and claystone substrates
with low C/N ratios in the mineral soil (15–18 mol mol
−1
), low
to intermediate N/P ratios (19–39 mol mol
−1
) and medium to
high (Ca + Mg + K)
ex
pools (4–38 mol m
−2
10 cm
−1
);
(2) stands on moderately acidic, but more or less silicate-
rich substrates (sandstones, Tertiary sands, loamy loess, loamy
moraines) with intermediate C/N ratios in the mineral soil (20–
26 mol mol
−1
), variable N/P ratios (24–45 mol mol
−1
)andlow
(Ca + Mg + K)
ex
pools (about 2 mol m
−2
10 cm
−1
); and
(3) stands on highly acidic, silicate-poor sandy deposits
with high C/N ratios in the mineral soil (28–34 mol mol
−1
),
high N/P ratios (47–59 mol mol
−1
)andlow(Ca+ Mg + K)
ex
pools (about 1 mol m
−2
10 cm
−1
).
Our data lead to the conclusion that the build-up of thick or-
ganic layers, as it occurs on Al-rich, acidic substrates, mainly
increases the pool of N bound in organic material, whereas the
enrichment of other key nutrients (P, Mg, K, Ca) is favoured
by the process of organic layer carbon accumulation to a lesser
extent. Beech forests with thick organic layers are, therefore,
more likely affected by limitation of P (and/or Mg or K) than
by N shortage. However, this conclusion must remain insecure
until appropriate data on N mineralisation are available for the
complete data set.
4.2. Niche breadth of Fagus sylvatica with respect
to nutrient availability and soil acidity
The 50 beech forests from 13 different bedrock types cover
nearly the entire range of site conditions that support beech
growth in northern Central Europe [26]. Exceptions are sites
with groundwater influence and on sand dunes which were not
included in our study. However, both substrate types are only
exceptionally colonized by beech forests. Thus, the maxima
and minima of soil chemical parameters from our study may
serve for defining the breadth of the ecological (or realized)
niche of this species with respect to soil nutrient concentra-
tions, soil acidity and Al
ex
concentration.
Beech forests were found on soils with pH (H
2
O) values be-
tween 3.2 and 7.3 and base saturations from 3.3 to 99.9%, cor-
responding to (Ca + K + Mg)
ex
pools of 0.4 to 60.5 mol m
−2
10 cm
−1
.TheC/N ratio of the mineral soil varied between 14
and 36 mol mol
−1
. Even more impressive is the very broad
range of plant-available P pools in the mineral topsoil (11–
1287 mol P m
−2
10 cm
−1
). On the other hand, beech can
tolerate acidic soils with Al
ex
pools as large as 9.5 mol m
−2
10 cm
−1
, while calcareous soils contain only traces of ex-
changeable Al.
A strength of this study is that, in contrast to the majority of
other forest nutrition studies, both the mineral soil and the or-
ganic layer were analysed. The latter is an important medium
of fine root growth in acidic beech forests. On many bedrock
types, marked differences between the mineral soil top horizon
(0–10 cm) and the organic layer were found with respect to soil
acidity, C/N ratio and nutrient concentrations. At least in the
366 C. Leuschner et al.
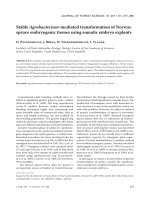
Figure 4. Plot showing the distribution of the 50 beech forests on 6 geological substrate types in PCA axes 1 and 2 together with 5 chemical
variables of mineral soil and organic layer (N
t
/P
t
ratio, organic matter dry mass and total Ca + Mg + K pool of the organic layer, total N and
exchangeable pool of Ca + Mg + K in 0–10 cm of the mineral soil). Vector length and angle are proportional to the direction and degree of
their correlation with the plot ordination scores. Eigenvalues first axis: 0.474, second axis: 0.284; loadings of variables: (Ca + Mg + K)
ex
: 0.80,
C/N: –0.87, N/P: –0.73, (Ca + Mg + K)
t
: 0.86, organic matter: 0.77.
acidic soils with a large portion of tree fine roots being concen-
trated in the organic layer, a soil chemical characterisation has
to include the organic layer in order to be ecologically mean-
ingful. As is demonstrated by the more or less uniform C/N
ratio of the organic layer in our sample, analyses in the min-
eral soil alone would have indicated larger differences among
the sites than do actually exist in the main rooting horizon.
A major disadvantage of our study is the lack of appropriate
data on N availability in the soils. Although N mineralization
rate was measured in several stands, a complete data set for all
50 sites (and 250 locations) could not yet be provided. There-
fore, nitrogen (and, in part of the sites, phosphorus) availability
can only be estimated from C/N, N/P, N
t
and P
t
data. This pro-
cedure is justified for Northwest German forest soils by the
methodological study of Kriebitzsch [17]. Nevertheless, the
respective results must be interpreted with caution.
4.3. Role of the organic layer in beech forest nutrition
In our sample, very large differences in the depth of the
organic layer on top of the mineral soil (ectorganic layer sensu
Emmer [7]) were found: Some limestone sites with vermimull
had virtually no permanent organic layer because the leaf litter
was decomposed (or dislocated) within periods of less than
12 months. In contrast, the two beech stands on highly acidic
fluvioglacial sands (plFS) had up to 10 cm thick mor layers
with distinct organic L, F and H horizons.
The steep gradient in organic layer thickness and C pool
size across the bedrock types cannot be explained neither by
differences in annual leaf litter mass, nor in leaf litter nitro-
gen content which both have a large influence on litter de-
composition rate [3, 23, 38]. With values in the range of 295
to 391 g d.m.m
−2
y
−1
annual leaf litter mass was remarkably
constant among the studied beech forests [21]. Even more sur-
prising is the finding of Meier et al. [21] that the annual N
return via leaf litter mass was more or less similar among the
stands as well despite large differences in soil chemical prop-
erties. This observation is in line with the results of this study
which show only minor variation in the C/N ratio of the or-
ganic layer in the 50-stand sample and, consequently, indicate
no significant influence of the humus N content on total mass
and turnover of organic matter on the forest floor.
Our correlation analysis showed that the largest influence
on organic matter accumulation on top of the soil was not ex-
erted by chemical properties of the organic layer itself. Instead,
the pool of exchangeable aluminium (Al
ex
) in the mineral top-
soil was found to be the single most influential factor showing
a very close relation (r
2
= 0.82, p < 0.001) to organic mat-
ter mass. Much less influential were base saturation and the
C/N ratio of the mineral soil, whereas pH had no effect at all.
These results exclude leaf litter supply rate and litter N content
Nutrient availability in Fagus sylvatica forests 367
as possible causes for the different rates of C accumulation in
the organic layer.
Based on these results and on additional data on fine root
biomass [20] and macro- and meso-fauna activity [32] in
beech forests on acidic and basic soils, we propose the fol-
lowing hypothetical explanation for site differences in organic
matter accumulation on top of the soil.
First, litter derived from dying fine roots may be as rele-
vant as, or even more important than, leaf litter as a source
of soil organic matter [28]. This is suggested by the fact that
roots were densely present in the forest floor on the acidic
sites, but almost absent in the forest floor of the more fertile
sites. Leuschner [19] concluded that the thick organic layers
of beech forests on acidic soils represent feedback systems
in which growing organic layers attract more tree fine roots,
which deliver increasing amounts of C and nutrients to this
compartment and thus further enhance its growth in thickness.
In fact Leuschner and Hertel [20] concluded from a meta-
analysis that the amount of beech fine root biomass in the
organic layer increases with decreasing soil pH, thereby pre-
sumably contributing to an increase in organic layer thickness.
High densities of roots and associated mycorrhizal fungi may
also contribute to humus accumulation by depleting available
nutrients that could alternatively be consumed by free sapro-
phytic microorganisms during the decomposition process [10].
Second, other factors than litter N content might be respon-
sible for a lower decomposition rate in acidic beech forest
soils. Although relevant data are not existent for our beech for-
est sample, contents of lignin and other polyphenols in beech
leaf and root litter could be higher in acidic than in basic soils
which would slow down decomposition. By influencing de-
composition, plants can feedback on nutrient cycles and soil
properties in a manner that may be favourable for their fit-
ness [36]. In addition, we observed substantially smaller C/P,
C/Ca and C/Mg ratios in the organic layer of acidic beech
forests as compared to basic sites (Tab. II) which could fur-
ther reduce the activity of decomposing organisms [27].
Third, humus material also disappears from the organic
layer by the burying activity of the soil macro- and meso-fauna
which is generally less abundant in acidic forest soils [30].
Thus, thin organic layers could in part be the consequence of
a high density of earthworms and other deep-dwelling animals
which are favoured by high Ca and low Al contents of the
soil [1]. The strong dependence of organic layer mass on min-
eral soil Al content in our study may indicate that elevated
aluminium contents negatively influence the activity of soil
organisms that foster decomposition or dislocation of organic
substances in the organic layer.
We suggest that most likely more than one factor is respon-
sible for the striking differences in C accumulation on top of
beech forest soils. Processes or properties that control organic
matter decomposition or dislocation, but that are not related to
N content, must play a key role in our study. It may well be
that N has lost its key influence on decomposition rate in Cen-
tral European beech forests in the past decades which have
experienced increasing atmospheric N inputs during the last
50 years. N deposition may have levelled off former differ-
ences in the C/N ratio and the chemical properties of the or-
ganic layer material. Nevertheless, the organic layer is most
likely fulfilling important functions in the nutrition of beech
forests on acidic soils, in particular with respect to N and P.
Acknowledgements: We wish to thank Uta Nüsse-Hahne and Ute
Schlonsog for support with the laboratory analyses, and two anony-
mous reviewers for their valuable comments.
REFERENCES
[1] Ammer S., Makeschin F., Effects of simulated acid precipitation and
liming on earthworm fauna (Lumbricidae, Oligochaeta) and humus
type in a mature stand of Norway spruce (Höglwald experiment),
Forstwiss. Centralbl. 113 (1994) 70–85.
[2] Arbeitskreis Standortskartierung in der Arbeitsgemeinschaft
Forsteinrichtung, Forstliche Standortsaufnahme, 5th ed., IHW,
Eching, 1996.
[3] Berg B., Litter decomposition and organic matter turnover in north-
ern forest soils, Forest Ecol. Manage. 133 (2000) 13–22.
[4] Berger T.W., Neubauer C., Glatzel G., Factors controlling soil car-
bon and nitrogen stores in pure stands of Norway spruce (Picea
abies) and mixed species stands in Austria, For. Ecol. Manage. 159
(2002) 3–14.
[5] Bowman R.A., Cole C.V., An exploratory method for fractionation
of organic phosphorus from grassland soils, Soil Sci. 25 (1978) 95–
101.
[6] Bundesministerium für Ernährung, Landwirtschaft und Forst
(BMELF), Bundesweite Bodenzustandserhebung im Wald (BZE):
Arbeitsanleitung, 2nd ed., BMELF, Bonn, 1994.
[7] Emmer I.M., Humus form and soil development during a primary
succession of monoculture Pinus sylvestris forests on poor sandy
substrates, Thesis University of Amsterdam, 1995.
[8] Evers F.H., Forest fertilization: Present state and history with spe-
cial reference to South German conditions, Fert. Res. 27 (1991)
71–86.
[9] Flaig H., Mohr H., Effects of high ammonium supply in Scots pine-
seedlings (Pinus sylvestris L.), Allg. Forst- u. Jagdztg. 162 (1991)
35–42.
[10] Gadgil R.L., Gadgil P.D., Suppression of litter decomposition by
mycorrhizal roots of Pinus radiata, N.Z. J. For. Sci. 5 (1975) 33–41.
[11] Gönnert T., Ökologische Bedingungen verschiedener Laubwald-
gesellschaften des Nordwestdeutschen Tieflandes, Gebrüder
Borntraeger, Stuttgart, 1989.
[12] Green R.N., Trowbridge R.L., Klinka K., Towards a taxonomic clas-
sification of Humus Forms, For. Sci. Monogr. 29 (1993) 1–49.
[13] Hantl M., Charakterisierung des Säure-Basen-Status und Erfassung
substratspezifischer Vorräte von Waldstandorten unterschiedlicher
geologischer Ausgangssituationen. Berichte Forschungszentrum
Waldökosysteme, Univ. Göttingen, A75, 1–175.
[14] Härdtle W., Von Oheimb G., Friedel A., Meyer H., Westphal C.,
Relationship between pH-values and nutrient availability in forest
soils – the consequences for the use of ecograms in forest ecology.
Flora 199 (2004) 134–142.
[15] Jenny H., Factors of soil formation: a system of quantitative pedol-
ogy, McGraw-Hill, New York, 1941.
[16] Koerselman W., Meuleman A.F.M., The vegetation N/Pratio:anew
tool to detect the nature of nutrient limitation, J. Appl. Ecol. 33
(1996) 1441–1450.
[17] Kriebitzsch W U., Stickstoffnachlieferung in sauren Waldböden
Nordwest-deutschlands, Scripta Geobot. 14 (1978) 1–66.
[18] Leuschner C., Zur Abhängigkeit der Baum- und Krautschicht mit-
teleuropäischer Waldgesellschaften von der Nährstoffversorgung
des Bodens, Ber. Reinh. Tüxen-Ges. 11 (1999) 109–131.
368 C. Leuschner et al.
[19] Leuschner C., Forest succession and water resources: soil hydrol-
ogy and ecosystem water turnover in early, mid and late stages of
a 300-y-long chronosequence on sandy soil, in: Dohrenbusch A.,
Bartsch N. (Eds.), Forest Development, Succession, Environmental
Stress and Forest Management, Springer Verlag, Berlin, 2002,
pp. 1–68.
[20] Leuschner C., Hertel D., Fine root biomass of temperate forests in
relation to soil acidity and fertility, climate, age and species, Prog.
Bot. 64 (2003) 405–438.
[21] Meier I.C., Leuschner C., Hertel D., Nutrient return with leaf litter
fall in Fagus sylvatica forests across a soil fertility gradient, Plant
Ecol. 177 (2005) 99–112.
[22] Meiwes K.J., König N., Khanna P.K., Prenzel J., Ulrich
B., Chemische Untersuchungsverfahren für Mineralboden,
Auflagehumus und Wurzeln zur Charakterisierung und Bewertung
der Versauerung von Waldböden, Berichte des Forschungszentrums
Waldökosysteme/Waldsterben 7 (1984) 1–67.
[23] Melillo J.M., Aber J.D., Muratore J.F., Nitrogen and lignin control
of hardwood leaf litter decomposition dynamics, Ecol. 63 (1982)
621–626.
[24] Murphy J., Riley J.P., A modified single-solution method for de-
termination of phosphate in natural waters, Anal. Chim. Acta 27
(1962) 31–36.
[25] Muys B., The influence of tree species on humus quality and nutri-
ent availability on a regional scale (Flanders, Belgium), in: Nilsson
L.O., Hüttl R.F., Johansson U.T. (Eds.), Nutrient uptake and cycling
in forest ecosystems, Kluwer Acad. Publ., The Netherlands, 1995,
pp. 649–660.
[26] Pinto P.E., Gégout J C., Assessing the nutritional and climatic re-
sponse of temperate tree species in the Vosges Mountains, Ann. For.
Sci. 62 (2005) 761–770.
[27] Raubuch M., Beese F., Patterns of microbial indicators in forest
soils along an European transect, Biol. Fertil. Soils 19 (1995) 362–
368.
[28] Raulund-Rasmussen K., Vejre H., Effect of tree species and soil
properties on nutrient immobilization in the forest floor, Plant Soil
168–169 (1995) 345–352.
[29] Rehfuess K.E., Waldböden, Entwicklung, Eigenschaften und
Nutzung, 2nd ed., Parey, Hamburg, 1990.
[30] Schaefer M., Schauermann J., The soil fauna of beech forests –
comparison between a mull and a moder soil, Pedobiologia 34
(1990) 299–314.
[31] Schmidt W., Untersuchungen über die Phosphorversorgung nieder-
sächsischer Buchenwaldgesellschaften, Scripta Geobot. 1 (1970)
1–120.
[32] Scheu S., Falca M., The soil food web of two beech forests (Fagus
sylvatica) of contrasting humus type: stable isotope analysis of
a macro- and a mesofauna-dominated community, Oecologia 123
(2000) 285–296.
[33] Sibbesen E., A simple ion-exchange resin procedure for extracting
plant-available elements from soil, Plant Soil 46 (1977) 665–669.
[34] ISSS-ISRIC-FAO, World Reference Base for Soil Resources,
Rome, 1998.
[35] Teissier du Cros E. (Ed.), Le Hêtre, INRA, Paris, 1981, 613 p.
[36] Van Breemen N., Nutrient cycling strategies, Plant Soil 168–169
(1995) 321–326.
[37] Vesterdal L., Raulund-Rasmussen K., Forest floor chemistry under
seven tree species along a soil fertility gradient, Can. J. For. Res. 28
(1998) 1636–1647.
[38] Vitousek P.M., Hobbie S., Heterotrophic nitrogen fixation in
decomposing litter: patterns and regulation, Ecol. 81 (2000)
2366–2376.
To access this journal online:
www.edpsciences.org