Báo cáo lâm nghiệp: "Response to an ozone gradient of growth and enzymes implicated in tolerance to oxidative stress in Acer saccharum (Marsh.) seedlings" pot
Bạn đang xem bản rút gọn của tài liệu. Xem và tải ngay bản đầy đủ của tài liệu tại đây (672.16 KB, 11 trang )
Ann. For. Sci. 63 (2006) 387–397 387
c
INRA, EDP Sciences, 2006
DOI: 10.1051/forest:2006019
Original article
Response to an ozone gradient of growth and enzymes implicated in
tolerance to oxidative stress in Acer saccharum (Marsh.) seedlings
Catherine G
a,b
*
,NadineC
c
,PaulW
c
, Jean Pierre R
d
,
Pierre D
b
,YvesM
a
, Normand C
a
a
GREFi, Département des Sciences Biologiques, Université du Québec à Montréal, C.P. 8888, Succ centre-ville, Montréal, Canada H3C 3P8
b
Écologie et Écophysiologie Forestières, UMR 1137 INRA-UHP Nancy 1, BP 239, 54506 Vandoeuvre, France
c
Department of Biology, Concordia University, 1455 West, de Maisonneuve, Montréal, Canada H3G 1M8
d
Centre de recherches Acéricoles-MAPAQ, 1140 rue Taillon, St Foy, Canada G1N 3T9
(Received 3 June 2005; accepted 12 October 2005)
Abstract – Two-year-old sugar maple (Acer saccharum Marsh.) seedlings were exposed in open top chambers to an extensive gradient of O
3
(0 to
300 nL.L
−1
) during 85 days under two light environments (20% and 80% of full sun at noon on a sunny day). The growth of truncated seedlings
(with one flush of leaves) and episodic seedlings (with two flushes) was decreased as O
3
increased, especially the growth of the second flush which
developed under the oxidative treatment. Visible leaf injuries developed during the season under high O
3
concentrations. Survivalist growth strategy
of sugar maple, as seen by the root/shoot ratio, together with the enzymatic stimulations of glucose 6-phosphate dehydrogenase, phosphoenolpyruvate
carboxylase and glutathione reductase allowed the seedlings to tolerate the O
3
doses. However, at the end of the season, the cumulative oxidative stress
in the second flush of the episodic seedlings exposed to concentrations over 150 nL.L
−1
O
3
was too large and exceeded the capacity of seedlings for
detoxification and repair.
carboxylation / detoxification / growth / oxidative stress / sugar maple seedlings
Résumé – Réponse de la croissance et des enzymes impliquées dans la tolérance au stress oxydatif chez des semis d’érable à sucre Acer
saccharum (Marsh.) exposés à un gradient d’ozone. Des semis d’érable à sucre (Acer s accharum Marsh.) de deux ans sont exposés en chambre
à ciel ouvert à un large gradient d’O
3
(0 to 300 nL.L
−1
) pendant 85 jours sous deux environnements lumineux (20 ou 80 % de plein soleil, journée
ensoleillée à midi). Avec l’augmentation des concentrations d’O
3
, on observe une réduction de la croissance des semis ayant un ou deux flushs de
feuilles. La réduction de croissance est particulièrement importante pour le deuxième flush de feuilles qui se développe pendant le traitement. Des
dommages foliaires apparaissent durant la saison et sous fortes concentrations d’O
3
. La stratégie de croissance de survie de l’érable à sucre, montré par
le rapport racine/tige, de même que les stimulations enzymatiques de la glucose 6-phosphate déhydrogenase, la phosphoénolpyruvate carboxylase et
la glutathion réductase permettent une tolérance aux doses d’O
3
reçues. Cependant, à la fin de la saison, le stress oxydatif cumulatif dans le deuxième
flush des semis exposés à des concentrations d’O
3
supérieures à 150 nL.L
−1
est trop fort et excède la capacité de détoxification et réparation des semis.
carboxylation / detoxification / croissance / stress oxydatif / érable à sucre
1. INTRODUCTION
Tropospheric ozone is one of the most damaging phytotoxic
pollutants [24], and annual biomass losses of forest species
can reach 33% depending on the species and the O
3
concen-
tration [20]. O
3
is formed by the photochemical reaction be-
tween anthropogenic and biogenic nitrogen oxides (NOx), and
volatile organic compounds (VOCs) in polluted air masses.
In contrast to other gaseous anthropogenic pollutants such
as SO
2
, tropospheric O
3
concentration is increasing, proba-
bly due to the increase in the levels of NO
x
and VOC emis-
sions [21]. Increase in global tropospheric O
3
concentration
during the 21st century was projected by a range of global
emission scenarios studied by the IPCC 2001 assessment. In
the northern hemisphere, near-surface O
3
concentrations are
estimated to be increase by about 5 ppb by 2030 and about – 4
to over 20 ppb by 2100, depending on the scenarios [40].
* Corresponding author:
Over the last several decades, surface O
3
concentrations
have been closely monitored in North America by the US
Environmental Protection Agency and Environment Canada.
The Windsor-Québec region (along the St-Laurence River,
Québec, Canada) receives high O
3
concentrations from the
large industrial and urban regions of the Great Lakes [15].
Several studies have already reported that during the summer,
hourly ozone episodes frequently reach 150 nL.L
−1
, with max-
imum values of 200 nL.L
−1
[15,44,55].
Sugar maple (Acer saccharum Marsh.) is found extensively
in the Windsor-Québec region and is of major economic im-
portance for the production of timber and sap. It is a shade
tolerant, slow growing species [3]. Mature sugar maple trees
have been described as a fixed growth species but young and
vigorous sugar maple seedlings may have an episodic growth
strategy with production of a second flush of leaves [6,18].
Following management of sugar maple stands, sugar maple
seedlings may be exposed to contrasting light regimes [54]. In
Article published by EDP Sciences and available at or />388 C. Gaucher et al.
plantations, seedlings can be exposed to high irradiance lev-
els [57, 59]. Asthon et al. [1] have reported that the leaves
of young maple seedlings have a great capacity to adapt to
different irradiance environments. Topa et al. [52] reported
that leaves grown in shade show a greater susceptibility to
O
3
than leaves grown in higher light environments, which is
mainly due to the structural differences of the sun and shade
leaves [2,58].
Several studies have shown that sugar maple can be affected
by O
3
[7,26,51,52], although it has been classified as a tolerant
species to O
3
[30,35,41]. No significant effect on growth was
observed in sugar maple seedlings after an exposure to 2 times
ambient O
3
over two growing seasons (seasonal 24-h mean in
air-ambient was 31 ppb O
3
and 66 ppb O
3
in 1990 and 1991
respectively; [42]). Similarly, Laurence et al. [30] found that
gas exchange parameters were not affected by O
3
after an ex-
posure to 2 times ambient concentration during three growing
seasons. However, decreases in biomass accumulation, pho-
tosynthetic rate and Rubisco content have been observed in
response to higher O
3
concentrations (200 nL.L
−1
during 61
days, [16]).
The increased activity of the ascorbate-glutathione detoxi-
cation pathway and an increased concentration of antioxidants
contribute to the scavenging of toxic oxygen species derived
from ozone [14, 36, 37]. Catabolic pathways such as dark res-
piration, glycolysis and the pentose phosphate pathway have
been reported to show increased activity under oxidative stress
in some tree species [9,10,12,16,45].
We still lack knowledge on the tolerance of sugar maple
to O
3
and on the detoxification and repair capacities of sugar
maple seedlings under an extensive gradient of O
3
in contrast-
ing light environments. Thus, the aim of this study was to eval-
uate (1) the growth and (2) the response of major enzymes of
the catabolic pathways of sugar maple seedlings exposed to an
extensive gradient of O
3
, from 0 to 300 nL.L
−1
.
2. MATERIAL AND METHODS
2.1. Growth of the seedlings
and fumigation treatments
One hundred and forty four sugar maple (Acer saccharum Marsh.)
seedlings (two years old) were potted in early May of 1996 in 16
L pots (the soil came from a nearby maple stand: sandy loam with
more than 10% organic matter). All the seedlings were from the
Berthierville Nursery (Ministère des Ressources Naturelles, Québec,
Canada). On May 29, after the development of the first flush of leaves,
seedlings were equally distributed into 6 open-top chambers. The
chambers used were similar to those described by Heagle et al. [19]
(without a rain cap) and were located at the Centre de Recherche
Acéricole du MAPAQ in Tingwick, approximately 200 km east of
Montréal (45
◦
54’ N and 71
◦
57’ W). Each chamber represented one
of the 6 O
3
concentrations used in the gradient: (1) 0 nL.L
−1
O
3
;(2)
50 nL.L
−1
O
3
; (3) 100 nL.L
−1
O
3
; (4) 150 nL.L
−1
O
3
; (5) 200 nL.L
−1
O
3
; (6) 300 nL.L
−1
O
3
. Measured mean O
3
concentration in each
chamber was 1± 2.46 nL.L
−1
O
3
,46± 12 nL.L
−1
O
3
, 100± 19 nL.L
−1
O
3
, 149 ± 15 nL.L
−1
O
3
, 199 ± 21 nL.L
−1
O
3
, 293 ± 27 nL.L
−1
O
3
respectively. Ozone treatments were administered from 6 a.m. to 8
p.m. for the entire growing season. The air entering the chambers was
filtered with activated charcoal to remove pollutants prior to ozone
enrichment. The ventilation rate was ∼ 85 m
3
.min
−1
.O
3
concentra-
tions were measured hourly in the centre of the chamber. Hourly con-
trol and feedback adjustments of the O
3
level were made using two
UV-photometric O
3
analysers (Monitor labs Inc., model 8810, En-
glewood, Colorado) linked to a datalogger (Campbell scientific Inc.,
model CR10, Edmonton, Alberta). Ozone was generated from dried
ambient air using an OREC auto control ozonator (Ozone research &
Equipment Corporation, model 03SP38-ARW, Phoenix, AZ, USA)
linked to the datalogger for feedback control. During the night, fil-
tered air entered the chambers. Preliminary tests did not show any
significant NOx increase in the out coming air. A more complete de-
scription of the chambers can be found in Renaud et al. [43].
To create contrasting light conditions, a neutral-density shade
cloth was hung over half the area of each chamber. The irradi-
ance was measured using a quantum sensor (Li-190SA, Li-COR,
Lincoln, Neb.). At noon on a sunny day, the irradiance was 20%
(350 µmol.m
−2
.s
−1
) and 80% (1500 µmol.m
−2
.s
−1
) of the sunlight in-
tensity measured in the field, for the low and high light treatments
respectively.
2.1.1. Morphological types of seedlings
Sugar maple is often considered to be a fixed growth species, char-
acterized by an entirely preformed shoot in the bud [25]. However,
young seedlings, saplings, and young and vigorous branches of ma-
ture sugar maple may have an episodic growth pattern [6, 18, 48]
In this study, budbreak occurred in mid May prior to setting
the seedlings into the chambers. The two seasonal patterns of
shoot growth were observed among the seedlings. Two-third of the
seedlings had a “truncated” shoot growth pattern similar to that de-
scribed by Canham et al. [6] as a “cessation of aboveground growth
early in the growing season”. These seedlings with one leaf flush
will be referred to as “truncated” seedlings. The other third of the
seedlings had an “episodic” growth strategy [6]: once in the cham-
bers, a second flush of leaves occurred between the end of June and
the end of July. These seedlings with two flushes will be referred to
as “episodic” seedlings. The first flush of leaves will be hereafter re-
ferred to as the preformed flush, consisting of preformed leaves and
the second flush as neoformed flush consisting of neoformed leaves
as described by Gregory [18].
2.1.2. Harvesting of seedlings
Seedlings were randomly harvested from each chamber and each
light treatment on June 28 (31 days of O
3
treatment), July 25 (57 days
of O
3
treatment) and August 22 (85 days of O
3
treatment). Harvesting
started at 13 h:00 and was completed within 4 h.
At days 31 and 57, we collected two truncated seedlings per cham-
ber per light treatment for a total of 24 seedlings. A sub-sample from
a single leaf for each seedling was used for in vivo measurement of ni-
trate reductase (NR) activity and another sub-sample was oven-dried
at 65
◦
C for 4 days and weighed to determine water content. The rest
of the leaves were immediately set on dry ice and kept at –80
◦
Cfor
future enzymatic analysis.
At day 85, we collected two “truncated” seedlings per treatment
per chamber and two episodic seedlings per treatment per chamber
Response of Acer saccharum to an O
3
gradient 389
when available. The cumulative effects of O
3
on the biomass were
analyzed at this date. The two types of seedling were analyzed sepa-
rately. Seedlings were immediately divided into roots, stems + peti-
oles and leaves, which were weighed separately to estimate their fresh
weight. The leaves and stems of the episodic seedlings were divided
according to the different flushes. The projected leaf area of every leaf
was measured using an area meter (Delta-T devices, Cambridge, Eng-
land). Shoot length was measured in cm from root collar to terminal
bud for truncated seedlings. For episodic seedlings, total shoot length
was separated into two parts: from root collar to the last bud scar
(previous year’s growth + spring growth) and from bud scar to ter-
minal bud (second flush of growth). The whole root, the whole stem
of each flush and a sub-sample of preformed and neoformed leaves
were oven-dried at 65
◦
C for 4 days and weighed to determine water
content. A sub-sample from a single leaf was used for the measure-
ment of in vivo NR activity. The rest of the leaves were immediately
set on dry ice and kept at –80
◦
C for future enzymatic analysis.
2.2. Evaluation of visible foliar injury
Rapid visible foliar injury evaluations were done at day 57 and
day 85. A 20% scale (O–20%; 21–40%; 41–60%; 61–80%; 81–
100%) was used to evaluate the percentage of symptomatic leaves
per seedling. We considered that a leaf was symptomatic if at least
2% of his area was injured.
2.3. Enzymatic analysis
2.3.1. In vivo nitrate reductase assay
At the field site, in parallel with the harvests and at all sam-
pling dates, NR (E.C. 1.6.6.1.) activity was measured according to
the method of Jaworski et al. [22] as modified by Truax et al. [53].
One hundred mg fresh weight of material from a single leaf was sam-
pled from each flush of each seedling, cut into 2 × 2 mm pieces and
incubated in 5 mL of 100 mM phosphate buffer (pH 7.5) containing
40 mM KNO
3
and 1.5% 1-propanol. Each sample was vortexed for
2 min to help tissue infiltration by the incubation solution. The test
tubes were sealed and incubated for 1 h at 30
◦
C. A blank contain-
ing one hundred mg fresh weight of leaf material without KNO
3
was
prepared for each sample. The reaction was stopped by immersing
the tubes for 5 min in boiling water. The colorimetric determination
of NO
2
−
was done by mixing 0.25 mL of incubation medium with
0.25 mL 0.02% N-(1-Naphtyl) ethylenediamine and 0.25 mL of sul-
fanilamide. After 30 min, the absorbance was read at 540 nm.
2.3.2. Enzyme extraction
A sub-sample of frozen leaf tissue (200 mg FW) was ground
to a fine powder in liquid nitrogen using a mortar and pestle.
The leaf powder was extracted with 4 mL of cold (4
◦
C) 0.1 M
Hepes-KOH buffer (pH 7.5) containing 7% (w/w) polyethylene gly-
col 20 000, 2 mM dithiothreitol, 5 mM MgCl
2
, 5 mM ethylene
glycol-bis-(ß-aminoethyl ether)-N,N,N’,N’-tetra acetic acid, 10%
(v/v) glycerol, 1 mM phenylmethylsulfonyl fluoride, 9% (w/v) insol-
uble polyvinylpyrrolidone 25 000. The homogenate was centrifuged
at 8800 × g for 10 min at 4
◦
C. The supernatant was collected and
used as a crude enzyme extract for the determination of total Rubisco,
PEPC, G6PDH and GR activities.
2.3.3. Enzyme assays
Total ribulose 1,5-bisphosphate carboxylase oxygenase (Rubisco,
E.C. 4.1.1.39) activity was measured spectrophotometrically at
340 nm in a coupled reaction at 30
◦
C according to the method
of Lilley and Walker [31] as modified by Van Oosten et al. [56].
The assay medium consisted of 100 mM bicine buffer (pH 8) con-
taining 20 mM MgCl
2
,25mMNaHCO
3
, 3.5 mM ATP, 0.25 mM
NADH, 3.5 mM phospho-creatine, 80 nkat creatine phosphokinase
(E.C. 2.7.3.2), 80 nkat 3-phosphoglycerate kinase (E.C. 2.7.2.3),
80 nkat glyceraldehyde 3-phosphate dehydrogenase (E.C. 1.2.1.12)
and 30 µL crude extract in a final volume of 600 µL. The mixture
was pre-incubated for 15 min at 30
◦
C and 0.5 mM ribulose 1,5-
bisphosphate (RuBP) was added to start the reaction. A control with-
out RuBP was prepared for each assay.
Phosphoenolpyruvate carboxylase (PEPC, E.C.4.1.1.31) activity
was assayed by monitoring the decrease in absorbance at 340 nm in
an assay system coupled with malate dehydrogenase (E.C. 1.1.1.37)
at 30
◦
C. The assay medium was based on that of Tietz and Wild [50]
and consisted of 112.5 mM Tris-HCl buffer (pH 8.5) containing 5 mM
MgCl
2
, 5 mM NaHCO
3
, 0.2 mM NADH, 2 mM glucose 6-phosphate,
3U/mL malate dehydrogenase and 30 µL crude extract in a final
volume of 600 µL. The reaction was initiated by adding 4.4 mM
phosphoenolpyruvate. The reference assay did not contain phospho-
enolpyruvate.
Glucose 6-phosphate dehydrogenase (G6PDH, E.C. 1.11.49) ac-
tivity was assayed at 30
◦
C by monitoring the increase in absorbance
at 340 nm using a modification of the method of Pitel and Che-
liak [39]. The assay medium contained 50 mM Hepes buffer (pH 7.6),
10 mM MgCl
2
, 300 µM NADP
+
and 30 µL crude extract in a final
volume of 600 µL. The reaction was initiated by adding 2 mM glu-
cose 6-phosphate. A control without glucose 6-phosphate was used
for each assay.
Glutathione reductase (GR, E.C. 1.6.4.2) was assayed according
to the procedure of Smith et al. [46]. The assay was performed at
34
◦
C in a final reaction volume of 1 mL containing 0.1 M K-
phosphate buffer (pH 7.5), 0,5 mM EDTA, 0,75 mM 5,5’-dithiobis
(2-nitrobenzoic acid) (DTNB), 0.1 mM NADPH and 25 µLofen-
zyme extract. The reaction was initiated by the addition of 2 mM
GSSG. The formation of GSH was followed by the increase of A
412
(ε = 7.2mM
−1
.cm
−1
). Soluble proteins in crude extracts were as-
sayed using the Bio-Rad DC method. Enzymatic extracts were pre-
cipitated with 20% TCA for 10 min at 4
◦
C and centrifuged at
8800 × g for 10 min. The pellets were dissolved in 1 N NaOH. En-
zyme activities were expressed in nkat mg
−1
protein.
2.4. Measurement of total phenolic compounds
Leaf powder (120 mg DW from the oven-dried leaf sub-sample
used for water content determination) was homogenized in 4 mL of
50% (v/v) ethanol. The homogenate was incubated at 40
◦
Cfor3h
and centrifuged at 8800 × g for 10 min at room temperature. The su-
pernatant was recovered and evaporated to dryness under a stream
of nitrogen. The residue was resuspended in 3 mL distilled water
and the phenol content was assayed colorimetrically using the Folin-
Denis reagent as described by Swain and Hillis [49]. Total phenolic
compounds were determined by comparison with a standard curve
generated with tannic acid as a reference.
390 C. Gaucher et al.
Table I. Summary of the regression analysis between diff
HL−LL
for the biomass of leaves, stems and roots (g DW), foliar surface (cm
2
), specific
leaf mass (SLM, g/Mm
2
), height (cm), root/shoot ratio and O
3
concentration (nL.L
−1
) after 85 days of treatment.
Seedlings with one flush
Diff
HL−LL
Parameter estimates (prob>|t|) R
2
I
†
B
†
Slope Intercept
Leaves 0.070 0.470 0.58 0.4092 –0.00728
Foliar surface 0.433 0.528 0.16 4.8251 –0.03665
SLM 0.75 0.80 0.03 –2.4840 –0.01919
Stems 0.057 0.250 0.64 1.2956 –0.01541
Height 0.185 0.532 0.39 5.6857 –0.08140
Roots 0.050 0.134 0.66 3.5493 –0.03160
Root/shoot 0.182 0.177 039 0.3404 –0.00202
Seedlings with two flushes
diff
HL−LL
Parameter estimates (prob>|t|) R
2
I
†
B
†
Slope Intercept
First flush Leaves 0.988 0.929 8.10
−5
–0.1364 0.00012
Foliar surface 0.692 0.818 0.06 –2.4027 0.02314
SLM 0.317 0.441 0.32 –1.465 1.0980
Stems 0.790 0.710 0.03 –0.6696 0.00263
Height 0.774 0.858 0.03 –2.3500 0.02100
Second flush Leaves 0.625 0.779 0.09 0.2074 –0.00203
Foliar surface 0.394 0.357 0.25 8.8002 –0.04462
SLM 0.627 0.878 0.09 –4.4760 0.0802
Stems 0.863 0.707 0.01 –0.1192 –0.00030
Height 0.698 0.962 0.06 –0.4625 –0.02125
Roots 0.322 0.411 0.32 1.7093 –0.01178
Root/shoot 0.688 0.727 0.06 –0.1933 –0.00125
†
Diff
HL−LL
= I + B(O
3
), where I is the intercept, B is the slope and O
3
is the O
3
concentration (nL.L
−1
).
2.5. Statistical analyses
We established the influence of the light regimes on the re-
sponses of the different variables tested (biomass parameters, Ru-
bisco, G6PDH, PEPC, GR and NR activities, soluble protein content,
total phenolic compounds) to the ozone gradient. We calculated the
difference between the value of a variable under high light and low
light; the difference was reported as “diff
HL−LL
” at each concentration
of the O
3
gradient and at each harvest date. We then completed a se-
ries of regression analyses using O
3
as an independent variable and
“diff
HL−LL
” as a dependent variable for each measured parameters.
These analyses showed that the responses of these variables to the
ozone gradient were not different for the two light regimes, except in
2 cases (phenol content and NR activity). In most cases, the slope and
the intercept of the regressions were not different from zero (Tabs. I,
II and III). Therefore, we pooled the data from both light intensities
for the analysis of the effect of the O
3
gradient, except for the phenol
content of the truncated seedlings at day 57, which was significantly
different under low and high light (Tab. II) and the NR activity of
the first flush of the episodic seedlings at day 85, where there was an
interaction between O
3
and light (Tab. III).
We chose the regression approach to assess the quantitative rela-
tionships between our measured variables and the O
3
gradient. With
six levels of ozone, regression is the most powerful way of analyz-
ing the data [47]. A series of linear regressions using the six differ-
ent O
3
concentrations as the independent variable and the pooled data
(biomass parameters, Rubisco, G6PDH, PEPC, GR and NR activities,
soluble protein content, total phenolic compounds) as the dependent
variable were completed at each harvest day. On two occasions data
were not pooled, for the phenol content at day 57 and the NR activ-
ity of the first flush of the episodic seedlings at day 85. On day 85, a
second-order regression was used to examine the response of G6PDH
and PEPC activities, because these data responses were not linear.
All regression analyses were performed using the statistical software
JMP 3 (SAS Institute Inc.) The level of significance was set at 0.05.
3. RESULTS
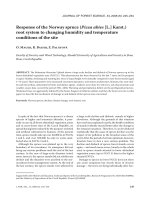
3.1. The effects of light and ozone on biomass
Light treatments had no effect on biomass parameters
(Figs. 1 and 2). Biomass accumulation of leaves, stems, roots
and foliar surface area of the two morphologically differ-
ent groups of seedlings, shoot length of the second flush
of episodic seedlings decreased with increasing O
3
(Figs. 1
Response of Acer saccharum to an O
3
gradient 391
Table II. Summary of the regression analysis between diff
HL−LL
for soluble proteins, Rubisco, GR, G6PDH, PEPC, NR, phenol content and O
3
concentration for seedlings with one flush at each harvest day.
Diff
HL−LL
Day of harvest Parameter estimates (prob>|t|) R
2
I
†
B
†
Slope Intercept
Proteins 31 0.257 0.507 0.30 0.8673 0.00948
57 0.247 0.213 0.31 –3.0503 0.01682
85 0.925 0.804 0.002 0.7933 0.00181
Rubisco 31 0.240 0.395 0.32 –0.3178 0.00278
57 0.697 0.143 0.04 1.1231 0.00156
85 0.307 0.087 0.25 1.6619 –0.00521
GR 31 0.790 0.680 0.02 –0.0315 0.00012
57 0.606 0.148 0.07 0.1069 –0.00020
85 0.959 0.602 0.001 0.0380 –0.00002
G6PDH 31 0.432 0.444 0.16 –0.0976 –0.00061
57 0.267 0.817 0.29 –0.0362 0.00114
85 0.403 0.984 0.18 –0.0024 0.00060
PEPC 31 0.578 0.809 0.08 0.0710 –0.00100
57 0.123 0.099 0.48 0.3182 –0.00175
85 0.957 0.493 0.001 0.0921 –0.0004
NR 31 0.401 0.996 0.18 0.0034 0.00360
57 0.107 0.088 0.52 0.8901 0.00494
85 0.626 0.682 0.06 0.0430 –0.00031
Phenols 31 0.847 0.362 0.014 30.8707 0.03716
57 0.263 0.025 0.30 36.9461 –0.08331
85 0.770 0.682 0.05 –31.7380 0.11430
†
Diff
HL−LL
= I + B(O
3
), where I is the intercept, B is the slope and O
3
is the O
3
concentration (nL.L
−1
).
Table III. Summary of the regression analysis between diff
HL−LL
for soluble proteins, Rubisco, GR, G6PDH, PEPC, NR, phenol content and
O
3
concentration for the heterophyllous seedlings after 85 days.
Diff
HL−LL
Flush Parameter estimates (prob>|t|) R
2
I
†
B
†
Slope Intercept
Proteins First 0.173 0.175 0.51 6.7360 –0.03758
Second 0.776 0.794 0.03 1.0680 –0.00646
Rubisco First 0.286 0.666 0.36 0.3482 –0.00524
Second 0.404 0.455 0.24 0.9658 –0.00608
GR First 0.289 0.970 0.35 –0.0042 0.00075
Second 0.280 0.293 0.52 0.2680 –0.00206
G6PDH First 0.328 0.652 0.31 –0.1620 0.00210
Second 0.840 0.997 0.01 0.0012 0.00039
PEPC First 0.929 0.850 0.01 –0.0753 –0.00019
Second 0.544 0.464 0.13 –0.1491 –0.00067
NR First 0.020 0.015 0.86 0.1113 0.00050
Second 0.060 0.061 0.88 0.3081 0.00110
Phenols First 0.726 0.472 0.07 30.7590 –0.07544
Second 0.487 0.716 0.26 15.7376 –0.16955
†
Diff
HL−LL
= I + B(O
3
), where I is the intercept, B is the slope and O
3
is the O
3
concentration (nL.L
−1
).
392 C. Gaucher et al.
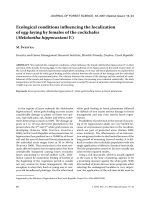
Figure 1. Biomass of leaves, stems, roots (g DW) of the truncated (A,
B, C) and episodic (D, E, F) seedlings after 85 days under increasing
O
3
concentrations (data from first flush grown under low light ()and
high light (), — regression line; data from second flush grown under
low light () and high light (), – – regression line). D: first flush: y =
−0.006x + 3.44, R
2
= 0.36, p = 0.05; second flush: y = −0.0067x +
2.5142, R
2
= 0.77, p < 0.001. E: first flush: y = −0.0104x + 5.8252,
R
2
= 0.47, p = 0.02; second flush: y = −0.0033x+1.0701, R
2
= 0.71,
p = 0.001.
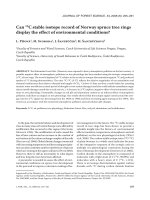
and 2). The specific leaf mass (SLM) of both morphological
types of seedling was not influenced by O
3
(Fig. 2).
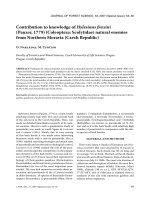
The truncated seedlings allocated a large proportion of their
biomass to the root system (with a root/shoot ratio above one)
whereas the episodic seedlings, which allocated biomass for
the development of the neoformed flush, had a root/shoot ratio
less than one. Irradiance levels did not modify the root/shoot
ratio of either group of seedlings (data not shown), nor did
increasing O
3
level: both shoot growth and root growth de-
creased with increasing O
3
, leading to a constant root/shoot
ratio (Fig. 2).
3.2. Visible leaf injury
The different types of leaf injury usually associated with
O
3
were observed mostly on the first flush. Stipples appeared
Figure 2. Foliar surface per leaf (cm
2
), specific leaf mass per leaf
(SLM, g/m
2
), shoot length (cm), root/shoot ratio of the truncated (A,
B, C, D) and episodic seedlings (E, F, G, H) after 85 days of treatment
under increasing O
3
concentrations (data from first flush grown under
low light () and high light (), — regression line; data from second
flush grown under low light () and high light (), – – regression
line).E:firstflush:y = −0.0572x + 36.667, R
2
= 0.49, p = 0.01;
second flush: y = −0.0852x + 40.18, R
2
= 0.73, p = 0.0007.
uniformly on the upper leaf surface and have a purple-brown
coloration. Some brown bifacial necrotic spots were observed.
At day 57, no foliar injury was observed on seedlings exposed
at 0 and 50 nL.L
−1
O
3
(data not shown). Half of the seedlings
exposed at 200 nL.L
−1
O
3
and 85% of the seedlings exposed
at 300 nL.L
−1
O
3
have more than 80% of symptomatic leaves
(i.e. leaves with at least 2% of leaf area injured). At day 85,
we still did not observe foliar injury on seedlings exposed to 0
and 50 nL.L
−1
O
3.
More than 70% of the seedlings exposed at
200 nL.L
−1
O
3
and 95% of the seedlings exposed at 300 nL.L
−1
O
3
have more than 80% of symptomatic leaves.
Response of Acer saccharum to an O
3
gradient 393
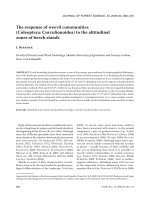
Figure 3. Rubisco activity (nkat.mg prot
−1
) and soluble protein content (mg.gFW
−1
) for the truncated seedlings after 31 days (A, E), 57 days
(B, F) and 85 days (C, G) and the episodic seedlings (D, H) under increasing O
3
concentrations (data from first flush grown under low light ()
and high light (), — regression line; data from second flush grown under low light () and high light (), – – regression line).
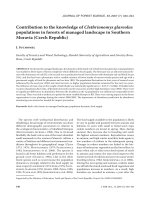
Figure 4. GR activity (µmol GSH.min
−1
.mg prot
−1
) for the truncated seedlings after 31 days (A), 57 days (B) and 85 days (C) and the episodic
seedlings (D) under increasing O
3
concentrations (data from first flush grown under low light () and high light (), — regression line; data
from second flush grown under low light () and high light (), — regression line).
3.3. Effect of light and ozone on enzymatic responses
When the results were expressed on a foliar surface basis
or on a protein basis the same variation in the response to the
treatment was observed. The Rubisco activity of the truncated
seedlings was increased by exposure to O
3
on day 31 but was
not affected by O
3
on days 57 and 85 (Figs. 3A–3C). After
85 days of treatment, the Rubisco activity of the neoformed
flush increased with increasing O
3
(Fig. 3D). The soluble pro-
tein content was constant during the whole growing season and
was not affected by O
3
(Figs. 3E–3H).
The O
3
treatment led to a significant stimulation in the GR
activity of preformed leaves of both seedling types throughout
the growing season (Figs. 4A–4D).
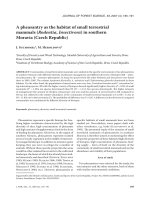
G6PDH activity was highly stimulated by increased O
3
lev-
els at each harvest day (Figs. 5A–5D). However, with time,
the level of activity decreased under the higher concentra-
tions of O
3
: after 85 days, non-linear relationship was signifi-
cant and the activity of G6PDH in the neoformed flush of the
episodic seedlings decreased when O
3
concentration exceeded
150 nL.L
−1
(Fig. 5D).
Anaplerotic fixation of CO
2
by PEPC increased in re-
sponse to O
3
in both groups of seedlings (Figs. 5E–5H) dur-
ing the growing season. The level of activity decreased in
the neoformed flush of the episodic seedlings when the O
3
concentration exceeded 150 nL.L
−1
(Fig. 5H). After 85 days
the Rubisco/PEPC ratio in the truncated seedlings grown
in the absence of O
3
was 5. At 300 nL.L
−1
O
3
in the
394 C. Gaucher et al.
Figure 5. G6PDH activity (nkat.mg prot
−1
) and PEPC activity (nkat.mg prot
−1
) for the truncated seedlings after 31 days (A, E), 57 days (B,
F) and 85 days (C, G) and the episodic seedlings (D, H) under increasing O
3
concentrations (data from first flush grown under low light
() and high light (), — regression line; data from second flush grown under low light () and high light (), – – regression line). D: first
flush: y = 0.0023x + 0.5751, p = 0.026, R
2
= 0.43; second flush: y = −2.10
−5
x
2
+ 0.0105x + 0.3356, p < 0.001, R
2
= 0.83. H: first flush:
y = 0.00145x + 0.377, p = 0.017, R
2
= 0.29; second flush: y = −3.10
−5
x
2
+ 0.0078x + 0.2312, p = 0.001, R
2
= 0.82.
truncated seedlings, as PEPC activity increased two-fold over
the seedlings grown in absence of O
3
and Rubisco activity was
not modified, the Rubisco/PEPC ratio decreased to 2.5.
The NR activity of the seedlings grown in the absence of
O
3
decreased more than two-fold during the growing season.
In the truncated seedlings there was no change in the NR ac-
tivity under O
3
(Figs. 6A–6C). On day 85, the first flush of the
episodic seedlings has a higher NR activity under high light
than under low light, whereas the effect of O
3
was not sig-
nificant (Fig. 6D, note the distribution of the white and black
squares). In the second flush, no effect of light was observed
but NR activity decreased with increasing O
3
(Fig. 6D).
On day 57, the total phenolic content was higher under high
irradiance than under low irradiance (Fig. 6F, note the distri-
bution of the white and black squares). O
3
had no effect on
the phenol content under high irradiance or low irradiance
(Fig. 6F). On day 85, the total phenol content decreased in
both flushes of leaves in response to O
3
(Fig. 6H).
4. DISCUSSION
The growth rate of the seedlings was similar under both
light environments used in our experiment. Sugar maple is a
shade tolerant species [3] and its assimilation rate is maximal
at low levels of irradiance. The carbon gain of sugar maple has
been shown to increase more between 1% and 10% of full sun-
light than between 10 and 100% [11]. The light environments
in our experiment were comparable to the levels found in large
gaps (low irradiance treatment) and in plantations (high irra-
diance treatment). We conclude that the assimilation rates of
the seedlings were not limited by light availability, resulting
in a similar total carbon gain and a similar growth rate for
seedlings in both light treatments. Leaf morphology, structure
and thickness are known to differ with increasing irradiance
levels [2,51]. However, in our study, specific leaf mass values
were similar at both irradiance levels. This indicates that all
the leaves had a similar morphology. The SLM values are in
the range of those found by Fortin and Mauffette [13] for the
sun leaves of sugar maple, which confirmed that both light en-
vironments represent sunny conditions for the growth of sugar
maple seedlings.
In the absence of O
3
, episodic seedlings had a higher
growth than truncated seedlings. However, these seedlings
were not able to sustain episodic growth under high O
3,
thus,
after 85 days at 300 nL.L
−1
, both types of seedlings had a sim-
ilar total biomass. Increasing oxidative stress limited new car-
bon skeletons production, less of which were then available
for the development of new sink tissues. The root/shoot ratio
was not affected by increasing O
3
in truncated nor episodic
seedlings. The seedlings showed a reduced accumulation of
biomass in below and above ground tissues in the same pro-
portion so that root/shoot ratios remained constant across the
O
3
gradient. This may be considered to be a conservative strat-
egy which enhances the survivorship of the seedlings of slow-
growing species [5].
Some enzymatic stimulation was also involved in this con-
servative strategy. The Rubisco activity was generally not
Response of Acer saccharum to an O
3
gradient 395
Figure 6. NR activity (µmol NO
2
.g FW
−1
.h
−1
) and phenol content (mg.g DW
−1
) for the truncated seedlings after 31 days (A, E), 57 days
(B, F) and 85 days (C, G) and the episodic seedlings (D,H) under increasing O
3
concentrations (data from first flush grown under low light ()
and high light (), — regression line; data from second flush grown under low light () and high light (), – – regression line). H: first flush:
y = −0.2041x + 155.85, p = 0.04, R
2
= 0.46; second flush: y = −0.2903x + 199.19, p = 0.02, R
2
= 0.55.
affected by high O
3
concentrations and actually increased at
the end of June and at the end of August in the younger leaves
of the episodic flush under high O
3
. This stimulation of CO
2
fixation by Rubisco in young foliar tissues may be a transient
response to oxidative stress. A similar transient response was
observed in a previous study where 45 day-old sugar maple
seedlings were exposed to 200 nL.L
−1
O
3
in phytotronic cham-
bers during 61 days [16]. However, in some other species de-
creased Rubisco activity and quantity is a more constant re-
sponse to O
3
[12,33,38].
The scavenging of toxic O
3
derivatives is in part achieved
by the ascorbate-glutathione detoxification cycle [14]. GR is
one of the enzymes of this cycle. In the present study, GR
activity increased two-fold in sugar maple seedlings in re-
sponse to increasing O
3
stress. This enzyme ensures a high
level of GSH regeneration and thus an efficient functioning
of the detoxification cycle by keeping ascorbate in a func-
tional reduced state. We measured a significant increase in the
G6PDH activity with increasing O
3
. G6PDH is a key enzyme
of the oxidative pentose phosphate pathway, which may oxi-
dize 5 to 20% of cellular glucose (the other 80 to 95% is ox-
idized by glycolysis). Stimulation of this enzyme allows an
enhanced NADPH production. GR may consume 25 to 50%
of the total NADPH produced during the day [4] and may
use the NADPH produced by G6PDH. In the neoformed flush
of the episodic seedlings, stimulation of G6PDH activity was
not maintained until the end of the season (day 85) when O
3
exceeded 150 nL.L
−1
. Therefore, NADPH production should
also decrease with the reduction of G6PDH activity. How-
ever, GR activity was maintained at a high level suggesting
that the enzyme used NADPH produced by the photochemi-
cal reactions of photosynthesis. At high O
3
concentrations the
decrease in G6PDH may be due to a reduced availability of
its substrate, glucose 6-phosphate, which in turn may be due
to a larger allocation of the glyceraldehyde 3-P to glycolysis
at the expense of starch synthesis and the pentose-phosphate
pathway.
Stimulation of PEPC activity was observed as O
3
concen-
tration increased. In the cytosol, PEPC produces the oxaloac-
etate needed for de novo synthesis of amino acids, which are
used for protein synthesis [29]. Under oxidative stress, pro-
teins may be degraded by O
3
and its by-products [28]. Thus,
a large proportion of newly synthesized proteins are allo-
cated to the repair processes [45]. The increased PEPC ac-
tivity observed in our seedlings presumably supplied the re-
pair processes via the anaplerotic pathway [45]. However, after
85 days, this stimulation was not maintained in the neoformed
flush of the episodic seedlings when O
3
exceeded 150 nL.L
−1
.
This suggested a lower capacity for the production of amino-
and organic acids and, consequently, a lower input to the repair
processes at the end of the season.
The total phenol content is reported to increase in response
to O
3
[8, 32] and phenolic compounds such as the precursors
of lignin are known to be implicated in the repair processes
of injured leaves [23]. However, phenol content of truncated
seedlings remained unchanged with increasing O
3
and even
decreased with increasing O
3
for episodic seedlings. Large
progression of foliar symptoms observed at the end of the
396 C. Gaucher et al.
season suggested that less precursors and less energy was allo-
cated to repair of injured foliar tissues. As PEPC transformed
PEP to OAA and as PEPC activity increased with increasing
O
3
, the PEP availability may have decreased. Thus the amount
of PEP, which is a precursor of phenols, may be less available
for the synthesis of phenolic compounds. Seedlings may par-
tition PEP between the replenishment of the tricarboxylic acid
cycle and the shikimate pathway. The allocation of PEP to the
tricarboxylic acid cycle may have increased with increasing
O
3
whereas its allocation to the shikimate pathway may have
decreased.
The NR activity was decreased by more than two-fold dur-
ing the growing season in the absence of ozone. During ex-
pansion and maturation of the leaves, N assimilation is mainly
under the control of NR. After maturation, N assimilation de-
creases and recycled N from photorespiration or protein degra-
dation constitutes the major source of N in the plant [27]. The
high level of NR activity on days 31 and 57, together with
the stimulation of the PEPC by O
3
, may support the produc-
tion of amino- and organic acids directed to repair processes.
However, after 85 days, the NR activity in the seedlings was
lower and decreased with increasing O
3
. At that time in the
season and with increasing oxidative stress, NH
3
may have
been provided from photorespiration to allow the regeneration
of amino acids derived from carbon skeletons provided by the
PEPC, which still had a high activity. Only a few studies have
measured the response of photorespiration to oxidative stress
and contradictory results have been observed. Dizengremel
and Pétrini [9] observed an increase in the photorespiration
pathway in plants under pollutant stress. However, Mander-
scheid et al. [34] measured a decrease in glycolate oxidase ac-
tivity (a peroxisomal enzyme of the photorespiratory pathway)
in Pinus taeda needles exposed to air pollution.
As a shade tolerant, slow growing species [3], sugar maple
has a low assimilation rate, leading to a compromise be-
tween maximizing aboveground growth and developing below
ground growth to enhance the survivorship of seedlings [5,17].
Under oxidative stress, the stimulation of the enzymes impli-
cated in energy, reducing power and carbon skeleton produc-
tion in response to O
3
may be a part of the species-related
survivalist strategy of growth for sugar maple, which allowed
seedlings to tolerate the high O
3
levels of this experiment.
However, under high O
3
, growth of neoformed flush of
the episodic seedlings is reduced and foliar injuries of the
seedlings are important. Moreover, PEPC and G6PDH activi-
ties were depressed after 85 days in the neoformed flush when
exposed to more than 150 nL.L
−1
O
3
. The cumulative oxida-
tive stress was too large and possibly exceeded the capacity
for detoxification and repair of the neoformed flush. The de-
fensive capacity of these neoformed flush seems to collapse
at the end of the season. As previously explained, this may
lead to a decreased production of reducing power and carbon
skeletons resulting in a less efficient repair and detoxification
processes. The presence of a second flush did not confer an ad-
vantage to the episodic seedlings for detoxification or repair.
Thus, the potentially more vigorous episodic seedlings did not
tolerate the oxidative stress more efficiently than the truncated
seedlings during one growing season.
Acknowledgements: We are grateful to M. Cartier, C. Pitre and R.
Veilleux for assistance in the field and to Dr. François Lorenzetti
for statistical advice. We thank J. Leblanc for the phenols content
measurements. This work was supported in part by a grant from
the “Ministère des Relations internationales du Québec” and “Minis-
tère français des Affaires étrangères” (coopération France-Québec)
n˚ PVP 10-1 and in part by a grant from the Natural Sciences and
Engineering Research Council of Canada, and by the Centre de
Recherche Acericole (MAPAQ).
REFERENCES
[1] Ashton P.M.S., Yoon H.S., Thadani R., Berlyn G.P., Seedling leaf
structure of New England maples (Acer) in relation to light environ-
ment, For. Sci. 45 (1999) 512–519.
[2] Bäck J., Vanderklein D.W., Topa M.A., Effects of elevated ozone
on CO
2
uptake and leaf structure in sugar maple under two light
environments, Plant Cell Environ. 22 (1999) 137–147.
[3] Baker F.S., A revised tolerance table, J. Forest. 47 (1949) 179-181.
[4] Burke J.J., Hatfield J.L., Plant morphological and biochemical re-
sponses to field water deficits. III: Effect of foliage temperature
on the potential activity of glutathione reductase, Plant Physiol. 85
(1987) 100–103.
[5] Canham C.D., Berkowitz A.R., Kelly G.M., Ollinger S.V. Schnurr
J., Biomass allocation and multiple resource limitation in tree
seedlings, Can. J. For. Res. 26 (1996) 1521–1530.
[6] Canham C.D., Kobe R.K., Latty E.R., Chazdon R.L., Interspecific
and intraspecific variation in tree seedlings survival: effects of allo-
cation to roots versus carbohydrate reserves, Oecologia 121 (1999)
1–11.
[7] Carlson R.W., Reduction in the photosynthetic rate of Acer,
Quer cus and Fraxinus species caused by sulphur dioxide and ozone,
Environ. Pollut. 18 (1979) 159–170.
[8] Chappelka A.H., Chevone B.I., Tree responses to ozone, in: Lefohn
A.S. (Ed.), Surface level ozone exposures and their effects on vege-
tation, Lewis Publishers Inc., 1991, pp. 271–324.
[9] Dizengremel P., Pétrini M., Effects of air pollutants on the path-
way of carbohydrate breakdown, in: Alscher R.G., Wellburn A.R.
(Eds.), Plant responses to the gaseous environment, Chapman &
Hall, 1994, pp. 255–278.
[10] Dizengremel P., Sasek T.W., Brown K.J., Richardson C.J., Ozone-
induced changes in primary carbon metabolism enzymes of loblolly
pine needles, J. Plant Physiol. 144 (1994) 300–306.
[11] Ellsworth D.S., Reich P.B., Leaf mass per area, nitrogen content
and photosynthetic carbon gain in Acer saccharum seedlings in con-
trasting forest light environments, Funct. Ecol. 6 (1992) 423–435.
[12] Fontaine V., Pelloux J., Podor M., Afif D., Gérant D., Grieu P.,
Dizengremel P., Carbon fixation in Pinus halepensis submitted to
ozone. Opposite response of ribulose-1,5-bisphosphate carboxy-
lase/oxygenase and phosphoenolpyruvate carboxylase, Physiol.
Plant. 105 (1999) 187–192.
[13] Fortin M., Mauffette Y., The suitability of leaves from dif-
ferent canopy layers for a generalist herbivore (Lepidoptera:
Lasiocampidae) foraging on sugar maple, Can. J. For. Res. 32
(2002) 379–389.
[14] Foyer C.H., Halliwell B., The presence of glutathione and glu-
tathione reductase in chloroplasts: a proposed role in ascorbic acid
metabolism, Planta 133 (1976) 21–25.
[15] Fuentes J.D., Dann T.F., Ground-level ozone in eastern Canada: sea-
sonal variations, trends, and occurences of high concentrations, J.
Air Waste Manage, Assoc. 44 (1994) 1019–1026.
[16] Gaucher C., Costanzo N., Afif D., Mauffette Y., Chevrier N.,
Dizengremel P., The impact of elevated ozone and carbon dioxide
on young Acer saccharum (Marsh.) seedlings, Physiol. Plant. 117
(2003) 392–402.
Response of Acer saccharum to an O
3
gradient 397
[17] Gaucher C., Gougeon S., Mauffette Y., Messier C., Seasonal vari-
ation in biomass and carbohydrate partitioning of understory sugar
maple (Acer saccharum) and yellow birch (Betula alleghaniensis)
seedlings, Tree Physiol. 25 (2005) 93–100.
[18] Gregory R.A., Annual cycle of shoot development in sugar maple,
Can. J. For. Res. 10 (1980) 316–326.
[19] Heagle S.A., Philbeck R.B., Rogers H.H., Letchworth M.B.,
Dispensing and monitoring ozone in open-top field chambers for
plant effect studies, Phytopathology 69 (1989) 15–20.
[20] Hogsett W.E., Weber J.E., Tingey D., Herstrom A., Lee E.H.,
Laurence J.A., An approach for caracterizing tropospheric ozone
risk to forests, Environ. Manage. 21 (1997) 105–120.
[21] Isaksen I.S.A., Hov Ø., Calculation of trends in the tropospheric
concentration of O
3
, OH, CO, CH
4
and NO
x
, Tellus 39B (1987)
271–285.
[22] Jaworski E.G., Nitrate reductase assay in intact plant tissue,
Biochem. Biophys. Res. Co. 43 (1971) 1274–1279.
[23] Jones C.G., Coleman J.S., Plant stress and insect herbivory: toward
an integrated perspective, in: Mooney H.A., Winner W.E., Pell E.J.
(Eds.), Response of plants to multiple stresses, Academic Press,
1991, pp. 249–274.
[24] Kickert R.N., Krupa S.V., Forest responses to tropospheric ozone
and global climate change: an analysis, Environ. Pollut. 68 (1990)
26–65.
[25] Kramer P.J., Kozlowski T.T., Physiology of woody plants,
Academic Press, Orlando, FL, 1979, 811 p.
[26] Kress L.W., Skelly J.M., Response of several eastern forest tree
species to chronic doses of ozone and nitrogen dioxide, Plant Dis.
66 (1982) 1149–1152.
[27] Lam H.M., Coschigano K.T., Oliveira I.C., Melo-Oliveira R.,
Coruzzi G.M., The molecular-genetics of nitrogen assimilation into
amino acids in higher plants, Ann. Rev. Plant Physiol. 47 (1996)
569–93.
[28] Larson R.A., Plant defences against oxidative stress, Arch. Insect
Biochem. 29 (1995) 175–186.
[29] Latzko E., Kelly G.J., The many-faceted function of phospho-
enolpyruvate carboxylase in C
3
plants, Physiol. Veg. 21 (1983) 805–
815.
[30] Laurence J.A., Kohut R.J., Amundson R.G., Weinstein D.A., Mac
Lean D.C., Response of sugar maple to multiple year exposures to
ozone and simulated acidic precipitation, Environ. Pollut. 92 (1996)
119–126.
[31] Lilley R.C., Walker D.A., An improved spectrophotometric assay
for ribulose bisphosphate carboxylase, Biochem. Biophys. Acta 358
(1974) 226–229.
[32] Luethy-Krause B., Pfenninger I., Landolt W., Effects of ozone on
organic acids in needles of Norway spruce and Scots pine, Trees 4l
(1990) 198–204.
[33] Lütz C., Anegg S., Gérant D., Alaoui-Sossé B., Gérard J.,
Dizengremel P., Beech trees exposed to high CO
2
and to simulated
summer ozone levels: effects on photosynthesis, chloroplast compo-
nents and leaf enzyme activity, Physiol. Plant. 109 (2000) 252–259.
[34] Manderscheid R., Jâger H J., Kress L.W., Effects of ozone on foliar
nitrogen metabolism of Pinus taeda L. and implications for carbo-
hydrate metabolism, New Phytol. 121 (1992) 623–633.
[35] Noble R., Jensen K.F., Ruff B.S., Loats K., Response of Acer sac-
charum to elevated carbon dioxide and ozone, Ohio J. Sci. 92 (1992)
60–62.
[36] Nakano Y., Asada K., Spinach chloroplasts scavenge hydrogen per-
oxide on illumination, Plant Cell Physiol. 21 (1980) 1295–1307.
[37] Noctor G., Foyer C.H., Ascorbate and glutathione: keeping active
oxygen under control, Ann. Rev. Plant Physiol, Plant Mol. Biol. 49
(1998) 249–279.
[38] Pell E.J., Eckardt N., Glick R.E., Biochemical and molecular ba-
sis for impairment of photosynthetic potential, Photosynth. Res. 39
(1994) 453–462.
[39] Pitel J.A., Cheliak W.M., Effectiveness of protective agents for in-
creasing the activity of five enzymes from vegetative tissues of
white spruce, Can. J. Bot. 64 (1985) 39–43.
[40] Prather M., Gauss M., Berntsen T., Isaksen I., Sundet J., Bey I.,
Brasseur G., Dentener F., Derwent R., Stevenson D., Grenfell L.,
Hauglustaine D., Horowitz L., Jacob D., Mickley L., Lawrence M.,
von Kuhlmann R., Muller J F., Pitari G., Rogers H., Johnson M.,
Pyle J., Law K., van Weele M., Wild O., Fresh air in the 21st cen-
tury? Geophys. Res. Lett. 30 (2003).
[41] Rebbeck J., Chronic ozone effects on three northeastern hard-
wood species: growth and biomass, Can. J. For. Res. 26 (1996)
1788–1798.
[42] Rebbeck J., Loats K.V., Ozone effects on seedlings sugar maple
(Acer saccharum) and yellow-poplar (Liriodendron tulipifera)gas
exchange, Can. J. For. Res. 27 (1997) 1595–1605.
[43] Renaud J.P., Allard G., Mauffette Y., Effects of ozone on yield,
growth, and root starch concentrations of two alfafa (Medicago
sativa L.) cultivars, Environ. Pollut. 95 (1997) 273–281.
[44] Robichaux A., Analyse des niveaux d’ozone troposphérique
en milieu forestier, réseau REMPAFAQ (1989–1991). Direction
de l’environnement forestier, service du suivi environnemental,
Québec, 1994, p. 84.
[45] Sehmer L., Fontaine V., Antoni F., Dizengremel P., Effects of
ozone and elevated atmospheric carbon dioxide on carbohydrate
metabolism of spruce needles, Catabolic and detoxification path-
ways, Physiol. Plant. 102 (1998) 605–611.
[46] Smith I.K., Vierheller T.L., Thorne C.A., Assay of glutathion
reductase in crude tissue homogenates using 5,5’-dithiobis (2-
nitrobenzoic acid), Ann. Biochem. 175 (1988) 408–413.
[47] Sokal R., Rohlf J., Biometry: The Principles and Practice of
Statistics in Biological Research, Freeman and Co., New-York,
1995, pp. 451–554.
[48] Steingraeber D.A., Heterophylly and neoformation of leaves in
sugar maple (Acer saccharum), Am. J. Bot. 69 (1982) 1277–1282.
[49] Swain T., Hillis W.E., The phenolic constituents of Prunus
domestica. The quantitative analyses of phenolic constituents, J. Sci.
Food Agric. 10 (1959) 63–68.
[50] Tietz S., Wild A., Investigations on the phosphoenolpyruvate car-
boxylase activity of spruce needles relative to the occurrence of
novel forest decline, J. Plant Physiol. 137 (1991) 327–331.
[51] Tjoelker M.G., Volin J.C., Oleksyn J., Reich P.B., Interaction of
ozone pollution and light effects on photoynthesis in a forest canopy
experiment, Plant Cell Environ. 18 (1995) 895–905.
[52] Topa M.A., Vanderklein D.W., Corbin A., Effects of elevated ozone
and low light on diurnal and seasonal carbon gain in sugar maple,
Plant Cell Environ. 24 (2001) 663–677.
[53] Truax B., Gagnon D., Chevrier N., Nitrate assimilation of raspberry
and pin cherry in a recent clearcut, Can. J. Bot. 72 (1994) 1343–
1348.
[54] Tucker G.F., Lassoie J.P., Fahey T.J., Crown architecture of stand-
grown sugar maple (Acer saccharum Marsh.) in the Adirondack
Mountains, Tree Physiol. 13 (1993) 297–310.
[55] Turner S., Problématique de l’ozone troposphérique au Québec et
dans la région de Montréal, Environnement Canada (1995).
[56] Van Oosten J.J., Afif D., Dizengremel P., Long-term effects of
aCO
2
enriched atmosphere on enzymes of the primary carbon
metabolism of spruce trees, Plant Physiol. Biochem. 30 (1992) 541–
547.
[57] Von Althen F.W., Hardwood plantation establishment on former
farmland in southern Ontario, Pap. Pres. at the 21st Semaine des
sciences for., Univ. Laval, Québec, 1990, p. 18.
[58] Wieser G., Hecke K., Tausz M., Häberle K-H., Grams T.E.E.,
Matyssek R., The influence of microclimate and tree age on the
defense capacity of European beech (Fagus sylvatica L.) against
oxidative stress, Ann. For. Sci. 60 (2003) 131–135.
[59] Yawney H.W., Planting sugar maple, in: Sugar maple research: sap
production, processing and marketing of maple syrup, USDA, For.
Serv., Northeastern For. Exp. Stn., Broomall (PA), Gen. Tech. Rep.
NE-72 (1982) 53–60.