Báo cáo lâm nghiệp: " Effect of species and ecological conditions on ellagitannin content in oak wood from an even-aged and mixed stand of Quercus robur L. and Quercus petraea Liebl." docx
Bạn đang xem bản rút gọn của tài liệu. Xem và tải ngay bản đầy đủ của tài liệu tại đây (978.8 KB, 10 trang )
Ann. For. Sci. 63 (2006) 415–424 415
c
INRA, EDP Sciences, 2006
DOI: 10.1051/forest:2006021
Original article
Effect of species and ecological conditions on ellagitannin content in
oak wood from an even-aged and mixed stand of Quercus robur L.
and Quercus petraea Liebl.
Andrei P
a
, Jean-Claude B
a
,AlexisD
b
, Gérard N
c
, Jean-Louis P
a
*
a
Unité Mixte de Recherche “Science pour l’Œnologie”, Institut National de la Recherche Agronomique, 2 Place Viala, 34060 Montpellier, France
b
Unité Mixte de Recherche BIOGECO, Institut National de la Recherche Agronomique, 69 Route d’Arcachon, 33612 Cestas Cedex, France
c
Unité Mixte de Recherche LERFOB, Institut National de la Recherche Agronomique, Centre de Nancy, 54280 Champenoux Cedex, France
(Received 7 December 2004; accepted 6 January 2006)
Abstract – Species effects and ecological conditions on ten heartwood ellagitannins (vescalin, castalin, roburins A-E, grandinin, vescalagin and casta-
lagin) and ellagic acid were investigated in a 100 years old stand of 5 ha located in western France (La Petite Charnie State Forest, Sarthe). The
sample included a total of 286 trees (118 sessile oaks, 158 pedunculate oaks and 10 individuals with an intermediate morphology) located in three
ecological zones (plateau, slope, small valley). The main factor influencing oak extractives level was botanical species. The ecological zone effect
appears negligible. Pedunculate oak is generally richer in ellagitannins (48.4 mg/g against 34.4 for sessile oak), although a clear boundary between the
two species cannot be established. Ellagitannin content was found to be correlated with ring width for pedunculate oak and not for sessile oak. The
vescalagin/castalagin ratios differed between the two species (0.69 for Quercus robur against 0.53 for Quercus petraea). The distribution of ellagitannin
contents is not strongly structured spatially.
ellagitannin / oak w ood / Quercus robur L. / Quercus petraea Liebl. / variability / ecological conditions
Résumé – Effet de l’espèce et des conditions écologiques sur le contenu du bois en ellagitanins dans un peuplement équien de chêne (Quercus
robur L., Quercus petraea Liebl.). Les effets de l’espèce et des conditions écologiques sur le contenu du duramen externe de dix ellagitanins (vescaline,
castaline, roburines A à E, grandinine, vescalagine, castalagine) et de l’acide ellagique ont été étudiés dans un peuplement équien (100 ans) de chêne
d’une surface de 5 ha située dans l’ouest de la France (forêt domaniale de La Petite Charnie, Sarthe). L’échantillon total se composait de 286 arbres
(118 chênes sessiles, 158 chênes pédonculés et 10 chênes intermédiaires) répartis en mélange dans trois zones écologiques du peuplement (plateau,
pente et fond de vallon). Le facteur principal qui influence la teneur en ellagitanin est l’espèce botanique, alors que le facteur « zone » est négligeable
dans les conditions expérimentales considérées. Le bois de chêne pédonculé est plus riche en ellagitanins que celui du chêne sessile (48,4 mg/g pour le
chêne pédonculé ; 34,4 mg/g pour le chêne sessile), mais une distinction claire entre les deux espèces ne peut être établie. Une corrélation entre la teneur
en ellagitanin et la largeur de cerne est observée pour le chêne pédonculé à la différence du cas du chêne sessile. Le rapport vescalagine/castalagine est
plus élevé pour le chêne pédonculé que pour le chêne sessile (0,69 et 0,53). La structuration spatiale est faible.
ellagitanin / bois de chêne / Quercus robur L. / Quercus petraea Liebl. / variabilité intrapeuplement / conditions écologiques
1. INTRODUCTION
Ellagitannin content in oak wood (Quercus robur L. and
Quercus petraea Liebl.) is an important choice criterion in
cooperage since these highly reactive chemicals interact with
wine phenolics during the maturation of wine in oak bar-
rels [11, 18, 22, 33, 35, 38, 43]. Several research groups have
already investigated the influence of the botanical species
(Quercus robur L. and Quercus petraea Liebl.) in relation
to ecological factors (soil, climate), topography, rhythmic
growth [4,12,26, 36] as well as the geographic location of the
trees on ellagitannin content in oak wood. Total ellagitannin
content was studied in wood of one or both species originating
from several forests of Central and Northern France (Cîteaux,
* Corresponding author:
Tronçais, Lavault, Grosbois, etc.) [28, 32, 39]. A large set of
wood samples from South-West of France has also been stud-
ied [13, 14]. The major conclusion of these studies is that
oak species effect on ellagitannin content largely predominates
over geographic effect. Oak species differ substantially what-
ever their provenance, although the difference in total pheno-
lics between species is lower among trees from mixed stand
than from the trees originating from different locations [30].
Furthermore, a large proportion of the total variation among
progeny was attributed to forest origins, but genetic or envi-
ronmental causes could not be clearly separated [31].
However, the main problem in the previous cited reports is
that the sampled stands were more or less monospecific. Thus,
the effects of species and ecological conditions are often dif-
ficult to discriminate. Differentiation for ellagitannin amounts
between trees within a stand was also to be taken into account
Article published by EDP Sciences and available at or />416 A. Prida et al.
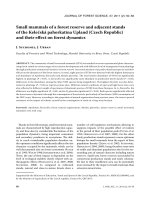
Figure 1. Map of La Petite Charnie stand. Arrows indicate the slope towards the valley.
by using numerous experimental sets of trees. Besides, tree age
effects and heterogeneities in the distribution of ellagitannin in
wood tissues could influence conclusions and render interpre-
tations difficult [27,28].
The aim of the current study is to contribute to clarify the
respective influence of botanical species and site conditions
on chemical composition of ellagitannins in oak heartwood.
The studied stand was an average aged stand of 100 years
from seed in which we had the opportunity to sample all the
286 constitutive trees (118 sessile oaks, 158 pedunculate oaks,
10 individuals with an intermediate morphology) which grew
under the same silvicultural conditions. Given that those trees
were distributed according to three ecological zones (plateau,
slope, small valley) the effects of these ecological conditions
and species were investigated globally and individually. Dif-
ferent statistical methods could be performed in this study.
The current research focused on chemical composition of oak
extractives to obtain a reliable database for the investigated
site. The aim of this paper is to analyze the ellagitannin varia-
tions within a stand. The species, ecological factors and spatial
distribution effects on ellagitannin concentrations are investi-
gated.
2. MATERIALS AND METHODS
2.1. Wood sampling
The sampled stand (compartment 26, La Petite Charnie State For-
est, latitude: 48.08
◦
N, longitude: 0.17
◦
W) is located in the west-
ern part of France. This stand was described by Bacilieri et al. [2].
The climate is typically Atlantic, temperate and wet: mean rainfall
is 880 mm per year and mean temperature is 11
◦
C. The geological
substratum is composed of Ordovician red sandstone. The mean el-
evation of the stand is 140 m. The stand is included in a continuous
forest of 700 ha, consisting mostly of naturally regenerated stands
of sessile and pedunculate oaks. The sampled stand covers 5 ha and
contains 287 adult trees (one beech tree and 286 oak trees therefore
the density is 57 trees per ha. The stand consists of three ecological
zones: small valley, plateau, intermediate (and regular) slope. On the
northwestern part of the stand (plateau) the soil is well drained and
composed of sand and slit. The south-eastern part (small valley) is
characterized by humid clayish soil.
Both oak species (Quercus robur L. and Quercus petraea Liebl.)
cover the stand (Fig. 1). However, we can observe a significant cor-
relation between oak species distribution, with Quercus robur being
dominant in the small valley and Quercus petraea on the plateau. The
natural regeneration from seeds of the stand occurred in 1899–1900.
During autumn 1998, 2000 and 2001 all the trees were cut down.
Thus all the trees under investigation were approximately of the same
age (100 years). The species were identified using Factorial Discrim-
inant Analysis on 34 leaf markers [2].
A total of 286 trees (118 sessile oaks, 158 pedunculate oaks
and 10 individuals with an intermediate morphology) were studied.
The three studied ecological zones are represented in Figure 1. The
species distribution between zones is as follows: pedunculate oaks
(plateau: 17, slope: 57, small valley: 84 trees), sessile oaks (plateau:
52, slope: 62, small valley: 4 trees), intermediate oaks (plateau: 2,
slope: 2, small valley: 6).
For each oak tree a 10 cm thick disk was cut at 1.30 m. From this
disk a diametrical strip 10 cm wide and oriented North-South was ex-
tracted through sawing. After sapwood exclusion, sampling was car-
ried out by shaving 10 cm-long zones (approximately 35–40 rings)
located at both extremities of each diametric strip (corresponding
to outer heartwood). The wood material from the two extremities
Oak ellagitannin versus species and ecology 417
of the diametric strip were mixed so that a single powder sample
is available for each of the 286 trees. This sampling should mini-
mize the influence of heterogeneities in ellagitannin content within
the trunk [28]. The shavings were ground down to obtain a powder
with linear dimensions equal to or less than 0.5 mm. Newly felled
trees were used and all the procedures were performed identically for
all trees.
2.2. Analysis
2.2.1. HPLC
Ellagitannins were extracted with an acetone-water mixture (7:3).
The acetone was evaporated and the samples filtered on Millipore
filtration membranes. The quantification of ellagitannins was per-
formed using a HPLC method. The HPLC line consisted of equip-
ment from Millipore-Waters: a 490 E multiwaved detector, two
Model 510 pumps, a Model 717 automatic injector, System Interface
Module (SIM) and Maxima 820 software (Millipore-Waters) were
used.
An RP 18 LiChrospher
column (250 × 4 mm, 5 µm) (Merck,
Darmstadt, Germany) and a precolumn from the same supplier (4 ×
4 mm, 5 µm) were used to separate and determine the ellagitannins.
A binary gradient was used with the following elution conditions:
solvent A, 0.1% phosphoric acid in water; solvent B, water-methanol
solution (50:50); flow rate 0.8 mL/min; gradient, 0 to 16% B in
45 min, 16 to 90% B in 5 min, 90% B (constant gradient) for 5 min,
90 to 100% B in 15 min, 100% B (constant gradient) for 10 min,
100% to 0% B in 5 min.
The ellagitannins were detected by their UV-sorption at 240 nm
using a diode-array detector (Waters
990). Identification was
achieved by co-chromatography with purified references and by spec-
tres comparison. Quantification was achieved using calibration with
purified ellagitannins provided by INRA (Montpellier). Ten ellagitan-
nins (vescalin, castalin, roburin A-E, grandinin, vescalagin and casta-
lagin) and ellagic acid were quantified in each oak wood sample.
2.3. Statistical treatment
Statistical treatments were carried out using SAS software [37]
and SGS ( />2.3.1. Principal Component Analysis (PCA)
PCA was carried out for all the ellagitannins traits (individual
ellagitannin content, ellagic acid content, total ellagitannin content,
percentage of individual ellagitannin, vescalagin/castalagin ratio).
The 2-D variables graphs were plotted for 22 variables. Variance ex-
plained by each axis was calculated.
2.3.2. Correlation analysis
Correlation analysis was performed to assess possible relation-
ships between total ellagitannin content and ring width, as well as
between total ellagitannin content and vescalagin/castalagin ratio.
Breavis – Pearson correlation coefficients and probabilities were cal-
culated.
2.3.3. Spatial analysis
We have used the SGS software [8] available at the following
address: The spatial
structure of continuous quantitative traits can be analysed by apply-
ing a distance measure. The mean distance between all pairs of indi-
viduals belonging to a given distance class serves as the measure of
spatial structure. The mean over all pairs provides the reference value
indicating absence of spatial structure. Values below the reference
show positive autocorrelation and those higher indicate negative spa-
tial autocorrelation. The SGS program computes transformed values
of each trait using the z-transformation. This transformation is nec-
essary to avoid problems with changing scales among different traits
( [9] in [8]).
2.3.4. Variance analysis
Variance analysis was performed for the following traits: individ-
ual ellagitannin content, ellagic acid content, total ellagitannin con-
tent, percentage of individual ellagitannin, and vescalagin/castalagin
ratio. First, the following effects were analyzed by one-way ANOVA:
species effect for the global set (all the trees, regardless of the eco-
logical zone), species effect in one ecological zone in which the two
species were intimately mixed with large number of trees for both
species (slope). Second, two-way ANOVAs were performed: the first
one assuming significant interaction between ecological zone and
species effects, the second one under the hypothesis of not significant
interaction between them. For this analysis, intermediate individuals
were excluded due to the small sample size (10 trees).
The general linear models procedure was applied for this purpose.
A Student-Newman-Keuls test was carried out for each variable.
2.3.5. Total ellagitannin content in oak wood
The total ellagitannin content in oak wood was measured for both
species. The measures were made in the range from 0 to maximum
ellagitannin level (120 mg/g of dry weight of wood) with intervals of
5mg/g.
2.3.6. Differentiation functional analysis (DFA)
DFA was carried out using all ellagitannin traits (individual ellag-
itannin content, ellagic acid content, total ellagitannin content, per-
centage of individual ellagitannin, vescalagin/castalagin ratio). Two
canonical functions were calculated and oak samples were projected
on a 2-D plan.
3. RESULTS AND DISCUSSION
Ellagitannin contents for each species are shown in Tables I
and II. The values of ellagitannin content and their percentages
were comparable to those reported by other authors for Euro-
pean oak wood [5, 16, 28, 30]. As in these previous studies,
a high natural variability of wood extractives was observed.
However, the large sample size led to important conclusions.
418 A. Prida et al.
Table I. Means and distribution parameters of sessile oak ellagitanin.
Descriptive Vescalin Castalin Roburin A Roburin B Roburin C Grandinin Roburin D Vescalagin Roburin E Castalagin Ellagic acid Total
ellagitanin
Mean 0.73 0.48 1.67 2.45 2.12 2.74 3.23 6.41 3.00 11.82 2.00 34.68
95% CIM* 0.62–0.84 0.42–0.55 1.51–1.83 2.18–2.72 1.81–2.43 2.44–3.03 2.81–3.64 5.79–7.03 2.71–3.30 10.93–12.71 1.79–2.21 31.81–37.56
Minimum– 0.05–3.96 0.07–2.26 0.27–4.78 0.39–8.66 0.28–10.54 0.31–9.55 0.17–11.64 1.27–15.88 0.46–9.34 3.75–30.26 0.00–8.38 8.62–94.28
maximum
Std. 0.61 0.34 0.88 1.48 1.71 1.61 2.27 3.41 1.61 4.89 1.15 15.85
* CIM - Confidence Interval for Mean.
Table II. Means and distribution parameters of pedunculate oak ellagitanin.
Descriptive Vescalin Castalin Roburin A Roburin B Roburin C Grandinin Roburin D Vescalagin Roburin E Castalagin Ellagic acid Total
ellagitanin
Mean 1.08 0.65 3.25 3.10 2.54 3.20 4.28 11.04 3.39 15.78 1.84 48.35
95% CIM* 0.97–1.20 0.59–0.71 2.92–3.58 2.83–3.37 2.26–2.81 2.86–3.54 3.84–4.72 10.15–11.93 3.09–3.69 14.82–16.73 1.70–1.98 45.06–51.65
Minimum– 0.12–3.89 0.10–1.99 0.57–12.83 0.57–8.63 0.36–9.65 0.47–11.51 0.62–13.07 2.95–35.47 0.29–10.86 5.39–41.29 0.50–5.37 14.10–134.67
maximum
Std. 0.72 0.39 2.09 1.70 1.72 2.17 2.82 5.66 1.91 6.07 0.88 20.94
* CIM - Confidence Interval for Mean.
Oak ellagitannin versus species and ecology 419
Figure 2. Principal Component Analysis. Variables projection.
3.1. Correlation between studied parameters
The 2-D PCA projection of variables is presented on Fig-
ure 2. The first principal component axis explains 34.1% of
the total variation and is closely correlated with some param-
eters such as total ellagitannin content, vescalagin, castalagin,
grandinin and roburin A-E content. The second axis explains
16.1% of the total variation and is related to castalin, vescalin,
percentage of vescalin, castalin, roburin A and C. The PCA
plot indicates the relation between variables. The measured
traits can be roughly grouped as follows: total ellagitannin
content, vescalagin, castalagin, grandinin and roburin A-E
content, which are negatively correlated with the percentage
of castalagin and are not correlated with castalin, vescalin and
ellagic acid content as well as with the percentage of vescalin,
castalin, vescalagin, roburin B, C and E. Moreover one can
observe a negative correlation between castalin, vescalin and
ellagic acid content and the percentage of vescalin, castalin,
roburin A and C on the one hand and the percentage of vescala-
gin and vescalagin/castalagin ratio on the other hand.
The significance of these correlations is that the increase
of the total ellagitannin content, corresponding to an increase
in all individual ellagitannins content except for vescalin and
castalin, is mostly the result of an increase in roburin A-E,
grandinin and vescalagin, whereas the castalagin content in-
creases more slowly. Roburin A-E, grandinin and vescalagin
contents rose gradually (their percentages are poorly corre-
lated or not correlated with total growth), while the castala-
gin increase declined (its percentage is negatively correlated
with total growth). Vescalin, castalin and ellagic acid are the
structural units of other ellagitannins under investigation and
related with them by formation – hydrolysis pathways [24,42].
However the absence of correlation between these two groups
emphasizes the complex character of these transformations.
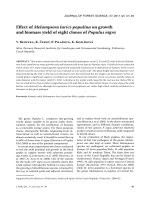
The total and individual ellagitannin content, except ellagic
acid, were found to be correlated with ring width for peduncu-
late oak. The best correlation is for castalagin and total ellagi-
tannin content: r
2
= 0.41 (0.1%) and 0.39 (0.2%) respectively
(n = 158). The correlation for total ellagitannin content is pre-
sented in Figure 3. No significant correlation was observed
for sessile oak, in contradiction with the findings of Snakkers
et al. [39], who found a positive correlation for sessile oak.
This result was observed in each ecological zone, although the
mean values and deviation of ring width were approximately
the same for both species (2.81 ± 0.48 mm for sessile oak and
2.52 ± 0.38 mm for pedunculate oak).
An anatomical interpretation of this result can be proposed.
As large “grained” wood (i.e. wide annual rings) of both ses-
sile and pedunculate oaks is known to have a higher proportion
of latewood [1, 7, 10,15, 17, 19,20, 25] it can be inferred that
the ellagitannin content in latewood tissues is higher than in
earlywood (at least for pedunculate oak). This inference cor-
responds to the results described by Masson et al. [27] who
observed a higher ellagitannin content in latewood tissues (in
that case, for both sessile and pedunculate oaks). However,
we cannot completely exclude the possibility of the following
artefact: as all the examined heartwood samples have the same
length (10 cm), large ring samples exhibit lower age from the
sapwood/heartwood limit and, thus, higher ellagitannin con-
tent as it is well known that the lower-aged wood possess a
higher ellagitannin level [23,28].
No correlation was found between individual ellagitannin
percentage and ring width for both species.
The correlation between total ellagitannin content and
vescalagin/castalagin ratio was studied for the whole set (tree
zones, two species, n = 276), for sessile oaks (for each of three
zones), for pedunculate oaks (for each of three zones), for
small valley (both species), slope (both species) and plateau
(both species). Although one can observe significant correla-
tion for each species (more pronounced for pedunculate oak:
r
2
= 0.29 (0.2%), than for sessile one : r
2
= 0.24 (0.99%)), the
correlation substantially increased in the whole set, where both
420 A. Prida et al.
Figure 3. Correlation between ring width and total ellagitannin content for pedunculate oak.
Figure 4. One-way ANOVA results for the zone effect as tested on the whole set of sessile and pedunculate oaks.
species are represented: 0.37 (0.1%). This result was expected
because as it will be shown below, pedunculate oak con-
tained a higher level of both ellagitannin content and vescala-
gin/castalagin ratio than sessile oak.
3.2. Species differentiation
No difference was observed for the content of major ellagi-
tannins of the same species in the three ecological zones: three
zones for pedunculate, but only two zones (slope and plateau)
for sessile were used in the analyses because of the scarcity of
the last species in the valley. The detailed results for zone dif-
ferentiation in Figure 4 correspond to the whole set of sessile
and pedunculate oaks.
The species status strongly influences oak wood extractives.
Most ellagitannins differed by their content as a function of the
species. In Figures 5 and 6, major results are presented for the
complete stand and for slope, where sessile and pedunculate
Oak ellagitannin versus species and ecology 421
Figure 5. One-way ANOVA results for the species effect as tested on the whole set of sessile and pedunculate oaks.
Figure 6. One-way ANOVA results for the specie effect as tested on the same ecological zone that is the slope.
trees are in equal proportions (62 sessile and 57 peduncu-
late oaks). Mean ellagitannin content and the concentrations
of some major ellagitannins (vescalin, roburin A, vescalagin
and castalagin) in pedunculate oak (48.36 mg/g for total con-
tent, 15.78 mg/g for castalagin and 11.05 mg/g for vescala-
gin) are substantially higher than in sessile oak (34.41 mg/g,
11.76 mg/g and 6.36 mg/g respectively), in agreement with
previous studies [5,14,16, 28–30].
However, a better discrimination of species is found in the
complete set (Fig. 5) than in the slope (Fig. 6). Hence, a “zone”
effect is superimposed onto a “species” effect in the overall
sample.
The percentage of individual ellagitannin is a less relevant
characteristic for species discrimination. It is significant only
for the following ellagitannins: roburin A (41.52 prob.
0.0001), grandinin (19.21 prob. 0.0001), vescalagin
422 A. Prida et al.
Figure 7. Two-way ANOVA results for ecological zone, species effects and interaction.
(49.13 prob. 0.0001), roburin E (58.59 prob. 0.0001) and also
for the vescalagin/castalagin ratio (53.44 prob. 0.0001). This
last index is higher for Quercus robur (0.69 against 0.53 for
Quercus petraea). It was reported earlier that this index could
be used to distinguish different oak (Quercus) and chestnut
species (Castanea sativa) [34, 44]. The present data confirm
this hypothesis.
The results of the two-way ANOVA(s) are presented in Fig-
ure 7. A two-step approach was performed to evaluate the in-
fluence of each factor: species, ecological zone as well as the
interaction between them. In the first step, species and ecolog-
ical zone effects were calculated by assuming that they are in-
dependent. This step represents a somewhat rough approach,
because of the pronounced correlation between species dis-
tribution and ecological zone (Fig. 1). Therefore, in the sec-
ond step, the model took into account the interaction between
these factors. Model estimation values allowed the assessment
of model reliability.
The analysis of the interaction between species effect and
ecological zone effect demonstrates the predominance of the
species effect. Neither zone effect, nor species – ecological
zone interactions are significant. This result shows that the
“zone” effect found in the mixed lot is conditioned by species
effect and not by ecological zone effect.
As a consequence, the distribution of total ellagitannin
content was studied with the objective to better characterise
species differences. The DFA analysis (two canonical func-
tions) was used for this purpose.
The distribution total ellagitannin content in sessile and
pedunculate oaks are shown in Figure 8. The continued
smoothing curves were plotted to better visualise the distri-
butions. The sessile and pedunculate samples present one-
Figure 8. Distribution for total ellagitannin content in sessile and pe-
dunculate oak trees (118 and 158 trees respectively).
peak distributions. Maximum distribution density was found
to be located in a 25–30 mg/g interval for sessile oak and 45–
50 mg/g for pedunculate oak. However, the natural variability
of ellagitannin content in each species is very high and many
oak samples cannot be identified on the basis of this single
character, as shown by the DFA results.
Oak ellagitannin versus species and ecology 423
Figure 9. Distogram using block distance with sessile and pedun-
culate oaks for ten ellagitannins. Values below the reference show
positive autocorrelation and those higher indicate negative spatial au-
tocorrelation.
3.3. Spatial distribution of ellagitannin variability
The analysis of ten ellagitannins in the two species shows a
very weak spatial distribution in this stand (Fig. 9 and Tab. III).
A weak spatial distribution is found for six of the 10 ellag-
itanins and total ellagitannins for the two species combined,
for three ellagitanins in sessile oak and for four in peduncu-
late oak. This low spatial structure is surprising given that the
stand is spatially structured for the species distribution, eco-
logical conditions and gene resources. Several spatial studies
were conducted with phenological, morphological and molec-
ular markers in this stand. Significant spatial structure up to
40 and 70 m were found by Bacilieri et al. [3] with isozymes,
morphology and phenology and by Streiff et al. [41] with mi-
crosatellite markers. Plant phenols, such as ellagitannins, con-
stitute an important group of molecules involved in plant de-
fence [21]. Sork et al. [40] have observed local adaptation
against insect predation within a stand of Quercus rubra. In
Quercus suber, Conde et al. [6] have found provenances dif-
ferentiation for ellagitanins and other polyphenols. This low
spatial organization could be due to a combination of ecologi-
cal heterogeneity at local scale and genetic structure.
4. CONCLUSIONS
A mixed and even-aged high forest of Quercus robur L.
and Quercus petraea Liebl. was investigated in this study. A
statistically large set of samples (286 trees) was analyzed and
treated by different statistical methods. HPLC technique was
applied to quantify ellagitannin content in oak wood samples.
There was a large variation in concentration of ellagitannins
in the 286 trees samplings investigated. Several analytical in-
dexes, like total ellagitannin content and content of major el-
lagitannins (vescalagin, castalagin, grandinin and roburin A-
E) are closely correlated with each other.
The main factor influencing oak extractives level is botan-
ical species. The factor of ecological zones is negligi-
ble. Pedunculate oak is generally richer in ellagitannins
Table III. Geographic distribution of ellagitannins within the stand
(meter).
Ellagitannins All species Pedunculate oak Sessile oak
Species Strong: 110
distribution and 130
10 ellagitannins 25 (weak) – –
Vescalin – – –
Castalin – – –
Roburin A 20 (weak) – 170 (weak)
Roburin B 30 (weak) – 20 (weak)
Roburin C 60–80 and 80, 180 (weak) –
180 (weak)
Grandinin – 180 (weak) –
Roburin D – – –
Vescalagin 25 (weak) – –
Roburin E – 40–60 and 180 (weak) –
Castalagin 30 (weak) 60 (weak)
Total ellagitannins 25 (weak) – 60 (weak)
(48.4 mg/g vs. 34.4 for sessile oak). Even if the mean con-
tents are statistically different between species, it is not clear
cut, since the pedunculate oak contents overlap with those of
the sessile oak. Ellagitannin content was found to be correlated
with ring width in pedunculate oak but not in sessile oak.
In the future, the chemical composition could be corre-
lated with other characters such as morphology, architecture,
growth, wood quality and molecular genetic data.
Acknowledgements: The authors thank J.M. Louvet (INRA Bor-
deaux) for sample collection and A. Perrin (INRA Nancy) for sample
preparation. The ONF services in La Petite Charnie National Forest,
Le Mans, Orléans and Fontainebleau which organized the timberyard
and gave the logs. They have provided precious raw material and an
unrivalled collection for research. We thank also R. Petit for helpful
advice on this manuscript.
REFERENCES
[1] Ackermann F., Étude de l’influence du type de station forestière
sur la qualité du bois de chêne pédonculé (Quercus rob ur) dans les
chênaies de l’Adour et des côteaux basco-béarnais, Ann. Sci. For.
52 (1995) 635–652.
[2] Bacilieri R., Ducousso A., Kremer A., Genetic, morphological, eco-
logical and phenological differentiation between Quercus p etraea
(Matt) Liebl. and Quercus robur L. in a mixed stand of Northwest
of France, Silvae Genet. 44 (1994) 1–10.
[3] Bacilieri R., Labbé T., Kremer A., Intraspecific genetic structure in
a mixed population of Quercus petraea (Matt.) Leibl. and Q. robur
L., Heredity 73 (1994) 130–141.
[4] Bergès L., Chevalier R., Dumas Y., Franc A., Gilbert J M., Sessile
oak (Quer cus petraea Liebl.) site index variations in relation to cli-
mate, topography and soil in even-aged high-forest stands in north-
ern France, Ann. For. Sci. 62 (2005) 391–402.
[5] Chatonnet P., Dubourdieu D., Comparative study of the character-
istics of American white oak (Quercus alba) and European oak
(Quercus petraea and Quer cus rob ur) for production of barrels used
in barrel aging of wines, Am. J. Enol. Vitic. 49 (1998) 79–85.
424 A. Prida et al.
[6] Conde E., Cadahia E., Garcia-Vallejo M.C., Fernandez de Simon
B., Polyphenolic composition of Quercus suber cork from different
Spanish provenances, J. Agric. Food Chem. 46 (1998) 3166–3171.
[7] Courtois H., Elling W., Busch A., Influence de la largeur du cerne
annuel et de l’âge sur la structure microscopique du bois de chêne
sessile et du chêne pédonculé, Centralblatt 5-6 (1964) 181–190.
[8] Degen B., Petit R., Kremer A., SGS—Spatial Genetic Software: A
computer program for analysis of spatial genetic and phenotypic
structures of individuals and populations, J. Heredity 92 (2001)
447–448.
[9] Deichsel G., Trampisch H.J., Clusteranalyse und Diskriminanz-
analyse, Gustav Fischer, Verlag, Stuttgart, 1985.
[10] Degron R., Nepveu, G., Prévision de la variabilité intra- et inter-
arbre de la densité du bois de chêne rouvre (Quercus petraea Liebl.)
par modélisation des largeurs et des densités des bois initial et final
en fonction de l’âge cambial, de la largeur de cerne et du niveau
dans l’arbre, Ann. Sci. For. 53 (1996) 1019–1030.
[11] Del Alamo M., Bernal J., Gomez-Cordovés C., Behaviour of
monosaccharides, phenolic compounds, and color of red wines aged
in used oak barrels and in the bottle, J. Agric. Food Chem. 48 (2000)
4613–4618.
[12] Diaz-Maroto I.J., Vila-Lameiro P., Silva-Pando F.J., Autoécologie
des chênaies de Quercus robur L. en Galice (Espagne), Ann. For.
Sci. 62 (2005) 737–749.
[13] Doussot F., Variabilité des teneurs en extractibles des chênes ses-
siles (Quercus petraea Liebl.) et pédonculé (Quer cus robur L.)
– Influence sur l’élevage des vins, Thèse, Université Bordeaux I,
2000, 360 p.
[14] Doussot F., Pardon P., Dedier J., De Jeso B., Individual, species and
geographical origin influence on cooperage oak extractible content
(Quercus robur L. and Quercus petraea Liebl.), Analusis 28 (2000)
960–965.
[15] Eyono Owondi E., Modélisation de la rétractibilité du bois en rela-
tion avec des paramètres de la structure de l’accroissement annuel
et de la position dans l’arbre chez Quer cus robur L. et Quercus pe-
traea Liebl. Application à l’intégration de la rétractibilité du bois,
Thèse de Docteur de l’Engref en Sciences du Bois, 1992, 233 p.
[16] Fernandez de Simon B., Cadahia E., Conde E., Garcia-Vallejo M.C.,
Ellagitannins in woods of Spanish, French and American oaks,
Holzforschung 53, 2 (1999) 147–150.
[17] Feuillat F., Keller R., Huber F., « Grain » et qualité du chêne de
tonnellerie (Quer cus robur L., Quercus petraea Liebl.). Mythe ou
réalité ? Rev. Œnol. 87 (1998) 11–15.
[18] Guerra C., Glories Y., Vivas N., Influence des ellagitanins sur les
réactions de condensation flavonols/anthocyanes/éthanal, J. Coop.
Sci. Tech. 2 (1996) 89–95.
[19] Guilley E., Nepveu G., Interprétation anatomique des composantes
d’un modèle mixte de densité du bois chez le chêne sessile (Quercus
petraea Liebl.) : âge du cerne compté depuis la moelle, largeur de
cerne, arbre, variabilité interannuelle et duraminisation, Ann. For.
Sci. 60 (2003) 331–346.
[20] Guilley E., Hervé J.C., Huber F., Nepveu G., Modelling variability
of within-ring density components in Quercus petraea Liebl. with
mixed-effect models and simulating the influence of contrasting sil-
vicultures on wood density, Ann. For. Sci. 56 (1999) 449–458.
[21] Haslam E., Liley T.H., New phenols for old tannins, in: Van
Suemere C.G., Lea J.P. (Eds.), Annual proceeding of the phy-
tochemical society of Europe, Clarendon Press, Oxford, 1985,
pp. 237–256.
[22] Keller R., Les chênes dans le monde. Les chênes de tonnellerie
en France : Quercus petraea et Quercus r obur, Conn. Vigne Vin
Numéro spécial (1992) 7–28.
[23] Klumpers J., Janin G., Becker M., Lévy G., The influences of age,
extractive content and soil water on wood color in oak: the possi-
ble genetic determination of wood colour, Ann. For. Sci. 50 (1993)
403–409.
[24] Klumpers J., Scalbert A., Janin G., Ellagitannins in European oak
wood: polymerization during wood aging, Phytochem. 36 (1994)
1249–1252.
[25] Lebourgeois F., Cousseau G., Ducos Y., Étude d’une chênaie sessili-
flore exceptionnelle : la Futaie des Clos (Sarthe), Rev. For. Fr. 55
(2003) 333–346.
[26] Le Hir R., Pelleschi-Travier S., Viémont J D., Leduc N., Sucrose
synthetase expression pattern in the rhythmically growing shoot of
common oak (Quercus robur L.), Ann. For. Sci. 62 (2005) 585–591.
[27] Masson G., Puech J L., Moutounet M., Localization of the ellagi-
tannins in the tissues of Quer cus robur and Quercus petraea woods,
Phytochem. 37 (1994) 1245–1249.
[28] Masson G., Moutounet M., Puech J L., Ellagitannin content of oak
wood as a function of species and of sampling position in the tree,
Am. J. Enol. Vitic. 46 (1995) 262–268.
[29] Mosedale J., Savill P., Variation of heartwood phenolics and oak
lactones between the species and phenological types of Quercus pe-
traea and Quercus robur, Forestry 69 (1996) 47–55.
[30] Mosedale J.R., Charrier B., Crouch N., Janin G., Savill P., Variation
in the composition and content of ellagitannins of European oaks
(Quercus robur and Quercus petraea). A comparison of two French
forests and variation, Ann. For. Sci. 53 (1996) 1005–1018.
[31] Mosedale J., Charrier B., Janin G., Genetic control of wood colour,
density and heartwood ellagitannin concentration in European oak
(Quercus petraea and Q. rob u r), Forestry 69 (1996) 11–124.
[32] Mosedale J., Feuillat F., Baumes R., Dupouey J L., Puech J.L.,
Variability of wood extractives among Quercus robur and Quercus
petraea trees from mixed stands and their relation to wood anatomy
and leaf morphology, Can. J. For. Res. 28 (1998) 1–13.
[33] Mosedale J., Puech J L., Feuillat F., The influence on wine flavor
of the oak species and natural variation of heartwood components,
Am. J. Enol. Vitic. 50 (1999) 503–512.
[34] Prida A., Dumonceaud O., Puech J L., Ellagitannins in oak and
chestnut wood, Vinodel. Vinograd. 23 (2002) 225–228.
[35] Puech J L., Mertz C., Michon V., Le Guerneve C., Doco T., Du
Penhoat C., Evolution of castalagin and vescalagin in ethanol so-
lutions. Identification of new derivatives, J. Agric. Food Chem. 47
(1999) 2060–2066.
[36] Rozas V., Dendrochronology of pedunculate oak (Quer cus robur L.)
in an old-growth pollarded woodland in northern Spain: tree-ring
growth responses to climate, Ann. For. Sci. 62 (2005) 209–218.
[37] SAS Institute Inc., SAS/STAT
TM
Guide for Personal Computers,
Version 6 Edition, Cary, NC:SAS Institute Inc., 1987, 1028 p.
[38] Singleton V., Barrels for wine, usage and significant variables, J.
Coop. Sci. Tech. 6 (2000) 1–13.
[39] Snakkers G., Nepveu G., Guilley E., Cantagrel R., Variabilités géo-
graphique, sylvicole et individuelle de la teneur en extractibles de
chênes sessiles français (Quercus petraea Liebl.) : polyphénols, oc-
talactones et phénols volatils, Ann. For. Sci. 57 (2000) 251–260.
[40] Sork V.L., Stowe K.A., Hochwender C., Evidence for local adap-
tation in closely adjacent subpopulations of northern red oak
(Quercus rubra L.) expressed as resistance to leaf herbivores, Amer.
Natur. 142 (1993) 928–936.
[41] Streiff R., Labbe T., Bacilieri R., Steinkellner H., Glossl J., Kremer
A., Within-population genetic structure in Quercus robur L. and
Quer cus petraea (Matt.) Liebl. assessed with isozymes and mi-
crosatellites, Mol. Ecol. 7 (1998) 317–328.
[42] Viriot C., Scalbert A., Hervé du Penhoat C., Moutounet M.,
Ellagitannins in woods of sessile oak and sweet chestnut: dimer-
ization and hydrolysis during wood ageing, Phytochem. 36 (1994)
1253–1260.
[43] Vivas N., Glories Y., Role of oak wood ellagitannins in the oxidation
process of red wines during aging, Am. J. Enol. Vitic. 47 (1996)
103–107.
[44] Vivas N., Glories Y., Bourgeois G., Vitry C., The heartwood el-
lagitannins of different oak (Quercus sp.) and chestnut species
(Castanea sativa Mill.). Quantity analysis of red wines aging in bar-
rels, J. Coop. Sci. Tech. 2 (1996) 25–49.