Báo cáo lâm nghiệp:" Comparison of soil water-contents as measured with a neutron probe and time domain reflectometry in a " ppsx
Bạn đang xem bản rút gọn của tài liệu. Xem và tải ngay bản đầy đủ của tài liệu tại đây (273.13 KB, 9 trang )
185
Ann. For. Sci. 60 (2003) 185–193
© INRA, EDP Sciences, 2003
DOI: 10.1051/forest:2003011
Original article
Comparison of soil water-contents as measured with a neutron probe
and time domain reflectometry in a Mediterranean forest
(“Sierra de Gata”, Central Western Spain)
María Amparo Vicente
a
, Juan Fernando Gallardo
a
*, Gerardo Moreno
b
and María Isabel González
c
a
Consejo Superior de Investigaciones Científicas, Aptdo. 257, Salamanca 37071, Spain
b
Centro Universitario, Universidad de Extremadura, Plasencia 10600, Cáceres, Spain
c
Área de Edafología, Universidad de Salamanca, Salamanca 37080, Spain
(Received 12 December 2001; accepted 27 November 2002)
Abstract – The present work compares the results obtained with two indirect techniques (neutron probe and time domain reflectometry, TDR)
for measuring soil water contents (q) at different depths on an experimental plot in the “Sierra de Gata” (Central Western Spain). At the same
time, the temporal and spatial evolution of q was assessed in the zone studied. Measurements were made over three years (from September 1996
to August 1999). The results point to a good correlation (r = 0.98) between q measured with both techniques, although TDR slightly (but
significantly; P < 0.01) underestimated the q values, but only during the drying periods and with low q values. Non-significant differences
between both methods were found for the estimation of soil water contents in the whole soil profile. Accordingly, both techniques are
interchangeable and it is thus possible to avoid the potential risk of radioactivity. Considerable inter-annual variability was observed in the soil
water content, governed by the annual rainfall distribution. A “flowing-off” effect was observed, followed by a progressive re-wetting of the
soil profile from the bottom. Both the temporal and spatial variabilities of soil water content were found to decrease with depth.
soil water-content / neutron probe / TDR / oak forests / Western Spain / Mediterranean climate
Résumé – Comparaison des mesures de teneurs en eau du sol effectuées par sonde à neutrons et TDR dans une forêt méditerranéenne
(« Sierra de Gata », Espagne Centre-Ouest). Le présent travail avait pour objectif de comparer deux méthodes indirectes de mesure de la
teneur en eau (q) du sol : sonde à neutrons et TDR (Time Domain Reflectometry) dans le cas d’une parcelle forestière située dans la « Sierra
de Gata », région du Centre-Ouest de l’Espagne. Les aspects de variabilités temporelle et spatiale ont été également abordés. Une campagne
de mesures s’est poursuivie de septembre 1996 jusqu’à août 1999, soit près de 3 ans. Les résultats obtenus montrent une bonne corrélation (r =
0,98) entre q mesurées avec les deux techniques. L’estimation de la teneur en eau du sol pour l’ensemble du profil montre des différences non
significatives (P > 0,05), bien que le TDR sous-estime légèrement (mais de façon significative ; P < 0.01) les valeurs de q seulement quand le
sol s’assèche et pour des valeurs de q faibles. Les deux techniques sont donc a-priori interchangeables et il est donc possible d’envisager le
remplacement des méthodes nucléaires et d’éviter ainsi les risques correspondants. Sur le plan de l’hydrologie, on a constaté une variabilité,
temporelle et spatiale, décroissante avec la profondeur du sol et une considérable variabilité inter-annuelle liée aux fluctuations du régime des
pluies. Enfin, un phénomène de transfert rapide vers le bas suivi d’une réhumectation par inhibition vers le haut a été également mis en évidence.
humidité du sol / sonde à neutrons / TDR / chênais / Espagne occidentale / climat mediterranéen
1. INTRODUCTION
The soil water content is a key factor in the functioning of
terrestrial ecosystems, being of fundamental importance to
many hydrological, biological and biogeochemical processes.
In particular, the soil water content provides useful
information about the actual evapotranspiration, drainage, and
leaching [14]. Over the past decade, interest in water fluxes in
natural ecosystems has increased owing to the appearance of
evidence of changes in the annual distribution of rainfall and a
hypothetical reduction in the actual evapotranspiration as a
consequence of the global change [4, 21], and also
hydrological changes induced by water management [1]. The
need for such knowledge is most important in Mediterranean
areas, where water is frequently the first limiting factor to
plant growth [20].
The accuracy of the information derived from soil water
measurements depends on the time and space scales of soil
moisture measurements [7, 14]. Many methods can be used to
measure soil water contents, and they can be classified as
direct or indirect [11].
*
Correspondence and reprints
Tel.: (34) 923219606; fax: (34) 923219609; e-mail:
186 M.A. Vicente et al.
Direct methods require the collection of soil samples from
the field each time it is desired to know the moisture content.
However, the need for successive soil sampling leads to an
irreversible alteration of the soil profile (increasing the
number of core holes with time), which can eventually affect
the real water-flow inside of the original soil-profile. Also, the
measurements cannot be repeated at the same point and it is
therefore necessary to monitor the spatial variability very
precisely in order to be able to study variations occurring with
time. Although these direct methods are destructive and very
high time-consuming, they afford very precise measurements
of the soil-water content, and (usually the thermo-gravimetry
method) are therefore used in the calibration of indirect
methods.
Indirect or non-destructive methods are based on the
measurement of a physical property of the soil that depends on
the soil-water content. Sensors permanently installed in the
soil are used and these must be connected to a measuring unit
each time measurements are made; alternatively, soil sensors
are placed using an access tube (previously installed in the
ground) each time measurements are to be made. Such
successive measurements taken over time do not destroy the
soil, although they often require tedious prior calibrations. The
most widely used non-destructive indirect methods are [34]
the neutron-probe technique, dielectric methods (time-
domain reflectometry and capacitance techniques), electrical-
resistance methods, thermal conductivity (heat dissipation),
and gypsum blocks.
The neutron-probe method has been widely implemented
and is currently used as an acceptable method [5] and indeed
is sometimes used as the reference method. However, apart
from the need for special precautions against radioactivity,
this method is sensitive to bulk soil density, a calibration for
each soil type and each soil horizon being necessary [5].
Another important disadvantage of the use of the neutron
probe (NP) is the difficulty involved in its automation, which
has prevented generalisation of the technique [34].
More recently, time domain reflectometry (TDR) has been
the method most widely used, and it is currently displacing
other “classic” methods used to measure soil water contents
owing its reliability and handling speed [26]. The TDR
technique is based on measurement of the soil dielectric
constant (K
m
). To achieve this, a high frequency
electromagnetic pulse is sent into the soil through a wave-
guide. When this step encounters impedance mismatches at
the end of the probe, or at the interface between regions of
different permittivities, part of the signal is reflected back and
the apparatus detects and processes this signal. The speed of
propagation of this wave depends on the dielectric soil
permittivity of the medium (K
m
):
(1)
where t is the round-trip time, L is the wave-guide length, and
c is the velocity of the electromagnetic waves in free space.
The term ct/2 can be reduced to an apparent probe length (La),
where La is determined as the distance between reflections at
the beginning and at the end of the probe [17].
Rearranging equation (1), K
m
is then calculated as:
K
m
= (La / L)
2
.(2)
K
m
depends on the proportion of each soil phase (water, air
and mineral solids).
The dielectric constant of water (K
w
), which is
temperature-dependent, ranges from 74 to 84 and is about 20-
fold higher than that of mineral solids (between 3 and 5), and
about 80-fold higher than that of air (1.0005 at 20 ºC and
10
5
Pa). This large difference between the dielectric constant
of water and the rest of the soil phases means that the K
m
is
highly sensitive to the water content [27].
Based on this, Topp et al. [27] proposed an empirical
formula to calculate the volumetric water content from the soil
dielectric constant as determined by TDR. This relationship
has been widely used in the literature because of its assumed
low sensitivity to soil bulk density [17]. Nevertheless, some
authors have noted the poor reliability of this equation when
working with soil types different from those initially used to
determine it [10]. In this sense, Roth et al. [23] demonstrated
that this equation is only valid for soils with apparent densities
greater than 1.55 g cm
–3
, which is not the case for forest soils.
Therefore, many other relationships were proposed and efforts
must be made to validate them [17].
Most comparative studies addressing the techniques used
for measuring soil water contents refer to comparisons of an
indirect method with another direct one: traditionally
gravimetry [18, 19, 25, 28]. The literature contains very few
references to works that compare different indirect methods in
the field [8, 13, 33]. Accordingly, the aim of the present work
was to compare the results obtained in the measurement of
soil-water contents obtained using a NP and TDR. At the same
time, the temporal and spatial evolution of the soil-water
content was studied at different depths in the research zone.
2. MATERIALS AND METHODS
2.1. Study area
The study area is located in the vicinity of “El Rebollar” (“Sierra
de Gata”, central-western Spain). The coordinates of the
experimental plot are 40º 2’ 40’’ N, 3º 0’ 50’’ W and it is located at
an altitude of 960 m above sea level. The soil types feature a
predominance of haplic Umbrisols [3]. The vegetation comprises the
Atlantic oak (Quercus pyrenaica). Further information can be found
in tables I and II, and in Turrión et al. [29].
2.2. Data collection: neutron probe
A Troxler 3321A NP (
241
Am:Be 10 GBq nuclear source) device
was used. This system includes a
3
He detector to count thermalised
neutrons (neutron exit activity < 0.005 GBq).
Measurements were taken in 12 PVC 6-cm diameter access tubes.
These tubes had been introduced six years earlier (in 1990) into the
ground down to the bedrock, to a maximum soil depth of 110 cm
(ranging from – 50 to –110 cm). Readings were taken every 20 cm,
from –20 cm to –100 cm (as referred to the centre of the
measurements), taking into account the sphere of influence, which
varies inversely with the water content, although an average 20-cm
diameter can be assumed [5].
Soil moisture readings were taken every 15 days from September
5th 1996 to August 19th 1998 and, thereafter monthly up to August
16th 1999. During March and April 1997 it was not possible to take
t 2LK
m
1/2
c¤=
Comparison between neutron probe and TDR 187
readings due to problems with the authorities responsible for
regulating the use of radioactive materials. Overall, data were
collected on 52 occasions.
Surface moisture was determined gravimetrically, since using the
NP for surface measurements (< 5 cm) is rather tedious because
reflectors must placed at the interface to prevent neutrons from
escaping into the atmosphere [15], thereby artificially extending the
measured soil volume. Twelve samples of about 100 g were taken on
the same dates as the neutron probe measurements were recorded and
were oven-dried for 24 hours.
The calibration curves for this specific site were determined from
gravimetric samples and dry soil bulk densities, according to
Table I. Characteristics of the forest plot at Navasfrías (province of Salamanca, Western Spain).
Relief: Mountainous
Physiography: Slope, 5 to 15%
Orientation: East
Altitude: 960 m above sea level
Climate: Humid Mediterranean
Mean annual rainfall:
1580 mm a
–1
Mean annual temperature: 10.4 ºC
Potential evapotranspiration:
800 mm a
–1
Bedrock: Paleozoic, schists, grauwackes
Rock outcrops: Occasional
Soil typology: Haplic and Cambic Umbrisols
Vegetation: Quercus pyrenaica, Pteridium aquilinum, Cytisus scoparius, Erica australis
Forest management: Coppice
Human influence: Last thinning: 30 years ago
Tree density:
820 trees ha
–1
Mean height of trees: 13 m
Mean D.B.H.: 16.5 cm
Foliar index:
1.8 m
2
m
–2
Basal area:
15.63 m
2
ha
–1
Aboveground biomass:
64.53 Mg ha
–1
Mean annual aboveground production:
2.60 Mg ha
–1
a
–1
(D.B.H.: diameter at breast height).
Table II. Forest soil properties of Navasfrías district (province of Salamanca, Western Spain).
Soil properties Soil horizons
A
h1
A
h2
B
w
C
Depth (cm) 0–20 20–40 40–70 > 70
Stones and gravels (> 2 mm, %) 32 39 48 42
Clay (%) 18181720
Soil organic matter (%) 17 11 1.0 0.5
Bulk density (g cm
–3
)
0.7 0.9 1.2 1.4
Total porosity (cm
3
cm
–3
)
0.65 0.63 0.60 0.48
Soil micro-porosity (cm
3
cm
–3
)
0.33 0.30 0.32 0.36
Soil-water content –1.5 MPa (cm
3
cm
–3
)
0.18 0.15 0.10 0.15
Available water (cm
3
cm
–3
)
0.15 0.15 0.22 0.21
Fine root length density (cm cm
–3
)
64<1No data
Fine root biomass (mg cm
–3
)
64<1No data
188 M.A. Vicente et al.
Vachaud et al. [30]. Two set of data were used: soil cores, for the
simultaneous determination of soil bulk-density, and gravimetric
water-contents, were taken by digging around four additional access
tubes. Each tube was digged on a different date, covering the different
statuses of soil moisture contents.
Additionally, soil samples for water-content determination were
taken with an auger near the twelve permanent access-tubes (between
1 and 2 m away) at the same depth as the NP readings, on different
dates along three years (24 data per depth). Samples for the
determination of soil bulk density were taken at the beginning of the
study in three holes dug into the soil of the plot (two samples per
hole).
2.3. Data collection: TDR
The TDR apparatus employed was a Tektronix model 1502C
(metal cable tester), which was handled manually.
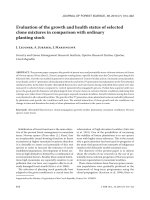
Sixteen sensors were constructed: each comprised three parallel
rods (similar to a trident; figure 1) made of stainless steel, 200 mm in
length and sharpened at one end to facilitate their introduction into
the soil. Rod diameter was 6 mm and the separation between their
axes –30 mm– was chosen after Zegelin et al. [36]. The central rod
was connected to the main conductor of a low ohm-resistance coaxial
cable and the rods at either side were connected to the mesh of the
cable. The probe thus simulates a coaxial cell, and does not need an
impedance-matching transformer [17].
All connections were coated with an epoxy resin (Struers kit
EPOFIX
®
) which acted as an electrical insulator, at the same time
firmly holding the rods in the parallel position.
The sixteen trident sensors were placed vertically in the soil at
different depths: from 0 to –20 cm; from –20 to –40 cm; from –40 to
–60 cm and from –60 to –80 cm. Each sensor was separated from its
neighbour by at least 50 cm; that is, 4 sensors for each depth. During
installation, efforts were made to ensure maximum contact between
the rods and the soil.
To calculate soil moisture contents, we used a combination of the
empirical and physical models proposed by Dobson et al. [2],
modified by Roth et al. [24]. This type of model incorporates into its
corresponding equation the contribution of each soil phase to the
dielectric constant of the medium. Thus, it takes into account the
effects of variations in other parameters, such as soil porosity and
temperature. It is therefore well adapted when considering different
soil types such as in the present study.
The equation used was [24]:
(3)
where q is the volumetric water content (in cm
3
cm
–3
) of the soil; K
m
is the relative soil dielectric-constant (adimensional); K
w
is the
relative water dielectric-constant (no unit); K
s
is the relative dielectric
constant of the mineral solids of the soil (a value of 4 was taken);
h is the soil porosity at each point (cm
3
cm
–3
), and a is the anisotropy
coefficient of the medium. Based on experimental data, Jacobsen
et al. [10] have shown that a varies between 0.4 and 0.8, and Zakri
et al. [35] demonstrated the physical meaning of this “a-model”
(based on the Effective Medium Theory). However, we assumed a =
0.5, following Dobson et al. [2] and Roth et al. [24], owing to the
difficulty involved in obtaining a reliable determination of a.
K
w
was considered as a function of the soil temperature [32]:
K
w
= 78.54 [1 – 4.579 10
–3
(t – 25) + 1.19 10
–5
(t–25)
2
– 2.8 10
–8
(t – 25)
3
]. (4)
Soil temperature was measured with permanently buried
thermistors protected in a stainless steel sheath (UNIDATA, model
6507A; resolution ± 0.5 ºC). Sensors were located at –10, –30 and
–50 cm depth and were connected to a datalogger (UNIDATA, Starlog
7000 B). Soil temperature at the 50-cm depth was considered applicable
for TDR probes located at –40 to –60 cm depth and also for those located
at –60 to –80-cm depth, owing to the limited soil temperature variation
at such depths.
2.4. Statistical analysis
For comparative purposes, moisture measurements with TDR (55
dates) and NP (52 dates) were performed on the same days (51 times,
4 depths). Linear regression was applied to show the relationships
between soil water contents measured with both methods. Similarly,
linear regressions were applied at each depth.
To establish an overall comparison between the volumetric water
content data measured with both methods, a t-test for paired data was
used. The differences between both measuring methods at different
depths were tested by means of two-way ANOVA, with depth as the
between-sample factor, and method as the within-sample (repeated
measurements) factor, using average values for each date, as the
independent values. Similar analyses were applied to test the
differences between the methods, considering four different ranges of
volumetric water content (0.07–0.14; 0.14–0.21; 0.21–0.28 and 0.28–
0.35 cm
3
cm
–3
) and, finally, considering different periods (wetting,
steady-state, and drying). Tukey tests, with the Newman-Keuls’
method, were used for multiple comparisons of means when
significant differences were indicated by ANOVA, the differences
being considered significant at P < 0.05.
3. RESULTS AND DISCUSSION
3.1. Neutron probe calibration
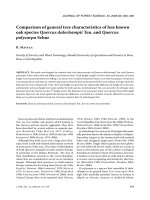
The best linear relationships between the NP readings and
volumetric water contents (thermogravimetry data multiplied
by the soil bulk-density) were obtained by grouping the data in
three different ranges of soil bulk density (0.85 to 1.25, 1.26 to
1.60, and 1.60 to 2.00; figure 2) because of the direct influence
of the soil bulk-density in neutron thermalization [5]. The
results indicated that low soil water contents (
q) were slightly
Figure 1. Diagram of the TDR sensor: three parallel rods.
q K
m
a
1 h–()K
s
a
h–()–[]K
w
a
1–(),¤=
Comparison between neutron probe and TDR 189
overestimated with the NP method, whereas high q were
slightly underestimated. At low densities, the bias was higher
at high
q, while at high densities the bias was higher at low q.
The variability not explained by these relationships (r
2
even
lower than 0.70) could be due to the high spatial variability
of
q due, for instance, to the presence of stones or roots [7, 30]
and to the fact that the gravimetric and NP data did not refer
exactly to the same place. Moreover, soil samples for the
gravimetric determination of water contents and those for the
determination of bulk density were obviously not taken at
exactly the same places (or dates).
Nevertheless, these three relationships (figure 2) were
highly significant (P < 0.01). Thus, they were applied to the
determination of the volumetric water content in the field and
used also for the TDR calibration.
3.2. Comparison between the NP and TDR techniques
3.2.1. Comparison between soil-profile moistures
obtained with both methods
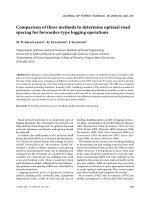
On comparing the seasonal variation of water contents of
the soil profile (considering the first 80 cm of soil) determined
with both techniques (figure 3), non-significant differences
were found: paired–t test; P > 0.05; n = 51. This would
theoretically demonstrate the possibility of replacing NP by
TDR. Nevertheless, slight differences were still observed
between both methods, with maximum and minimum values
slightly higher and lower, respectively, with TDR than with NP.
Measurements of soil moisture carried out with both
techniques were performed at different depths owing to
methodological problems: –20, –40, –60, –80 and –100 cm
for the NP (assuming a sphere of 20 cm-diameter); and 0–20,
20–40, 40–60 and 60–80 cm for TDR.
It is therefore not possible to make a very strict comparison
of the results. In order to compare both methods, the mean
values obtained with two consecutive NP-readings were used.
That is,
q was calculated for instance at 20–40 cm as an
average between the readings at –20 and –40 cm.
Figure 4 shows the linear relationships between the soil-
moisture values obtained with both techniques. A highly
significant correlation was obtained (r = 0.984; P < 0.01; n =
51 measures
´ 4 depths = 204).
Other authors have made comparisons between the TDR
technique and gravimetry, obtaining good correlations regard-
less of the calibration employed. Thus, Rabadá and Gallart
[19] obtained a correlation coefficient of r = 0.997. Gaskin and
Miller [6], also using an electric method (an impedance ana-
lyser), also found good correlations (r = 0.986) for forest-floor
Figure 2. Results of the lineal regressions between soil-water content measured by a direct method (thermogravimetry) and by neutron probe
(original calibration). Three groups of data were established in function of the soil bulk-density.
190 M.A. Vicente et al.
moisture determinations. Topp et al. [28] concluded that both
methods are equal when rods longer than 10 cm are used. Fur-
thermore, in a laboratory study Yoder et al. [34] failed to find
significant differences between the NP and 4-rod TDR tech-
niques for a broad range of water contents; however, those
authors did find significant differences when using 2-rod TDR
probes, with which they obtained poorer results.
By contrast, we observed an important bias with respect to
the 1:1 line in the low water content range (figure 4). Indeed,
on applying two-way ANOVA, a significant difference
between both data sets was found (degrees of freedom = 1;
201; P = 8.2
´ 10
–6
; table III); TDR afforded slightly
underestimated values of
q as compared to NP (0.218 versus
0.222 cm
3
cm
–3
). Salas et al. [25] also found that TDR
underestimated
q.
3.2.2. Comparison of soil moisture by ranges
A significant interaction was found between the range of
q
and probe type in the ANOVA analysis (d.f. = 3; 200; P =
1.2
´ 10
–8
; table III). From analysis of the interaction, we
found that only for a low range of q (0.08–0.14 cm
3
cm
–3
)
were the differences significant (d.f. = 1; 200; P = 0.007), TDR
underestimating the
q values. At higher q, non-significant
differences were found (table III).
Other authors have also reported that the similarity of the
results varies as a function of the water content, although with
different conclusions. Yoder et al. [34] found that the
resolution of TDR was better for high moisture contents. By
contrast, Topp et al. [28] observed that the TDR technique
overestimated
q for high water contents. Jacobsen and
Schjonning [9], using different calibrations methods for TDR,
also obtained a higher bias with higher
q values. Finally, Salas
Figure 3. Seasonal variation of the soil-water contents (first –80-cm of depth) along 3 years, measured by two methods: TDR and neutron
probe. Data about monthly rainfall are also shown as bars.
Figure 4. Lineal regressions between values volumetric water
content of the soil studied, measured with two indirect methods: TDR
and neutron probe.
Comparison between neutron probe and TDR 191
et al. [25] obtained TDR data that underestimated q for any
range of soil water contents.
3.2.3. Comparison by periods
It is well known that, apart from the water content, TDR
reading depends on the size of the pores containing the water
[17]. This is very important when the soil is undergoing drying
and wetting because soil pores that contain water differ
between these periods. Therefore, the results may thus differ
even though the same water content is involved, depending on
whether the soil is being wetted or being dried.
To carry out this comparison, we grouped the data in three
categories as a function of the variation in
q between two
consecutive readings (fortnightly): drying, wetting, and
steady-state (when the difference was lower than 4 cm
3
cm
–3
).
The significant interaction found between period and probe
type in the ANOVA analysis (d.f. = 2; 200; P = 1.2
´ 10
–6
;
table III) is proof of the importance of pore size in the TDR
reading. The bias found when the soil was drying
(–0.8 cm
3
cm
–3
) was greater than in other periods (–0.06 when
undergoing wetting, and 0.10 at steady-state). We checked
that this result was not determined by the difference in range
of
q between the three defined periods; the ANOVA revealed
a non-significant co-variance between periods and the range
of
q (d.f. = 2; 200; P = 0.296).
3.2.4. Comparison by depths
A non-significant interaction was found between depth and
probe type in the ANOVA analysis (d.f. = 3; 200; P = 0.058;
table III). Moreover, very good correlations were found
between TDR and NP readings at all depths. Nevertheless, the
results of the regressions improves with depth (table IV) and
the differences observed at 0–20 cm were slightly higher
(although non-significant) than those at deeper layers,
probably because the degree of wetting/drying is more
pronounced at 0–20 cm. Also, the increase in soil bulk-density
with depth, which leads to greater soil homogeneity [11, 15],
could contribute to the improvement of the results with depth.
Salas et al. [25] also observed greater differences between the
gravimetric and TDR techniques for the first 30 cm of soil
depth (greater heterogeneity).
3.3. Temporal variation of the moisture profile
Considerable interannual variation in soil water contents
was observed (figure 3). The rainfall over the three-year study
period was 1655, 2104, and 957 mm, respectively.
Figure 3 also shows a clear seasonal variation, characteris-
tic of Mediterranean climate. It is possible to observe two
well-differentiated periods among all the years studied: over-
all, there is a wet period lasting approximately from November
to June, (depending on the year in question) and a dry period
from June to November [31].
A more reduced temporal variation in
q was seen in deep
layers since the surface is re-humidified and dried more often;
indeed every time it rains. Standard temporal deviations were
(±) 0.074, 0.056, 0.059 and 0.057 cm
3
cm
–3
for the 0–20,
20–40, 40–60 and 60–80 cm layers, respectively. This is a
common phenomenon and has been described by many
authors [12, 19]. It is an effect involving two processes:
Evaporation from the soil surface, and water uptake by roots;
mainly in the upper –40 cm (table II). Considering only the
spatial variation, the standard deviations also decreased with
depth: (±) 0.026, 0.019, 0.016, and 0.015 cm
3
cm
–3
for 0–20,
20–40, 40–60 and 60–80 cm, respectively.
Generally, the soil water content increased with depth,
although in some short periods the opposite was found, mainly
with the first rainfall (autumn; figure 5). Soil humidity, in
terms of both extreme and mean values, increased gradually
with the depth of the soil; the minimum value was found at the
surface, as expected (owing to a more marked drying process
at the soil surface). After the dry summer period and
continuous rainfalls, there are two sources of soil wetting: one
from the soil surface downwards, and the other from deep
layers upwards, beside the lateral water displacement
described by other authors [1]. This demands the prior
existence of a phenomenon termed “flowing off” by Rode
[22], which involves excess water rapidly flowing down to
deep layers due to excessive water weight and/or through
preferential flow paths [16].
4. CONCLUSIONS
Significant differences were observed, mainly at low soil-
water content values, between the NP and TDR readings. The
soil-moisture values obtained with the former method were in
general slightly higher than those obtained using the latter
Table III. Summary of the ANOVA results (two-way ANOVA with
paired-values): (a) Probe type and depth (0–20, 20–40, 40–60
and 60–80 cm); (b) Probe type and range of soil moisture (0.08–
0.14, 0.14–0.21, 0.21–0.28 and 0.28–0.35 cm
3
cm
–3
); (c) Probe type
and period (wetting, drying, and steady state).
Effect D.f. F P
Probe type 1; 201 20.98
8.2 10
–6
Depth ´ Probe type 3; 200 2.53 0.058
Range q ´ Probe type 3; 200 14.62
1.2 10
–8
Period ´ Probe type 2; 201 14.63
1.2 10
–6
D.f.: degrees of freedom.
Table IV. Resume of results of the lineal regressions between soil
water-content measured with TDR and neutron probe, at different
depths (q
NP
= a + b ´q
TDR
).
Depth a b
r
2
Number
0–80 cm 1.9574 0.9271 0.9682 204
0–20 cm 2.9538 0.8855 0.9755 51
20–40 cm 2.3155 0.9108 0.9518 51
40–60 cm 1.1767 0.9508 0.9679 51
60–80 cm 0.2976 0.9989 0.9764 51
192 M.A. Vicente et al.
technique. However, the bias was low, with an average
difference of –0.004 cm
3
cm
–3
, the range being 0.029 to
–0.032 cm
3
cm
–3
.
Nevertheless, considering the soil-water content through-
out the soil profile, the differences between both methods
were non-significant. Thus, both techniques are interchangea-
ble and it is therefore possible to avoid the potential risk of
radioactive hazard when using the NP method.
The differences between the TDR and NP readings
decreased with both increasing depth and water content. This
may reflect the influence of the size of pores containing water
at the time when TDR measurements are being taken. It could
be also explained (at least partially) in terms of the strong
spatial variation in
q measurements in the upper soil layers (the
same point of the soil is not measured by both techniques), in
addition to the frequent temporal variability and the precision
of the instruments. As observed by Topp and Davis [26], the
sources of error due to instrumental precision and spatial
variability cannot be separated.
The results of the TDR measurements could be improved
by using custom calibration to fit, for instance, the value of
a,
because this parameter varies linearly with soil bulk-density
and may be correlated with many other soil-properties (such as
porosity, mineralogy and particle-size distribution [35]).
Acknowledgements: The authors wish to thank the “Junta de
Castilla y León” for allowing them the use of the forest plot, the
European Union (PROTOS/TERI Project) and the Spanish CICYT
Fund for financial support. The invaluable technical assistance Jesús
Hernández and Miguel Tapia is acknowledged.
REFERENCES
[1] Cermak J., Prax A., Water balance of a southern Moravian
floodplain forest under natural and modified soil water regimes and
its ecological consequences, Ann. Sci. For. 58 (2001) 15–29.
[2] Dobson M.C., Ulaby F.T., Hallikainen M.T., El-Rayes M.A.,
Microwave dielectric behaviour of wet soil. Part II: Dielectric
mixing models, IEEE Trans. Geosci. Remote Sens. GE- 23 (1985)
35–46.
[3] F.A.O., World Reference Base for Soil Resources, F.A.O., Rome,
1998.
[4] Field C.B., Biological scaling of carbon gain to stress and resource
availability, in: Mooney H.A., Winner W.E., Pell E.J. (Eds.),
Response of plants to multiple stresses, Academic Press, San Diego
1991, pp. 35–65.
[5] Gardner C.M.K., Bell J.P., Cooper J.D., Dean T.J., Gardner N.,
Hednett M.G., Soil water content, in: Smith K.A., Mullins C.E.
(Eds.), Soil Analysis Physical Methods, Marcel Dekker, New York,
1991, pp. 1–74.
[6] Gaskin G.J., Miller J.D., Measurement of soil water contents using
a simplified impedance measuring technique, J. Agric. Engineer.
Res. 63 (1996) 153–160.
[7] Haverkamp R.E., Vauclin M., Vachaud G., Error analysis in
estimating soil water content from mention probe measurements. I.
Local standpoint, Soil Sci. 137 (1984) 78–90.
[8] International Atomic Energy Agency. Comparison of soil water
measurement using the neutron scattering, time domain
reflectometry and capacitance methods, IAEA-TECDOC-1137,
Vienna 2000, 165 p.
[9] Jacobsen O.H., Schjonning P., Field evaluation of time domain
reflectometry for soil-water measurements, J. Hydrol. 151 (1993)
159–172.
[10] Jacobsen O.H., Schjonning P., Comparison of TDR calibration
functions for soil water determination, in: Petersen L.W., Jacobsen
O.H. (Eds.), Time-Domain Reflectometry Applications in Soil
Science, Proceedings of the Symposium, Tjele, Denmark, Sept.
1995, SP report 11. Tjele, 1995, pp. 25–33.
Figure 5 Soil-moisture profile obtained with TDR in two different periods: (a) water recharge of the soil; (b) drying process of the soil. Data
obtained with both methods are compared: Neutron probe (black symbol and solid line) and TDR (white symbol and dotted line).
Comparison between neutron probe and TDR 193
[11] Kutilek M., Nielsen D.R., Soil Hydrology Geoecology, textbook,
Catena Verlag-Cremlingen, Germany, 1994.
[12] Ladekarl U.L., Estimation of the components of soil water balance
in a Danish oak stand from measurements of soil moisture using
TDR, For. Ecol. Manage. 104 (1998) 227–238.
[13] Ley T.W., Stevens R.G., Topielec R.R., Neibling W.H., Soil water
monitoring and measurement, Pacific-Northwest Co-operative
Extension Publ. 475 (1994) 1–36.
[14] Mastrorilli M., Katerji N., Rana G., Ben Nouna B., Daily actual
evapotranspiration measured with TDR technique in Mediterranean
conditions, Agric. For. Meteorol. 90 (1998) 81–89.
[15] Moreno G., Gallardo J.F., Ingelmo F., Cuadrado S., Hernández J.,
Soil-water budget in four Quercus pyrenaica forest across a rainfall
gradient, Arid Soil Res. Rehabil. 10 (1996) 65–84.
[16] Moreno G., Gallardo J.F., Schneider K., Ingelmo F., Water and
bioelement fluxes in four Quercus pyrenaica forests along a
pluviometric gradient, Ann. Sci. For. 53 (1996) 625–639.
[17] Noborio N., Measurement of soil water content and electrical
conductivity by time domain reflectometry: a review, Comput.
Electron. Agric. 31 (2001) 213–237.
[18] Noborio K., McInnes K.J., Heilman J.L., Measurements of soil
water content, heat capacity and thermal conductivity with a single
TDR probe, Soil Sci. 161 (1996) 22–28.
[19] Rabadà D., Gallart F., Monitoring soil-water content variability in
the Cal Parisa basin (Alt Llobregat) with TDR. Experimental
design and first results, Acta Geol. Hispan. 28 (1993) 85–93.
[20] Rambal S., The differential role of mechanisms for drought
resistance in a Mediterranean evergreen shrub: a simulation
approach, Plant Cell Environ. 16 (1993) 35–44.
[21] Rambal S., Debussche G., Water balance of Mediterranean
ecosystems under a changing climate, in: Moreno J.C., Oechel
W.C. (Eds.), Global Change and Mediterranean-type ecosystems,
Ecological studies 117, Berlin: Springer-Verlag, 1995, pp. 386–407.
[22] Rode A.A., Soil Science, U.S. Department of Commerce,
Washington DC, 1955.
[23] Roth C.H., Malicki M.A., Plagge R., Empirical evaluation of the
relationship between soil dielectric constant and volumetric water
content and the basis for calibrating soil moisture measurements by
TDR, J. Soil Sci. 43 (1992) 1–13.
[24] Roth K., Schulin R., Flühler H., Attinger W., Calibration of time
domain reflectometry for water content measurement using a
composite dielectric approach, Water Resour. Res. 26 (1990)
2267–2273.
[25] Salas R., Molina E., Bouldin D.R., Calibration of the time-domain
reflectometer and determination of the volumetric water content of
the soil profile in an Ultisol of Costa Rica, Commun. Soil. Sci. Plant
Anal. 27 (1996) 2433–2442.
[26] Topp G.C., Davis J.L., Time-Domain reflectometry (TDR) and its
application to irrigation scheduling, in: Hillel D. (Ed.), Advances in
Irrigation, Academic Press, New York, Vol. 3, 1985, pp. 107–127.
[27] Topp G.C., Davis J.L., Annan A.P., Electromagnetic determination
of soil water content: Measurements in coaxial transmission lines,
Water Resour. Res. 16 (1980) 574–582.
[28] Topp G.C., Davis J.L., Bailey W.G., Zebchuk W.D., The
measurement of soil water content using a portable TDR hand
probe, Can. J. Soil Sci. 64 (1984) 313–321.
[29] Turrión M.B., Gallardo J.F., González M.I., Extraction of soil-
available phosphate, nitrate, and sulphate ions using ion exchange
membranes and determination by ion exchange chromatography,
Soil. Sci. Plant Anal. 30 (1999) 1137–1152.
[30] Vachaud G., Royer J.M., Cooper J.D., Comparison of methods of
calibration of a neutron probe by gravimetric or neutron-capture
model, J. Hydrol. 34 (1977) 343–355.
[31] Vicente M.A., Gallardo J.F., González M.I., Evolution of soil water
in a Mediterranean forest ecosystem (“Sierra de Gata”, Western
Spain), in: Bech J. (Ed.), 6th International Meeting: Soils with
Mediterranean Type of Climate, Extended Abstracts, Barcelona,
Spain, July 4–9, 1999, University of Barcelona, Spain, 1999,
pp. 71–73.
[32] Weast R.C. (Ed.), Handbook of Chemistry and Physics, 68th edn.,
Boca Ratón, Florida, C.R.C. Press, 1987.
[33] Young M.H., Wierenga P.J., Mancino C.F., Large weighing
lysimeters for water use and deep percolation studies, Soil Science
161 (1996) 491–501.
[34] Yoder R.E., Johnson D.L., Wilkerson J.B., Yoder D.C., Soil-water
sensor performance, Appli. Engineer. Agric. 12 (1998) 121–133.
[35] Zakri T., Laurent J.P., Vauclin M., Theoretical evidences for
“Lichtenecker’s mixture formulae” based on the effective medium
theory, J. Phys. D: Appl. Phys. 31 (1998) 1589–1594.
[36] Zegelin S.J., White I., Jenkins D.R., Improved field probes for soil
water content and electrical conductivity measurements using
TDR, Water Resour. Res. 25 (1989) 2367–2376.
To access this journal online:
www.edpsciences.org