Báo cáo lâm nghiệp:"Inter-regional variability in site index models for even-aged stands of stone pine (Pinus pinea L.) in Spain" potx
Bạn đang xem bản rút gọn của tài liệu. Xem và tải ngay bản đầy đủ của tài liệu tại đây (402.8 KB, 11 trang )
259
Ann. For. Sci. 60 (2003) 259–269
© INRA, EDP Sciences, 2003
DOI: 10.1051/forest:2003017
Original article
Inter-regional variability in site index models for even-aged stands
of stone pine (Pinus pinea L.) in Spain
Rafael Calamaa*, Nieves Cañadasb and Gregorio Monteroa
b
a Centro de Investigación Forestal, CIFOR-INIA, Apdo. 8111, 28080 Madrid, Spain
Dirección General del Medio Natural, Consejería de Medio Ambiente, Comunidad de Madrid, Princesa, 3. Madrid, Spain
(Received 7 December 2001; accepted 3 June 2002)
Abstract – Data from 96 stem analysis and 37 permanent plots in even-aged stands of stone pine (Pinus pinea L.) in four regions of Spain
(Central Range, Northern Plateau, West Andalusia and Catalonia) are used to develop a dominant height growth model for each region. These
models are compared to detect similarities or differences in height growth patterns between regions, which will justify the need to build more
regional site index curves for the species in Spain. Comparing these models involves homogeneity tests of parameters and a statistical analysis
of the bias.
site index / model / inter-regional / height growth / Pinus pinea
Résumé – Variabilité inter-régionale des modèles de site index pour les peuplements réguliers de pin pignon (Pinus pinea L.) en
Espagne. Les données de 96 analyses de tige et de 37 placettes permanentes de pin pignon (Pinus pinea L.) réparties dans quatre régions
d’Espagne (Massif central, Plateau de Nord-Castille, Andalousie et Catalogne) ont été utilisées pour le développement d’un modèle de
croissance (hauteur dominante) pour chaque région. Les modèles sont comparés entre eux afin de détecter des similarités ou des différences sur
la croissance en hauteur entre les peuplements des quatre régions, ce qui pourrait justifier la nécessité de construire des modèles régionaux pour
Pinus pinea en Espagne. Pour comparer les modèles entre eux, des tests sur l’homogénéité de paramètres et des analyses statistiques de biais
ont été utilisés.
site index / modèle / inter-régional / croissance en hauteur / Pinus pinea
1. INTRODUCTION
There has recently been a large increase in the publication
of new growth models and site index curves for different
species. This increase has been accompanied by a decrease in
the geographic range of validity for the application of these
models, with the range being reduced more and more to
smaller regions.
Variability detected between growth and site index models
developed for the same species in different geographical and/
or ecological regions could be influenced by the existing
differences in the methodology used for data collection and
processing. In these cases, the administrative barrier between
two different regions or countries could lead to significant
differences between growth models that are not based on
ecological or biological reasons [1].
Although the methodology used in different regions or
countries could be similar, it is necessary to determine if there
are significant differences between the dominant height
growth patterns for a given species growing under different
* Correspondence and reprints
Tel.: (34) 91 347 68 68; fax: (34) 91 357 22 93; e-mail:
ecologic or geographic conditions. This will help us to decide
whether new site index models are necessary or whether a
fewer number of curves will allow us to represent and express
the growth pattern for dominant height with the precision level
required by forest managers [1, 11, 12, 20, 31, 32]. Finally, it
is also necessary to determine if the increase in the predictive
level that we obtain when we are developing a model for a
small geographic region justifies the cost we have invested in
building it, or if it is more useful to apply a single model for
wide areas. In this case, despite a small loss in the prediction
ability of the model, we can make comparisons in potential
productivity for different regions, giving forest managers the
possibility of applying the same techniques in stands growing
in different areas under similar site conditions [1].
Stone pine (Pinus pinea L.) is a typical Mediterranean forest species. In Spain it occupies more than 400000 ha, which
is more than 50% of the total area occupied by the species in
the world. Pinus pinea stands have an important ecological,
landscape, recreation and soil conservation use. This importance, together with the economical yield of its two principal
260
R. Calama et al.
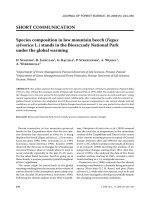
Figure 1. Site index curves for Pinus pinea L. published in Spain.
products, wood and pinyon nut, which have a relative high
value in the rural environment where the species is found,
have resulted in a large increase in the interest of the species
for forest managers and researchers. As a result, several site
index curves for Pinus pinea in Spain have been developed
and published [5, 14, 26]. All these models, except the one
developed by Pita [26], have a regional character, having been
proposed and validated only for a given region in Spain.
Site index curves for Pinus pinea in Spain have been built
using different methodologies, in data collection, chosen
function, index age and statistical analysis. The graphical
analysis of these curves (figure 1) also reflects the existence of
different growth patterns among the regions.
The lack of homogeneity in data collection and in its
analysis prevents us from determining if the differences
detected among growth patterns are a consequence of interregional variability, or are caused by the absence of a single
criterion to be used in data collection and analysis.
The aim of this work is to select a single function that will
describe and predict the growth of dominant height for Pinus
pinea in Spain. This function will be fitted to homogeneous
data obtained in even-aged stands of Pinus pinea located in
four different Spanish regions (figure 2): Northern Plateau
(Meseta Norte), Central Range (Sistema Central), West
Andalusia (Andalucía Occidental) and Catalonia (Catala).
This will allow us to analyse the inter-regional variability in
dominant height growth patterns for Pinus pinea stands, and to
determine whether it is possible to reduce the number of site
index curves and growth models. In the same way, if we detect
the existence of significant differences among the regional
models, we would determine and evaluate the degree of error
committed by applying a combined model fitted for a group of
regions, instead of applying separate models for each region.
2. MATERIALS AND METHODS
2.1. Data set
In this research, we have studied 162 stem analysis trees of Pinus
pinea, obtained from even-aged stands distributed throughout the
species’ range in Spain. From these, 107 trees were felled and analysed in 1966, taken from the 37 permanent plots installed by the
INIA (National Institute for Agriculture Research), and the remaining
55 trees were chosen and analysed for this research.
In the 1966 sample, two or three trees were felled and then
analysed from each of the 37 permanent plots. From these trees, we
have selected those that had a mean diameter at breast height that was
included amongst the 20% of the thickest trees of the plot (Weise
criterion for selecting dominant trees [30]). The final number of trees
selected was 41, located in 24 plots. When more than one tree per plot
was selected, only one height-growth curve was developed, by taking
the highest height value obtained from the trees analysed in the plot
at each age.
We felled 55 dominant trees, located in four different geographic
regions throughout Spain. The trees were identified and selected
close to the temporary production plots, installed by the Department
of Silviculture of the CIFOR-INIA between 1992 and 2000, in evenaged stands of Pinus pinea in Northern Plateau, Central Range, West
Andalusia and Catalonia. Among all the existing plots (more than
450) we chose those with a total age close to or more than 100 years.
Since we knew the age and height of the dominant trees, we made an
effort to select the plots to cover all possible site qualities. In order to
avoid suppressed trees, we refrained from using plots where there
were signs of recent harvesting (stumps) because harvested trees may
have suppressed the growth of remaining trees.
Once the plots were selected, we looked for a tree in the same
stand but outside the plot, whose characteristics were similar to those
of the dominant tree in the plot. This tree should be dominant and
undamaged. To determine tree age and in order to avoid signs of early
suppression or anomaly in growth pattern, we sampled each tree ring
growth pattern using a Pressler increment borer. These pre-selected
trees were also measured for diameter at breast height, total height,
crown height and crown diameter. Distances from the selected tree to
the ten nearest trees, as well as the diameter at breast height of these
ten trees were also measured.
Chosen trees were felled as close to the ground as possible. The
total height of the felled tree was measured, and the stem was divided
into sections. Discs were taken from each section, starting at stump
height (10 cm), then at breast height (1.30 m), and then at every
1.25 m, measured along the stem.
For each disc, annual ring count and growth were measured with
a linear positioning digitizer tablet LINTAB, while data obtained
were saved and processed with the aid of TSAP software. With these
measurements, a small bias occurs as the height at the sectioning
point underestimates the real height attained for that year. In order to
remove this bias we used the correction proposed by Carmean [7].
The total set of stem analysis data comprises a group of 96 sample
trees. The regional location of these trees, as well as the data
summary of the sample is presented in table I.
2.2. Validation data set
Since the suitability and quality of the fit does not necessary
reflect the quality of the prediction, we conducted an assessment of
the proposed model on a validation data set.
The validation data set we used consists of data from 37 plots of
Pinus pinea, found in the set of permanent plots of the Department of
Silviculture, CIFOR-INIA, installed in 1966. These plots have been
remeasured several times, from 2 to 5 times. No plots were installed
on the Pinus pinea stands of Catalonia, so we do not have any
validation data from this region.
Permanent plots have a variable number of trees and an area
ranging from 750 to 2500 m2. At each measurement the diameter at
breast height of all the trees in the plot was measured, while total
Inter-regional site index variability
261
Figure 2. Distribution of the range of Pinus pinea L. in Spain and the sampled regions.
Table I. Summary statistics and sample distribution of stem analysis trees.
Region
Total
Mean T
SD T
T min–max
Mean Ho
SD Ho
Ho min–max
West Andalusia
29
60.2
24.1
20–96
13.45
5.14
3.8–22.2
Northern Plateau
29
65.2
38.2
20–126
10.25
5.62
3.5–21.2
Central Range
27
106.8
43.2
50–214
12.70
4.73
4.5–19.8
Catalonia
11
112.6
15.0
92–137
15.31
3.08
9.9–19.7
Total
96
80.8
40.6
20–214
12.49
5.19
3.5–22.2
T = age (years); Ho = dominant height (m); SD = standard deviation; min–max = range.
height was only collected for a sample of 40 trees. Therefore, for each
plot and each measurement a function of the type H = a + b.D + c.D2,
where H is total height and D is diameter at breast height, was fitted
to the existing data, and the dominant height was defined as the height
of the tree whose diameter is the mean diameter of the 20% thickest
trees in the plot [30], calculated using the above-mentioned function.
2.3. Methodology
Many mathematical functions are available [22, 32] to model
dominant height growth. Desirable characteristics for growth
functions are shown in Goelz and Burk [16], and Eflving and Kviste
[12]. Among all the techniques developed for building site index
curves, we have selected the difference equation method. This
method allows us to calculate dominant height at any age based on the
data of dominant height at any other age, resulting in models that
have the property of invariance with respect to the index age [3, 5, 10,
12, 20]. To meet this objective we use functions of the following type:
H2 = f(H1, T1, T2) + e
where: H1: dominant height at age T1; H2: dominant height at age T2;
e: additive error.
The main advantages of applying this method are the ability to
make use of any temporal series of data, despite its length; the
possibility to use data from trees whose total age was under the index
age [17] and the fact there is no need to determine an index age prior
to fitting the data.
Parameter estimation in fitting this type of function presents
several problems. Among these, the most important is related to
autocorrelation and lack of independence among observations, which
arises from taking several measurements from the same tree at
different heights [3, 5, 16, 24]. This may invalidate standard
regression hypothesis testing procedures and interval estimations,
because error terms are not independent and identically distributed
with a common variance. Many approaches to this problem have been
developed in different researches [2, 15, 17, 24].
We compared six differential growth functions, selected from the
most commonly used in forest research. These functions have been
developed, by differentiation and parameter expansion, from wellknown growth functions, such as Richards [27], Schumacher [28], or
Korf [30]. The functions we selected are among these reviewed in
Cao [6] and Huang [17]. We compared functions with different
numbers of parameters, varying between one and four. The selected
functions are shown in table II.
2.4. Data structure
From each sample stem analysis, we obtained a height-age pair
(Hi, Ti) from each section. The data used for fitting the different
262
R. Calama et al.
Table II. Difference equations selected for fitting and comparison.
Number
Name
(1)
Richards
Function
H2 = H1 . {(1 –exp(a.T2)) / (1 –exp(a.T1))}b
(2)
Goelz–Burk
c
H2 = H1 . {(1 –exp(k.T2)) / (1 –exp(k.T1))} d ; k = a . (H1/T1)b . T1
(3)
Schumacher
H2 = H1 . exp{a.(1/T2 – 1/T1)}
(4)
Bailey–Clutter
H2 = exp {a + (ln (H1) – a) . (T2 /T1)b}
(5)
Clutter–Lenhart
H2 = exp {[a + b/T2 +(ln (H1) – a – b/T1)]. exp [ c . (1/T2 – 1/T1) ]}
(6)
Amateis–Burkhart
H2 = exp {[ (ln (H1) . (T1 – T2)b ]. exp [ a . (1/T2 – 1/T1) ]}
Hi is dominant height (m) at age Ti(years); a, b, c and d are fitted parameters of the function.
functions was all the possible combinations among height-age pairs
for a tree (all possible growth intervals) [5, 16, 17].
In this way, from each tree we get a data series of height-age pairs
(Hi, Ti – Hj, Tj), whose range varies with the age and the height of the
tree. Age data refers to total age.
2.5. Model comparison
Functions shown in table II were fitted independently to data from
each region. The fittings were done using the PROC NLIN procedure
on the SAS/STAT software. Fitting was done in a two-step procedure
in order to include the autocorrelation correction proposed by Goelz
and Burk [16]. In the first step, each function is fitted following
ordinary non-linear least squares regression. Then, the error term eij,
residual from estimating Hi using Hj, is expanded following an
autoregressive process:
eij = r.ei–1,j + g.ei,j–1 + eij
where r represents the autocorrelation between the current residual
and the residual from estimating Hi–1 using Hj as predictor variable
(ei–1,j), and g represents the autocorrelation between the current
residual and the residual from estimating Hi using Hj–1 as predictor
variable (ei,j–1).
In the second step, we fit the expanded function, obtaining eij,
which are independent and identically distributed errors with mean
zero and constant variance h2. Knowledge of value of autoregressive
parameters r and g is of no use for field applications of the resulting
site index equations, because the errors ei–1,j and ei,j–1 cannot be
observed without stem analysis [24].
The evaluation of the functions is based on the following criteria:
• Goodness of fit: in each region we calculated the fit statistics
sum of squares error (SSE), mean square error (MSE), and modelling
efficiency coefficient (EF), a test similar to R2 for linear regression.
We also used a t-test for determining the significance level of the
estimated parameters.
SSE =
å ( h 2obs – h2pred )
2
(1)
MSE =
n–1
2
å ( h 2obs – h2pre )
EF = 1 – -------------------------------------------------2
å ( h2obs – h2mean )
å ( h2obs – h 2pre )
------------------------------------------n
(2)
(3)
where h2obs = observed height, h2pre = predicted height, h2mean =
mean observed height.
(4)
where: h2obs = observed height; h2pre = predicted height; n = total data
number.
A t-test allows us to determine whether mean residual error differs
significantly from zero.
• Validation data: data from the validation set were used to
compare predicted height values obtained by applying the functions
against real observed values. We compared the mean and percentage
value of the error. We also fitted the linear model Hobserved = a +
b.Hpredicted, testing whether a = 0 and b = 1. We applied a t-test,
independent for each parameter, and the F-test of Fisher-Snedecor,
for the simultaneous test of both parameters.
2.6. Interregional comparison
2.6.1. Homogeneity of parameters test
Once we selected a unique differential function for describing
dominant height, validated it for each region, and estimated the
parameters of the function for each region, we determined whether
significant differences exist among regional growth patterns.
For this we used two tests for detecting simultaneous homogeneity
among parameters, both based on the likelihood-ratio test [13, 19,
29]: the non-linear extra sum of squares F test [17, 18, 25] and the c2
test proposed by Lakkis and Jones, in Khattree and Naik [21].
Both methods require the fitting of a full and a reduced model. Full
model fitting was done by calculating a different set of parameters for
each region. For this fitting, we included dummy variables in the
general form of the function as follows:
Y =
2
å ( h2obs – h 2pre ) ---------------------------------------------
• Residual analysis: for detecting unequal error variance
(heteroskedasticity) and the presence of outliers, plots of studentized
residuals against predicted heights were made for each region and
each function. The existence of significant bias in function fitting was
detected by calculating the mean residual error, defined as:
å Vi f i
(5)
where i means the given region (i = 1 for West Andalusia, i = 2 for
Northern Plateau, i = 3 for Central Range, i = 4 for Catalonia); fi is
the growth function f(x,bi) fitted for region i; and Vi is a dummy
variable whose value is 1 if the data is from region i, and 0 if it is from
other region.
In the reduced model we assumed that the vectors of parameters
are equal for all the regions (b1 = b2 = b3 = b4), making a unique fit
of the function f(x, b) to all the regions in the data set.
Inter-regional site index variability
263
Table III. Regional groups proposed for error analysis.
Regional group
Null hypotheses
Combined regions
A
b1 ¹ b2 ¹ b3 ¹ b4
All regions separated
B
b1 = b2 = b3 = b4
All regions combined
C
b1 ¹ b2 = b3 = b4
Central Range, Northern Plateau, Catalonia
D
b1 = b2 = b4 ¹ b3
West Andalusia, Northern Plateau, Catalonia
E
b1 = b3 = b4 ¹ b2
West Andalusia, Central Range, Catalonia
F
b1 = b2 = b3 ¹ b4
West Andalusia, Central Range, Northern Plateau
G
b1 = b2 ¹ b3 ¹ b4
Northern Plateau, West Andalusia
H
b1 = b3 ¹ b2 ¹ b4
West Andalusia, Central Range
I
b1 ¹ b2 = b3 ¹ b4
Northern Plateau, Central Range
J
b1 = b4 ¹ b2 ¹ b3
West Andalusia, Catalonia
K
b1 ¹ b2 = b4 ¹ b3
Northern Plateau, Catalonia
L
b1 ¹ b2 ¹ b3 = b4
Central Range, Catalonia
bi = vector of parameters for region i.
Equality of both models is tested by considering the following
hypotheses:
Ho: vector of parameters bi are equal for all the regions
against
H1: at least one of the equalities of Ho is not true.
Lakkis-Jones test uses the L statistic defined as:
SS f n Ô 2
(6)
L = ỉ -------ư
è SS rø
where: SSf = sum of squares error for full model; SSr = sum of squares
error for reduced model; and n = total number of observations.
If homogeneity exists among the regional vectors of parameters b,
the distribution of the statistic –2.ln(L) converges in probability to a
Pearson c2 distribution, with v degrees of freedom, where v is equal
to the difference between the number of parameters estimated in the
full and the reduced models. In this case we cannot reject the null
hypotheses of equality of parameters.
The F-test uses the following statistic:
SS r – SS f
ỉ ---------------------ư
è dfr – df f ø
(7)
F = --------------------------f
ỉ SS-ư
------è df f ø
where SSf = sum of squares error for full model; SSr = sum of squares
error for reduced model; dff = degrees of freedom for full model; and
dfr = degrees of freedom for reduced model.
The statistical decision rule at the given significance a level is:
If F > FFisher-Snedecor (1–a; dfr–dff; dff), we reject the null
hypotheses Ho, which then means that separate models are required
for each region.
If F < FFisher-Snedecor (1–a; dfr–dff; dff), we cannot reject the null
hypotheses Ho, accepting then that the reduced model is appropriate
for all regions.
If the homogeneity of parameters tests reveal significant differences among regions, these may be caused by the variability existing
among two or more of these regions. Taking this into account, it is
advisable to apply the tests to all the possible combinations of regions
[18]. This will allow us to identify, region by region, the source of difference and the degree of similarity in growth patterns.
2.6.2. Error analysis
If the homogeneity of parameters tests reveal the existence of
significant differences among regional dominant height growth
patterns, we next determine the precision level obtained by fitting the
selected function to the combined data from different regional groups
[1, 11].
We define twelve different regional groups. We let: b1 = vector of
parameters for West Andalusia; b2 = vector of parameters for
Northern Plateau; b3 = vector of parameters for Central Range; b4 =
vector of parameters for Catalonia; and we define the regional
combinations shown in table III.
For each of the regional groups, we fit the selected function, taking
into account the assumptions imposed by its null hypotheses. This
means that, for example, in B group we fit the model to the total data
set, while in C group, we will fit the model to the combined data from
Central Range, Northern Plateau and Catalonia, and make an
independent fit to the data from West Andalusia. Parameter estimates
for group A coincides with those obtained in the separate fitting made
for each region.
For each regional group, we calculate the value of the sum of
squares error and mean error. A t-test will determine whether mean
error differs significantly from zero. In order to detect if there is an
unequal distribution of the error with the predictor age, we divide the
data set into six classes of predictor age. All possible pairs (Hi,Ti –
Hj,Tj) developed from the data set are grouped into the following
predictor age classes: 0–20, 20–40, 40–60, 60–80, 80–100 and more
than 100 years. We also evaluated the distribution of the error with
the absolute value of the length of the interval of prediction |Tj–Ti|.
For this case we also grouped data into six twenty-year interval
classes. An indication of the prediction power of the model is given
by the modelling efficiency coefficient EF.
Together with the value of the mean absolute error calculated for
the different regional models, we determine the value of the error
committed in applying any of the regional groups instead of group A
(separate regions). For doing this, we define a new variable
comparison error (comperr) defined as follows:
comperri = H2pred ModA – H2pred Modi
(8)
264
R. Calama et al.
Table IV. Fit statistics and summary results for the regional fit of the functions.
Region
Function
Parameter estimates
a
West Andalusia
0.7380
3.8290
(5)
2.5125
–26.4537
(6)
–5.6487
–0.0952
(1)
–0.0106
1.0158
(2)
0.0577
0.7397
(3)
–13.5977
(4)
5.2613
–0.2576
(5)
–4.6927
–61.4854
(6)
–6.7607
(1)
–0.0066
(2)
0.0829
1.2179
(3)
–12.1916
(4)
4.0410
–0.3844
(5)
0.9562
–39.8553
(6)
–3.0618
–0.1927
(1)
–0.0068
0.8865
(2)
0.1963
1.3331
(3)
–9.3972
(4)
4.0352
–0.4138
(5)
–3.4086
–50.0101
(6)
–4.1318
–0.2127
0.3162
98.93
0.0211
455.6
0.2586
99.12
0.0051
1.4280
95.15
0.322
519.1
–0.5199
–0.0415
EF
557.7
–9.6034
(4)
Catalonia
0.0781
MSE
Error
0.2943
99.00
–0.0262
d
1.2127
(3)
Central Range
–0.0259
(2)
Northern Plateau
(1)
c
SSE
2520.5
b
1.3801
6.3112
780.6
0.4428
98.50
0.041
1086.9
0.6162
97.91
0.086
492.8
0.2889
98.94
0.033
423.1
0.2483
99.09
0.0021
1615.4
0.9463
96.53
0.289
427.8
0.2507
99.08
0.0111
1038.2
0.6089
97.77
0.088
–0.1564
783.0
0.4590
98.32
0.098
0.8324
452.0
0.2274
99.11
0.0231
311.5
0.1569
99.38
–0.0131
1932.5
0.9716
96.18
0.256
275.2
0.1384
99.46
0.0061
1144.9
0.5762
97.74
0.053
926.0
0.4658
98.17
0.099
464.9
0.3189
98.69
0.0031
344.9
0.2369
99.03
0.0021
2222.1
1.5231
93.74
0.302
446.3
0.3061
98.74
0.00031
1229.4
0.8348
96.54
0.143
668.3
0.4583
98.12
0.059
–0.0671
1.1700
3.9962
0.0742
1.1391
6.0713
–0.0778
3.5056
1.2960
1
Not significant with P > 0.05; 2 not significant with 0.05 > P > 0.01. SSE = error sum of squares; MSE = mean squared error; EF = modelling efficiency coefficient; Error = mean residual error.
where: comperri = Residual obtained when applying model i instead
of model A; H2pred ModA = Predicted height obtained from model A;
and H2pred Modi = Predicted height obtained from model i.
We calculate the mean value for this variable, and we used a t-test
for determining the significance degree of mean relative error value
for each regional group.
3. RESULTS
3.1. Model comparison
The results of fitting the functions for each region are
shown in table IV. A t-test reveals that parameters estimates
for all functions are significant at an a level of 5%. The
analysis of the fit statistics reveals that smaller SSE and MSE
values are always shown by functions (1), (2) and (4), and are
much higher for the rest of functions compared. Plots of
residuals against predicted height values show that the
variance is constant (homoscedastic) for any function, but we
detected the presence of outlier, meaningless values (negative
heights) and bias when applying functions (3), (5) and (6).
Finally, an analysis of the mean error value reveals the
existence of significant bias, at a significance level of 1%, in
fitting regional data to functions (1), (3), (5) and (6). The best
fit is obtained in using functions (1), (2) and (4).
Next, we used the validation data set to evaluate prediction
performance of the different functions tested. We compared
the real height values from the validation data set with those
predicted by applying the tested functions with the parameters
estimated for each region. All the functions show a mean error
of less than 1% for any regional fit of the validation data.
Among the three best functions based on a good fit ((1), (2)
and (4)), function (4) is the only one with a significance level
of 1%, for both tests for determining whether a = 0 and b = 1
for the three regional validation data sets.
From these results, we recommend using function (4), a
differential form of the Korf growth function [23], developed
Inter-regional site index variability
265
Table V. L and F statistics and tests for grouped regions.
Regional groups
n
L
P>L
F
P>F
All combined
6932
578.467
4.190E-116
50.158
6.587E-116
Central R. – N. Plateau – Catalonia
5164
95.270
3.942E-17
11.991
4.261E-17
W. Andalusia – Central R. – Catalonia
5222
495.566
6.287E-102
64.831
9.598E-102
W. Andalusia – Catalonia – N. Plateau
4940
366.853
2.281E-74
47.487
3.171E-74
W. Andalusia – N. Plateau – Central R.
5470
582.003
1.728E-120
76.593
2.780E-120
W. Andalusia – N. Plateau
3478
295.946
8.112E-63
77.048
1.090E-62
W. Andalusia – Central R.
3760
487.256
3.821E-104
129.782
6.008E-104
N. Plateau – Central R.
3702
94.622
1.371E-19
23.909
1.497E-19
W. Andalusia – Catalonia
3230
231.954
5.010E-49
59.973
6.430E-49
N. Plateau – Catalonia
3172
1.814
Central R. – Catalonia
3454
35.245
0.769
0.452
0.770
4.136E-07
8.836
4.278E-07
L = Lakkis Jones statistic (6); F = non linear extra sum of squares statistic (7); P > L = probability for L to be under a Pearson c2 distribution, with
dfr–dff degrees of freedom; P > F probability for F to be under a Fisher Snedecor F distribution with dfr–dff; dff degrees of freedom.
by Bailey and Clutter [2]. This function presents reasonably
good results for goodness of fit statistics in model fitting and
in validation. It does not show any significant problem with
heteroskedasticty or prediction bias. We selected this function
instead of function (2), a differential form of the Richards [27]
function developed by Goelz and Burk [16], which showed
better results in fitting statistics. We did this because the
Bailey-Clutter function has a smaller number of parameters to
estimate (two vs. four). Furthermore, the Goelz-Burk function
is not a true base-age invariant function, on account of being a
non-reciprocal difference equation [17]. This means that the
choice of different predictor (age-height) pairs may have an
impact on height prediction.
Applying the Bailey-Clutter function also allowed us to
verify the property of polymorphism. Let the general expression of Korf growth function be:
1 c
H i = exp ỉ a + b × ỉ ----ö ö .
è T iø ø
è
(9)
The relative rate of growth, (dH/dT)/H, is related to both
“b” and “c”. Bailey and Clutter considered the regression
slope parameter “b” as a site specific parameter, relating it to
the predictor age and dominant height at that age [2, 6] by the
following expression:
c
b = [ log ( H j ) – a ] × T j .
(10)
As the relative rate of growth is function of “b”, it is not
constant throughout the sites. Different rates of growth for
different sites means polymorphism in site index curves.
A graphical representation of the selected function, fitted
for each region, and forced to pass through age-height pairs
(100,9), (100,13), (100,17) and (100,21) determines the
regional site index curves for the species (figure 3).
3.2. Interregional comparison
The regional site index curves (figure 3) show a clear trend
towards equality in dominant height growth pattern among
different stands found in Northern Plateau, Central Range,
Figure 3. Regional site index curves for Pinus pinea L. in Spain
using the Bailey-Clutter function.
West Andalusia and Catalonia. We only detect important
differences in growth patterns for highest site index class in
the Northern Plateau region, which may be a result of the small
number of trees of this class in this region.
3.2.1. Homogeneity of parameters tests
For the statistical analysis of interregional variability in
dominant height growth pattern, we first fit the reduced model
and full model to the complete data set and to each one of the
regional combination data sets. The value of the L statistic (6)
for Lakkis-Jones test, and F statistic (7) for the non-linear
extra sum of squares test are shown in table V.
At a significance level a = 5%, we cannot reject the null
hypotheses of parameters homogeneity for comparison between
Catalonia and Northern Plateau. For the rest of regional groups
compared we can reject null hypotheses.
266
R. Calama et al.
Table VI. Mean absolute error analysis obtained by fitting function (4) to the different regional groups. Distribution with predictor age.
Predictor age class
0–20
20–40
40–60
60–80
6932
1852
1894
1220
789
Error
–0.0071
0.0851
0.0451
–0.0963
–0.0672
0.0181
–0.225
B
Error
–0.0091
0.1463
–0.0021
–0.163
–0.129
–0.0391
–0.0121
C
Error
–0.0091
0.0851
0.0632
–0.112
–0.145
–0.0561
–0.0962
D
Error
–0.0071
0.1223
0.0101
–0.115
–0.0843
0.0171
–0.164
E
Error
–0.0081
0.1553
–0.0211
–0.178
–0.0782
0.0051
–0.0471
F
Error
–0.0101
0.1383
0.0001
–0.157
–0.127
–0.0441
–0.0221
G
Error
–0.0081
0.0962
0.0271
–0.0893
–0.0732
0.0081
–0.215
H
Error
–0.0071
0.1563
–0.0201
–0.179
–0.0792
0.0051
–0.0451
I
Error
–0.0121
0.0771
0.0602
–0.109
–0.141
–0.0561
–0.1052
J
Error
–0.0101
0.1132
0.0031
–0.131
–0.0591
0.0371
–0.170
K
Error
–0.0021
0.1042
0.0502
–0.1073
–0.0973
0.0131
–0.181
L
Error
–0.0071
0.0841
0.0522
–0.0983
–0.0772
–0.0051
–0.201
Group
A
Total
n
1 Not
significant with P > 0.05;
error = å(H2 pre – H2 obs) / n.
2 not
significant with 0.05 > P > 0.01;
3 not
80–100
573
> 100
604
significant with 0.01 > P > 0.001; n = total data number;
Table VII. Mean absolute error analysis obtained by fitting function (4) to the different regional groups. Distribution with prediction interval
length class |Tj – Ti|.
Interval prediction class
0–20
20–40
6932
2630
1904
1140
Error
–0.0071
–0.0011
0.0161
–0.0011
–0.0501
–0.0841
–0.0861
B
Error
–0.0091
0.0181
0.0441
–0.0041
–0.0781
–0.1871
–0.3832
C
Error
–0.0091
–0.0011
0.0151
0.0051
–0.0391
–0.0941
–0.1941
D
Error
–0.0071
0.0121
0.0351
–0.0141
–0.0761
–0.1471
–0.1451
E
Error
–0.0081
0.0181
0.0451
–0.0011
–0.0811
–0.1801
–0.3812
F
Error
–0.0101
0.0171
0.0431
–0.0051
–0.0801
–0.1901
–0.3932
G
Error
–0.0081
0.0101
0.0301
–0.0171
–0.0761
–0.1241
–0.1341
H
Error
–0.0071
0.0181
0.0451
0.0011
–0.0791
–0.1771
–0.3802
I
Error
–0.0121
–0.0021
0.0131
0.0021
–0.0421
–0.1111
–0.1821
J
Error
–0.0101
0.0061
0.0271
–0.0091
–0.0701
–0.1461
–0.1451
K
Error
–0.0021
0.0011
0.0191
0.0051
–0.0391
–0.0731
–0.0621
L
Error
–0.0071
0.0011
0.0171
0.0021
–0.0481
–0.0771
–0.1531
Group
A
Total
n
1 Not
significant with P > 0.05;
Error = å(H2 pre – H2 obs) / n.
2 not
significant with 0.05 > P > 0.01;
3 not
3.2.2. Error analysis
After we detected the existence of significant differences
among regional site index curves for Pinus pinea, we tried to
determine the real value of this difference. We fit the BaileyClutter function to the twelve regional groups defined in table III.
The mean error, the significance level of the mean error,
and the distribution of the error against predictor age are
shown in table VI. Results for the distribution of these statistics against prediction interval length are shown in table VII.
40–60
60–80
80–100
> 100
716
358
184
significant with 0.01 > P > 0.001; n = total data number;
Results indicate that in the fit of the function to the regional
groups, the mean error value does not differ significantly from
zero at a level a = 5%. The variability of this error with
predictor age shows that, for all the groups, only the range of
predictor age between 40 and 80 years leads to significant
errors, although the mean value of the error never exceeds
20 cm. When evaluating this error with prediction interval
length, we found that, except for the largest interval (more
than 100 years between predictor and predicted age), mean
error does not differ significantly from zero.
Inter-regional site index variability
Table VIII. Summary results for the modelling efficiency coefficient
EF analysis and mean relative error comperr analysis (obtained by
applying each regional group instead of group A).
Group
–
0.0011
0.0011
–0.00041
0.0011
0.0031
92.80
92.23
92.81
92.92
93.11
93.06
(a)
Comperr
93.21
92.02
92.76
92.68
92.22
92.03
G
H
I
J
K
L
1
EF (%)
A
B
C
D
E
F
267
0.0011
0.00021
0.0041
0.0021
–0.0042
–0.00011
(b)
Not significant with P > 0.05; 2 not significant with 0.05 > P > 0.01.
The EF statistic for the different regional models is
included in table VIII. Modelling efficiency coefficient EF has
the highest value, logically, for A group (separate regions). In
any case, the EF value varies between 93.21% for the highest
(A group) and 92.02% for the lowest (B group, combining all
the regions together), and does not show a great difference
among groups. Results from the evaluation of the modelling
efficiency with both predictor age and prediction interval
length for the A (separate regions) and B (combined regions)
are shown in figure 4. The results for the rest of regional
groups involved are between the values for A and B groups.
Table VIII also shows the mean relative error committed in
applying each regional model instead of model A (separate
regions), as well as the significance level of this error. In this
analysis we detected that, for a significance level a = 5%,
there are no differences for the mean error between model A
and the rest of the models, except model K.
Figure 4. Analysis of modelling efficiency variability with
prediction interval length (a) and predictor age (b).
The variable chosen as independent has been the total age.
The use of breast height age has been proposed by many
authors for the development of site index curves and height
growth models [8–10, 16, 24]. Despite this, Beland and
Bergeron [4] argue that ignoring the first years of plant growth
might obscure the differences existing between regional or
ecological areas in terms of level of site index, curve shape or
growth pattern. The same reasoning is used by Johansson [20],
Duplat and Tran-Ha [11], and Elfving and Kiviste [12].
4.2. Interregional comparison
4. DISCUSSION AND CONCLUSIONS
4.1. Model comparison
Among the six differential growth equations evaluated for
describing dominant height growth patterns in Pinus pinea, a
differential form of the growth function proposed by Korf
[23], developed by Bailey and Clutter [2], has been selected.
This function was the best in explaining dominant height
growth pattern for the species in all the regions compared. In
fitting this function to our data, we have developed regional
site index equations for Pinus pinea, and validated them using
data from permanent plots installed by INIA during the sixties.
The use of homogeneous data, collected in a uniform way
in each one of the regions compared, and the use of a unique
function, fitted to each set of regional data, shows us that a
large part of the difference detected among site index curves
for Pinus pinea published in Spain is caused by the lack of
homogeneity and uniformity in data collection and data
processing.
A graphical comparison among regional site index curves
(figure 3) indicates that there is a high level of similarity
between dominant height growth patterns for the four different
Spanish regions tested, especially for ages over 40. We only
find differences in the growth pattern of the highest site index
curve for Northern Plateau stands. We consider that this
difference may be caused by the small number of trees in this
class used in fitting the function.
The use of two statistical tests to determine homogeneity of
parameters, when comparing non-linear functions (non-linear
extra sum of squares F-test and Lakkis Jones test), shows the
existence of significant differences among regional growth
patterns, except for the regional pair Catalonia-Northern
Plateau. This result does seem not to be in keeping with the
graphical representation of the regional curves (figure 3),
where all the regions’ patterns are similar. A reason for this
could be based on the power of the homogeneity of parameters
tests used, both derived from the likelihood ratio test. As stated
by Gallant [13], with large samples , as is our case, the power
268
R. Calama et al.
of the likelihood ratio test becomes so high than small
differences are identified as significant.
An analysis of the mean prediction error to determine the
existence of differences among regional height growth models
has been used in developing national site index curves for
Picea glauca (Moench) Voss in Canada [1], and in the study
of interregional variability in site index curves for Quercus
petraea in France [11]. We have applied this method to
different models based on regional grouping.
The analysis of both the mean absolute error and the
modelling efficiency coefficient, reveals that there are no
major differences among the different regional models. The
most interesting finding is that the error is not equally
distributed amongst the different predictor age classes, being
higher in the youngest class (0–20 years old). Regarding the
distribution of the error with the length of the prediction
interval, the smallest error is found when prediction interval is
below 20 years. When intervals are larger, error trends to
increase, but not in a very pronounced pattern. This confirms
the difficulty and the lack of precision in prediction in using
height growth models at younger ages of the stand with very
large intervals for prediction.
The differences detected in the analysis of the mean
comparison error (the difference between predicted height
obtained with model A and the value obtained in applying
other models) are so small that they allow us to justify the use
of each of the regional models proposed.
We propose the selection of model B, obtained by fitting
the Bailey-Clutter function to the total data set from the four
regions studied, considered as a unique group. Application of
this model, unique for the four regions, results in a mean
prediction error that does not differ significantly, at a a level
of 5%, from zero. The study of the variability of this error with
both predictor age and prediction interval length shows that it
is not significant, with a level > 0.1%, for all the ranges
involved. This value is similar to those obtained for the rest of
regional models (including model A, separate regions). In the
same way, the modelling efficiency coefficient calculated for
model B (all regions combined) is 92.02%, which is 1.2% less
than the EF value calculated for model A of separate regions.
At a significance level of 5%, the results show that there are
no differences between the mean error obtained in applying
models A (separate regions) and B (combined regions).
To adopt a unique interregional model means a decrease in
the prediction power of the model, as compared to the models
for separate regions. The value of this decrease, estimated by
the modelling efficiency coefficient, is about 1%. This decrease
seems to be acceptable if we compare it to the advantages of
having one model for classifying site quality in forest stands
of Pinus pinea in the four regions studied. Forest managers
will benefit from the adoption of one model for site index,
because this will allow them to:
• Compare the productive capacity among stands located
in different regions.
• Take advantage of the previous experience developed in
forest management of stands located in different regions, but
with similar quality.
Figure 5. Interregional site index curves for Pinus pinea L. in Spain.
• Apply treatments and silviculture models already tested
in other regions.
• Study the viability of developing interregional growth,
competition and production models for the species.
The model proposed has a geographic validity, which
comprises the four studied regions. The fact that these regions
include most of the area where the species occurs in Spain,
lead us to propose it as a site index model for Pinus pinea for
the whole state.
The general form of the national site index equation
proposed for Pinus pinea is:
T 2 –0.3935 ü
ì
H 2 = exp í 4.1437 + ( ln ( H 1 ) 4.1437 ) ổ -----ử
ý
ố T 1ứ
ợ
ỵ
where Hi is dominant height (in meters) for the stand at age Ti
(in years).
Graphical representation of this model defines the national
site index curves for Pinus pinea, forced to pass through the
points (100, 21), (100,17), (100, 13) and (100, 9) as shown in
figure 5.
Acknowledgements: The authors wish to thank Nikos Nanos, for
reviewing the manuscript and for his helpful comments. We also
want to thank Jesús de Miguel, for his help with the figures. We are
also grateful to two anonymous referees, for their valuable comments
on the manuscript. The research was partially supported by a grant to
the corresponding author from the Consejería de Educación,
Comunidad de Madrid, in the context of the INIA project SC-99-017.
REFERENCES
[1] Alemdag I.S., National site-index and height growth curves for
white spruce growing in natural stands in Canada, Can. J. For. Res.
21 (1991) 1466–1474.
[2] Bailey R.L., Clutter J.L., Base-age invariant polymorphic site
curve, For. Sci. 20 (1974) 155–159.
Inter-regional site index variability
[3] Beaumont J.F., Ung C.H., Bernier-Cardou M., Relating site index
to ecological factors in black spruce stands: tests of hypotheses,
For. Sci. 45 (1999) 484–491.
[4] Beland M., Bergeron Y., Height growth of jack pine (Pinus
banksiana) in relation to site types in boreal forests of Abatibi,
Quebec, Can. J. For. Res. 26 (1996) 2170–2179.
[5] Cañadas N., Pinus pinea L. en el Sistema Central (Valles del Tiétar
y del Alberche): desarrollo de un modelo de crecimiento y
producción de piđa, Tesis doctoral, E.T.S.I. de Montes,
Universidad Politécnica de Madrid, 2000, 356.
[6] Cao Q.V., Estimating coefficients of base-age invariant site index
equations, Can. J. For. Res. 23 (1993) 2343–2347.
[7] Carmean W.H., Site index curves for upland oaks in the Central
States, For. Sci. 18 (1972) 109–120.
[8] Carmean W.H., Forest site quality evaluation in the United States,
Adv. Agron. 27 (1975) 209–269.
[9] Chen H.Y.H., Klinka K., Kabzems R.D., Height growth and site
index models for trembling aspen (Populus tremuloides Michx.)
in northern British Columbia, For. Ecol. Manage. 102 (1998)
157–165.
[10] Cieszewski C.J., Bella I.E., Polymorphic height and site index
curves for lodgepole pine in Alberta, Can. J. For. Res. 19 (1989)
1151–1160.
[11] Duplat P., Tran-Ha M., Modélisation de la croissance en hauteur
dominante du chêne sessile (Quercus petraea Liebl) en France.
Variabilité inter-regionale et effet de la période récente (1959–
1992), Ann. Sci. For. 54 (1997) 611–634.
[12] Eflving B., Kiviste A., Construction of site index equations for
Pinus sylvestris L. using permanent plot data in Sweden, For. Ecol.
Manage. 98 (1997) 125–134.
[13] Gallant A.R., The power of the likelihood ratio test of location in
nonlinear regression models, J. Am. Stat. Assoc. 70 (1975) 198–203.
[14] García Güemes C., Modelo de simulación selvícola para Pinus
pinea L. en la provincia de Valladolid, Tesis doctoral, E.T.S.I. de
Montes, Universidad Politécnica de Madrid, 1999, 221.
[15] García O., A stochastic differential equation model for the height
growth of forest stands, Biometrics 39 (1983) 1059–1072.
[16] Goelz J.C.G., Burk T.E., Development of a well-behaved site index
equation: jack pine in north central Ontario, Can. J. For. Res. 22
(1992) 776–784.
269
[17] Huang S., Development of compatible height and site index models
for young and mature stands within an ecosystem-based
management framework, in: Amaro A., Tomé M. (Eds.), Empirical
and process based models for forest tree and stand growth
simulation, 1997.
[18] Huang S., Price D., Titus S.J., Development of ecoregion-based
height-diameter models for white spruce in boreal forests, For.
Ecol. Manage. 129 (2000) 125–141.
[19] Huet S., Jolivet E., Messéan A., La régression non-linaire :
méthodes et applications en biologie, INRA, Paris, 1992.
[20] Johansson T., Site index curves for european aspen (Populus
tremula L.) growing on forest land of different soils in Sweden,
Silva Fenn. 30 (1996) 437–458.
[21] Khattree R., Naik D.N., Applied multivariate statistics with SAS
software, SAS Institute Inc., Cary, NC, 1995.
[22] Kiviste A., Álvarez J.G., Rojo A., Ruiz A.D., Funciones de
crecimiento de aplicación en el ámbito forestal, Monografías INIA:
Forestal, 4, INIA, Madrid, 2002.
[23] Korf V., A mathematical definition of stand volume growth law,
Lesnicka Prace 18 (1939) 337–379.
[24] Monserud R.A., Height-growth and site index curves for inland
Douglas fir based on stem analysis and forest habitat type, For. Sci.
30 (1984) 943–965.
[25] Pillsbury N.H., Mc Donald P.M., Reliability of tanoak volume
equations when applied to different areas, West. J. App. For. 10
(1995) 72–78.
[26] Pita P.A., Clasificación provisional de las calidades de estación en
las masas de pino piđonero, Anales del Instituto Forestal de
Investigaciones y Experiencias (1966) 172–182.
[27] Richards F.J., A flexible growth function for empirical use, J. Exp.
Bot. 10 (1959) 290–300.
[28] Schumacher F.X., A new growth curve and its application to
timber-yield studies, J. For. 37 (1939) 819–820.
[29] Seber G.A.F., Wild C.J., Nonlinear regression, John Wiley & Sons,
New York, 1989.
[30] Weise W., Ertragstafeln für Kiefer, J. Springer, 1880.
[31] Zeide B., Standardization of growth curves, J. For. 76 (1978)
289–292.
[32] Zeide B., Analysis of growth equations, For. Sci. 39 (1993) 594–616.
To access this journal online:
www.edpsciences.org