Báo cáo lâm nghiệp:" How to relate the standing tree shape to internal wood characteristics: Proposal of an experimental method applied to poplar trees" pptx
Bạn đang xem bản rút gọn của tài liệu. Xem và tải ngay bản đầy đủ của tài liệu tại đây (1.11 MB, 8 trang )
371
Ann. For. Sci. 60 (2003) 371–378
© INRA, EDP Sciences, 2003
DOI: 10.1051/forest:2003028
Original article
How to relate the standing tree shape to internal wood characteristics:
Proposal of an experimental method applied to poplar trees
Thiéry CONSTANT*, Frédéric MOTHE, Miguel Angel BADIA and Laurent SAINT-ANDRE
LERFOB, UMR INRA-ENGREF, Wood Quality Research Team, Research Centre of Nancy, 54280 Champenoux, France
(Received 4 January 2002; accepted 8 July 2002)
Abstract – This paper presents an experimental method allowing 3D measurements of the geometry of a standing mature tree to be closely
linked to the spatial distribution of internal wood properties. The accuracy of the geometrical information is assessed from repeated
measurements performed on 10 mature poplar trees and demonstrates that wind is the most limiting factor. Since the method was developed to
study the spatial distribution of tension wood, some pictures of the latter are presented. Furthermore, some preliminary relationships between
variables derived from measurements such as the height, the local tree slope, the eccentricity of the tension wood area, or the eccentricity of the
disc are discussed to illustrate the potential of the method.
standing tree / 3D digitising / internal structure / reaction wood / metrology
Résumé – Comment connecter la forme d'un arbre sur pied aux propriétés internes du bois : proposition d'une méthode expérimentale
appliquée sur des peupliers. Cet article présente une méthode expérimentale de mesure de la géométrie tridimensionnelle d'un arbre sur pied
mature permettant un couplage étroit avec la mesure des propriétés internes du bois. La précision de l'information géométrique est estimée à
partir de mesures répétées sur 10 peupliers et met en évidence le vent comme principal facteur limitant. La méthode ayant été développée pour
étudier la distribution spatiale du bois de tension, quelques illustrations de cette dernière sont présentées. En outre, des relations préliminaires
liant des variables telles que la hauteur, l'inclinaison locale de l'arbre, l'excentricité de la zone de bois de tension ou l'excentricité de la rondelle
sont discutées afin d'illustrer le potentiel de la méthode.
arbre sur pied / digitalisation 3D / structure interne / bois de réaction / métrologie
1. INTRODUCTION
For technological purposes, the quality of wood products is
dramatically decreased by the amount of reaction wood. The
internal quality of a tree depends on numerous impacts occur-
ring throughout its life and tree shape is the visible result of
past growth. The forester uses this criterion when he selects
trees for thinning. At a less obvious level, the occurrence of
reaction wood is linked to the history of tree growth, and in
particular to the evolution of its shape where the environmental
factors and the competition for light play an important role.
During each growth cycle, the cambium produces new cells.
After maturation, they contribute with more or less intensity to
growth stresses. The level of stress is increased in the case of
reaction wood and is the driving force to tree shape change [2,
5–7, 10]. This phenomenon is often accompanied, but not sys-
tematically [3, 9, 12, 16], by anisotropic growth in diameter
which creates eccentricity for instance.
Thus, at a given moment, the relationship between the 3D
geometry of the annual growth rings and the occurrence of
reaction wood reflects the history of past secondary growth
and of past tree shape to a certain extent. The geometrical
information describing the shape, and the 3D spatial location
of the different entities that constitute a tree falls into the
domain of plant architecture. Godin [8] reviewed in detail the
different methods for representing and coding this type of
information. Most of the references deal with the aerial or
underground components [4, 14] in order to study their struc-
tures and to appreciate important functions such as the mecha-
nisms of competition.
Several scientific works have already been devoted to the
relationship between tree shape and internal wood characteri-
sation especially when looking at the relevance and spatial dis-
tribution of reaction wood in mature trees. Radi and Castera
[11] studied two maritime pines by measuring the shape along
an average line of the trunk and by cutting one disc at each
whorl. The percentage of compression wood and the eccentric-
ity, defined as the ratio of the maximum radius to the opposite
one, were related to the height up to 6 metres. Beyond this height
the relationships became less obvious and the relationship with
* Correspondence and reprints
Tel.: (33) 3 83 39 40 66; fax: (33) 3 83 39 40 69; e-mail:
372 T. Constant et al.
local inclination was poor. They pinpointed the relationship
between the percentage of compression wood and events such
as tilting or the first thinning. More recently Alteyrac et al. [1]
also analysed maritime pine tree and successfully compared its
shape to computerised simulations of the tree shape and inter-
nal characteristics. They measured several basic wood proper-
ties (modulus of elasticity, basic density, moisture content),
the tree architecture and stem dimension as well as residual
growth stresses which were used for further modelling. The
shape measurement was based on the measurement of targets
attached to the trunk and located by a triangulation method
from three fixed posts. Thomas [15] developed a quick photo-
grammetric method to characterise trunk shape up to 8 meters
height in a study which linked the trunk shape with the internal
quality of Pinus sylvestris. They concluded that the current
shape of a trunk is a good indicator of the location of compres-
sion wood but the relationship is complex and difficult to
assess without any knowledge of the tree history. Furthermore
Thomas confirmed, like several others, that the eccentricity of
the stem is statistically linked with the occurrence of compres-
sion wood.
The objective of this paper is to present the method devel-
oped in our laboratory to measure the geometry of a standing
mature tree and to relate it to the occurrence of reaction wood,
even though that growth stresses also must be considered.
To comply with experimental constraints, the tree is usually
divided into subsets, such as logs, discs and even smaller spec-
imens. The objective of the proposed method was to obtain the
geometry of these different objects in the coordinate system
corresponding to the standing tree, in order to analyse the spa-
tial distribution of wood characteristics using the most accu-
rate data. Our main assumption was to consider the tree as a
rigid body and to neglect the changes of shape of the stem and
logs before and after felling and bucking. For that it was nec-
essary to know the location of the considered object in a parent
reference system before its characterisation in a morphologi-
cally more suitable coordinate system.
Here three reference levels were used: (i) the first one
linked the field measurement and the standing tree where the
measured points deliver a rough skeleton of the tree, (ii) the
second one where the external shape of each log was measured
in detail and (iii) the third one where the surface of each cross-
section was measured.
This paper reports the results of measurements of ten poplar
trees and the internal wood characteristics of one individual
tree to illustrate the method and to assess its accuracy.
2. MATERIALS AND METHODS
2.1. Plant material
Ten poplar trees were used to test the method presented in this
paper. Their characteristics are shown in Table I.
2.2. Principle of the method
In a three-dimensional (3D) space associated with a Cartesian
coordinate system, the position of a rigid body was defined by
6 degrees of freedom corresponding to 3 translations and 3 rotations
respectively, along and around each axis of the coordinate system.
This position can be defined from 6 out of 9 coordinates of three non-
aligned points of the rigid body. That was the basis of the method: by
acquiring the coordinates of three non-aligned points on each object
in two different coordinate systems, it was possible to deduce the
mathematical transformation corresponding to the change between
both coordinate systems.
In practice, nails defined the points, and the considered objects
were the log in the tree or the disc in the log.
Once mathematically defined and applied to all measured objects,
these transformations deliver the coordinates of each measured point
in the coordinate system in which the standing tree was measured.
These data could be used directly for visualisation purposes or trans-
formed and exploited in data analyses.
2.3. Field measurement
2.3.1. Target positioning
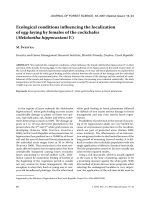
On the standing tree, a minimum of three targets per log was
defined by nails associated with a coloured plastic tag to make the ref-
erence point easy to recognize. The reference points were positioned
in a way which allowed to divide the trunk into logs with lengths
between 0.5 m and 2.0 m, suitable for the following operations. In
practice, the targets were placed at the top, at the bottom and in the
middle of each log. As a result, six targets per log were used (Fig. 1).
In order to position the targets, ladders or an aerial lift were used to
reach about 15 meters height.
2.3.2. Target measurements
A tacheometer (Total Station LEICA TCR307 reflectorless) was
used in order to acquire the 3D coordinates of each target set on the
trunk.
In addition to the defined targets, extra points were measured on
the main branches of the crown.
Then the tree was felled and bucked with respect to the planned
log length, taking care to not damage the targets. For none of the
10 trees measured by this method, the targets have been damaged by
felling, logging or transport operations.
2.4. Laboratory measurements
2.4.1. Measurement of the external shape of a log
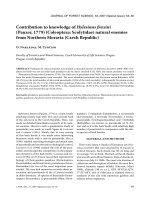
Each log was fixed onto an apparatus called AMEB (Appareil de
Mesure de l’Enveloppe des Billons) (Fig. 2) which was built in our
laboratory and has certain similarities to a lathe. The log was main-
tained between a fixed headstock and a moving tailstock mounted on
slides and moved by an endless screw in order to tighten the log lon-
gitudinally. Two rotating axes were integrated in their upper parts and
defined by building a horizontal rotation axis for the log. The log was
attached to these axes by screws through vertical plates. By means of
a cog-wheel and an endless screw attached to the axis of the fixed
headstock, the log could be rotated and maintained at a chosen angu-
lar position. An angular coder measured the latter.
Moreover, a laser distancemeter was mounted on a longitudinal
1-axis robot ensuring that the sensor moved parallel to the rotation
axis of the log. The technical characteristics of the main components
are given in the Annex 1. By means of a personal computer and control-
ling devices, the longitudinal location of the laser device was control-
led by fixed displacement (1 cm) between both ends of the log. After
each longitudinal step, the radial distance measured by the sensor was
Measurement of tree shape 373
recorded automatically. By repeating the previous phase for a set of
angular positions, for instance 36 positions corresponding to an angu-
lar step of 10°, a discrete description of the external shape of the log
was achieved. The corresponding triplets were given in a cylindrical
coordinate system defined by the rotation axis of the device, and can
be easily transformed in the Cartesian coordinates.
2.4.2. Target measurements and disc positioning
After the external shape was measured, the location of each target
was measured by controlling the motion of the robot and the rotation
of the log to set the laser spot manually. These measurements were
added to the set of data describing the log. At this stage, new targets
were added to define the position of the discs which were used for fur-
ther analyses. Using the same principle as above, three non-aligned
nails per disc were used.
2.4.3. Disc characterisation
The next stage was to cut discs taking care to include the 3 relevant
targets. In the example given, and to illustrate the method, the char-
acterisation of the disc included the annual ring limits, the outline of
the bark, the external limit of the black heart, and the edges of tension
wood areas. The method used to detect macroscopically the tension
wood areas is based on visual assessment of natural colour, which is
shiner than normal wood
1
.
By superimposing a transparent sheet, the different lines and the
projection of the 3 targets were traced using different colours. Then,
this sheet was scanned at 100 ppi, and the image file was analysed
with the image analysis software Visilog
®
5.3. The procedure mainly
consisted of a discretisation in small areas defined by angular sectors
centred on the pith and intersecting the annual ring limits. Here, 360
angular sectors and five year rings in radial direction were used. Each
of the small ring sectors was then characterised by its location, its age,
its area, and the percentage of its area corresponding to tension wood
or black heart.
Furthermore, a 3D geometrical description of the disc was obtained
by using the 2D coordinates of the targets in the image completed by
a manual measurement of the distance between the plane containing
the surface of the disc and each target.
2.5. Spatial reorganisation of the data
The geometrical transformation defining the change of the coordi-
nate system can be calculated by selecting 3 targets on the log whose
coordinates were known in the coordinate system corresponding to
Table I. Main dendrometric characteristics of the trees sampled with respect to shape indices i.e. straight, leaning and curved tree (Ht =total
height, DBH = diameter at breast height).
Name Species Region Age (year) Ht (m) DBH (cm) Ht/DBH Crown surface (m²) Shape index
FV1 Unknown
Velaine s/s
Amance
France
42 28.3 42 67.4 70.2
SI1
Populus x euramericana
cv. I214
Valle del Cinca
Spain
16 30.5 38 80.5 63.3
SI2
Populus x euramericana
cv. I214
Valle del Cinca
Spain
17 28.9 43 66.5 44.2
SI3
Populus x euramericana
cv. I214
Valle del Cinca
Spain
16 28.5 36 79.9 52.5
SM1
Populus x euramericana
cv. MC
Valle del Cinca
Spain
16 35.9 41 87.1 58.8
SM2
Populus x euramericana
cv. MC
Valle del Cinca
Spain
16 30.2 40 74.7 39.0
SM3
Populus x euramericana
cv. MC
Valle del Cinca
Spain
16 29.4 39 74.8 41.7
SL1
Populus x euramericana
cv. Luisa Avanzo
Valle del Cinca
Spain
16 30.2 43 69.8 62.8
SL2
Populus x euramericana
cv. Luisa Avanzo
Valle del Cinca
Spain
16 29.7 38 77.1 74.9
SL3
Populus x euramericana
cv. Luisa Avanzo
Valle del Cinca
Spain
16 27.4 41 65.7 70.7
1
A separated paper will be devoted to experimental validation of this method in comparisons to microscopic measurements.
374 T. Constant et al.
the standing tree and in the second one related to the AMEB. The
details are presented in Annex 2.
The transformation was applied to all points measured with
AMEB including the targets of the discs. Using this transformation
the coordinates of all points including the additional targets on the
discs were inserted into the coordinate system in which the standing
tree was measured.
The coordinates of the three targets of each disc were associated
with their positions in the 3D coordinate system related to the image.
The result was a precise location of the characteristics measured on
each disc in the standing tree.
3. RESULTS AND DISCUSSION
3.1. Visualisation
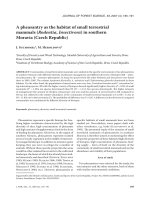
The comparison between the virtual model and a photo-
graph was the initial qualitative approach of this method
(Fig. 3). Data coherence may be verified at each stage of the
reconstruction process using a visualisation software which
allows to display and rotate each measured object (tree, logs,
discs) rendered with polygonal facets (Fig. 4).
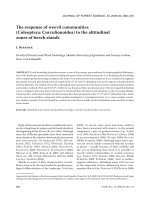
Figure 1. Tags positioning onto the living tree. Only 3 tags per log
are required for the 3D reconstruction procedure. The supplemental
tags are used to recover potential measurement errors.
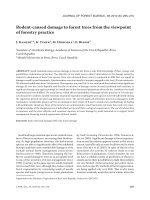
Figure 2. The AMEB device used to measure the external log shape
and locate the targets set on the standing tree and the targets
belonging to the discs.
Figure 3. Photographic view of tree FV1 and 3D perspective view of
the reconstructed shape.
Measurement of tree shape 375
3.2. Precision
Throughout the different stages of this method, the most
critical point for accuracy of tree reconstruction is the meas-
urement of the targets on the standing tree. An experiment was
carried out to quantify the precision of an operator when tar-
gets were measured by means of the tacheometer. The targets
were all measured twice without moving the total station in
order to test the accuracy of the measurements. This experi-
ment was performed for 9 different poplar trees selected for an
on-going project and totalling 499 targets measured twice.
The results (Fig. 5) outline the wind effect since, for 3 out
of 9 trees (SL1, SL2, SL3), a hampering wind was noticed in
the field report, and in Figure 5a, the residual variance for the
targets belonging to these trees is much higher than for the oth-
ers. One notices that the residual variance for the Z axis was
always low since Z corresponded to the vertical direction
and consequently the effect of wind was mainly in the other
directions.
Two more trees showed a relatively large residual variance
for the axis Y, and this was probably due to the fact that the
Y-axis corresponded to the distance to the tree. This high level
of variance can be linked to the principle of distance measurement
which may depend on several uncontrolled external features.
A more detailed analysis of the residual variances for each
axis with respect to the log height levels, coded from 1 (butt)
to 10 (top) is shown in Figure 5b. The effect of wind was
confirmed by the highest levels of variance since the log
number 6 which corresponded to a height between 10 and 12 m.
Therefore, two different levels of variance can be considered
to correspond respectively to measurements carried out under
good conditions (bottom of the tree, no wind, no leaves), and
under less favourable conditions (top of the tree, wind, leaves).
The analysis of the residual variance are presented in Table II
by distinguishing between two classes of accuracy for the tar-
get position: up to and including the sixth log, and above. In
absence of a true reference method, those results will be used
to estimate the accuracy of the method.
However, the second possibility to test the accuracy of the
tacheometer measurements is the comparison of the distance
between pairs of targets on the same log, which are measured
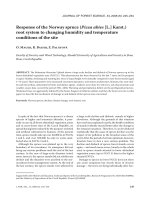
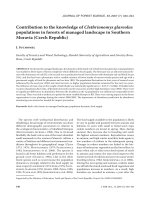
Figure 4. Illustration of the three lev-
els of shape analysis for tree FV1:
(A) skeleton of the standing tree;
(B) reconstruction of the tree shape
and of the sampled discs; (C) disc
measurements of tension wood; loca-
tion of the pith (M), the disc centre of
gravity (G) and the centre of gravity
of tension wood (T).
376 T. Constant et al.
both with total station and the AMEB. In that case, the meas-
urements with AMEB are considered as a reference which is
justified by its higher accuracy.
Even if the range of distances compared is limited by the
length of the logs, this approach to the accuracy is interesting
since the accuracy is assessed from confident measurements.
Such distances are close to those which could be used in a non
destructive assessment of the quality of standing trees to cal-
culate curvature, for example.
This analysis was performed using the data measured on
poplar FV1 in order to test our method. Three classes of dis-
tance were represented and were approximately centred on
125 mm, 700 mm and 1750 mm resulting from the arrange-
ment of targets along the tree. The maximum absolute error
was 6.2 mm for the 150 distances compared, the mean value
was 1.6 mm with a standard deviation of 1.3 mm. The maxi-
mal relative error was 5%, and on average 0.7%. This error
could be partially reduced by optimising the choice of the
three targets per log used for tree reconstruction.
3.3. Applied example
As an applied example, some preliminary results on the
relationships between shape and tension wood location are
derived from the measurements of the FV1 poplar (see Tab. I).
After the completion of the initial stages of the procedure
presented above (target positioning and measurement, log cut-
ting, measurement of log shape and target location with
AMEB), the internal structure of this tree was described using
41 discs taken at each 50 cm along the first 20 metres of the
trunk. The ring shape and the tension wood pattern were meas-
ured on each discs according to the method described in
Section 2.4.3.
Using these geometric data, we computed the pith location,
the centre of gravity of the disc [13] and the centre of gravity
of the tension wood area. The location of each disc inside the
tree being known, it was possible to estimate the local stem
slope as the angle between the vertical axis and a line joining
the centre of gravity of one disc to the next one. Figures 6 and 7
show that this local slope explained a large part of the variation
along the tree of the disc eccentricity (distance from the disc
centre of gravity to the pith, R
2
= 0.57) and of the tension
Table I I. Interval of uncertainty assessed for each of the 3D axes
using two repetitions of the target measurements without moving the
tacheometer for nine poplar trees with respect to the position of the
targets on the stem.
Logs 1–6 Logs > 6
Horizontal axis X (diameter) ±5.4 mm ±15.1 mm
Horizontal axis Y (distance to tree) ±7.2 mm ±20.8 mm
Vertical axis Z (height) ±3.5 mm ±7.3 mm
Figure 5. Variance of the difference of the
coordinate for each axis X, Y, and Z obtained
from two repetitions of target measurements
(6 per log) for nine poplar trees considered
individually (A) and with respect to the
position of the log in the tree (B) (1 = butt
log, 10 = highest log, length of log ~2 m).
Measurement of tree shape 377
wood eccentricity (distance from the centre of gravity of the
tension wood areas to the pith, R
2
= 0.62). In Figure 8, it can
be observed that the largest proportion of tension wood was
located on the opposite side of the direction in which the tree
was leaning. Both the orientations of the local stem slope and
the tension wood centre of gravity relative to pith followed a
similar pattern along the bottom meters of the trunk (R
2
=0.63
for the first 26 discs), which became asynchronous above 12 m
tree height (R
2
= 0.17 for the full set of data). This is probably
due to the increasing effect of the crown eccentricity.
These simple results obtained from only one tree already
show a potential of the method described for further studies
devoted to linking tree shape and wood quality.
4. CONCLUSIONS AND PERSPECTIVES
The experimental method which is described in this article,
aims to improve studies on the relationship between the mature
tree shape and the inner wood quality. The advantage of this
method is the close link between detailed geometrical infor-
mation and wood properties or internal characteristics such as
ring shape or reaction wood occurrence which allows a better
understanding of the complex and subtle relationship between
internal and external appearance of the tree.
This method remains time consuming and destructive but
fulfils one of its objectives i.e. to identify and quantify relevant
information linking the 3D shape of annual rings and wood
properties such as reaction wood. Some outputs could be cri-
teria which will be useful for foresters to improve their assess-
ment of the quality of standing trees, or in the sawmilling
industry for grading logs by deriving some criteria from the
log shape measurements which are already common practice.
Furthermore, this method might become a reference method in
tree shape measurement provided that wood quality is
involved. On-going research aims to model the location of
poplar tension wood inside the tree based on data collected
from the additional 9 trees (see Tab. I).
Different variants of the method will be tested and the
methodology will be evaluated, improved and simplified with
respect to an easy and time efficient use.
Acknowledgements: The authors are in particular grateful to M. Broto
and F. Rodriguez (Universitat de Lleida) for their help during the
field campaign and to C. Houssement and E. Farre (Lerfob INRA-
ENGREF) for their assistance in laboratory work. This research was
partly funded by CICYT (Comisión Interministerial de Ciencia y
Tecnología, Spain) project AGL2000-1255.
Figure 6. Local tree slope vs. distance from the pith to the disc centre
of gravity (distance MG shown in Fig. 4).
Figure 7. Local tree slope vs. distance from the pith to the tension
wood centre of gravity (distance MT shown in Fig. 4).
Figure 8. Variation of the local stem slope orientation (azimuth) and
of the tension wood centre of gravity orientation relative to pith
(angle between the horizontal axis and the line MT shown in Fig. 4)
with stem height.
378 T. Constant et al.
ANNEX 1
Estimation of the geometrical transformation correspond-
ing to the change between local and global coordinate systems
from three non aligned points measured in both systems.
Considering a rigid body where a triplet of non-aligned
points
(P
0
, P
1
, P
2
)
is marked, the positions of these points are
measured twice in two different Cartesian coordinate systems.
We consider as the global system and
as the local system where the geometry of the body is meas-
ured in detail.
From the triplet, a new orthonormal coordinate system is
built, where is defined as follows:
where
Ä is the cross product of two vectors and is the
length of vector .
By considering these vectors in each coordinate system, the
rotation matrix A can be defined from the three following
vectorial equations:
These equations can be translated into a set of nine solved
algebric equations. By associating this rotation to the translation
defined by the vector expressed in the global coordinate
system, all coordinates of the measured points in the local
coordinate system can be obtained in the global coordinate
system.
ANNEX 2
Technical specifications of the main components of the
measurement chain.
Tacheometer: Field measurement of the targets.
Model LEICA TCR307 reflectorless.
Angle Measurement 5".
Maximal distance measurement 80 m.
Accuracy 3 mm at 80 m.
Measurement time 3 s.
Magnification
´30.
AMEB: Laboratory measurements of the targets and of the
external shape of the logs.
Angular Coder: HEINDENHAIN, ROD 450.
Minimal angular step 1/100°
Laser: LIMAB LMS6035S
Accuracy 0.5 mm at 600 mm
1axis robot: CHARLY ROBOT PE225
Length 2.25 m
Step by Step Motor 140 Ncm
Minimal step 12.5
mm
Accuracy 0.1 mm at 2 m.
REFERENCES
[1] Alteyrac J., Fourcaud T., Castera P., Stokes A., Analysis and
simulation of stem righting movements in Maritime pine (Pinus
pinaster Ait.), in Proc. 3rd Workshop IUFRO WP S5.01-04, La
Londe-Les-Maures, France, 1999, 644 p.
[2] Archer R.R., Growth stresses and strains in trees, Timell T.E. (Ed.),
Springer-Verlag Series in Wood Science, 240 p.
[3] Clarke H., The distribution, structure, and properties of Tension
Wood in beech (Fagus sylvatica L.), J. For. (1937) 85–93.
[4] Danjon F., Sinoquet H., Godin C., Colin F., Drexhage M., Charac-
terisation of structural tree root architecture using 3D digitising and
AMAPmod software, Plant Soil 211 (1999) 241–258.
[5] Fourcaud Th., Lac P., Mechanical analysis of the form and internal
stresses of a growing tree by the Finite Element Method. Proc.
Engineering Systems Design and Analysis, ASME, Montpellier,
France, July 1–4, 1996, 77, pp. 213–220.
[6] Fournier M., Chanson B., Guitard D., Thibaut B., Mécanique de
l’arbre sur pied : modélisation d’une structure en croissance
soumise à des chargements permanents et évolutifs. 1. Analyse des
contraintes de support. 2. Analyse tridimensionnelle des contraintes
de maturation, cas du feuillu standard, Ann. Sci. For. 48 (1991)
513–546.
[7] Fournier M., Chanson B., Thibaut B., Guitard D., Mesures des
déformations résiduelles de croissance à la surface des arbres, en
relation avec leur morphologie. Observations sur différentes
espèces, Ann. Sci. For. 51 (1994) 249–266.
[8] Godin C., Representing and encoding plant architecture: A review,
Ann. For. Sci. 57 (2000) 413–438.
[9] Jourez B., Le bois de tension. 1. Définition et distribution dans
l’arbre. Biotechnologie, Agronomie, Société et Environnement 1
(1997) 100–112.
[10] Mattheck C., Kubler H., Wood. The internal optimization of trees,
Springer-Verlag, Berlin Heidelberg, 1995, 128 p.
[11] Radi M., Castera P., Qualification de deux pins maritimes en liaison
avec la structure de leur bois, Ann. Sci. For. 49 (1992) 185–200.
[12] Sacre E., Caractéristiques anatomiques et physiques du bois des
peupliers ‘I 214’, ‘robusta’ et ‘gelrica’ aux stades précoce et adulte,
Bulletin de la Société Royale Forestière de Belgique 84 (1977)
321–338.
[13] Saint-Andre L., Leban J M., An elliptical model for tree ring shape
in transverse section. Methodology and case study on Norway
Spruce, Holz Roh-Werkst 58 (2000) 368–374.
[14] Sinoquet H., Rivet P., Measurement and visualization of the
architecture of an adult tree based on a three-dimensional digitising
device, Trees 11 (1997) 265–270.
[15] Thomas R., Analyse des formes de troncs par photogrammétrie
pour caractériser la qualité des bois. Application au pin sylvestre de
Lozère. Ph.D. thesis in Wood Science, ENGREF Montpellier,
France, mars 2000, 193 p.
[16] Timell T.E., Compression wood in gymnosperms, Springer-Verlag,
Berlin Heidelberg, 1986, 2150 p.
OXYZ,,,() O
¢
xyz,,,()
P
0
uvw,,,()
u
P
0
P
1
P
0
P
1
=
,
v
uP
0
P
2
Ä
P
0
P
2
=
,
wuvÄ=
,
u
u
u
g
Au
l
=,
v
g
Av
l
=,
w
g
Aw
l
=.
OP
0