Báo cáo lâm nghiệp:"Estimation of crown radii and crown projection area from stem size and tree position" pps
Bạn đang xem bản rút gọn của tài liệu. Xem và tải ngay bản đầy đủ của tài liệu tại đây (807.37 KB, 10 trang )
393
Ann. For. Sci. 60 (2003) 393–402
© INRA, EDP Sciences, 2003
DOI: 10.1051/forest:2003031
Original article
Estimation of crown radii and crown projection area from stem size
and tree position
Rüdiger GROTE*
Chair for Forest Yield Science, Department of Ecology and Landscape Management, TU Munich, Am Hochanger 13, 85354 Freising, Germany
(Received 4 July 2001; accepted 17 October 2002)
Abstract – This paper describes a method for crown radii estimation in different cardinal directions using tree diameter, height, crown length,
and stem position within the stand as independent variables. The approach can serve for the initialisation of crown dimensions if measured
crown radii are not available in order to address various research questions. Test calculations are carried out with 4 pure spruce (Picea abies L.
Karst), 5 beech (Fagus sylvatica L.), and 6 mixed stands with both species. Simulated tree radii, crown projection area and canopy cover are
compared with measurements and simple estimation procedures based on logarithmic and linear equations. In beech stands and dense spruce
stands the estimates with the new approach are similar or superior to those obtained with the other methods. However, in sparse plots or in
stands, which have experienced a recent thinning crown size of trees is overestimated.
crown projection area / crown radii / Fagus sylvatica / mixed forests / Picea abies
Résumé – Estimation des rayons et de la zone de projection de la couronne en utilisant les dimensions de la tige et la position de l’arbre.
Cet article introduit une méthode mathématique qui permet une estimation du rayon, en utilisant seulement les dimensions de la tige de la
couronne et la position de l’arbre. Cette méthode permet d’initialiser les dimensions de la couronne dans le cas où on ne connaît pas les rayons
pour ainsi traiter de différentes questions scientifiques. La méthode est testée sur de nombreux peuplements d’ épicéas (Picea abies) et de hêtres
(Fagus sylvatica), non seulement constitués d’une seule essence mais aussi de forêts mixtes, dans le sud de l’Allemagne. Les simulations du
rayon des couronnes, de la surface de projection d’une couronne et du degré de couverture sont comparées avec des mesures et d’autres
estimations basées sur des équations linéaires ou logarithmiques. Les résultats montrent que la nouvelle méthode est appropriée pour la
représentation des rayons des couronnes de hêtres et pour des peuplements denses d’épicéa. En revanche le rayon et la surface de la couronne
d’arbres ayant poussé dans des lieux clairsemés ou ayant subi une éclaircie sont surestimés.
projection des couronnes / rayons des couronnes / Fagus sylvatica / forêts mixtes / Picea abies
1. INTRODUCTION
Many ecological and economic problems in forestry today
(e.g. continuous cover forestry, wood production and quality)
are approached using crown dimensional measures. For exam-
ple, individual tree competition indices are derived from crown
area estimates [6, 38] because crown dimension is a result of
past competition as well as an indicator of the current growth
potential [27]. Thus, crown dimensional measures are also
used in more sophisticated single-tree models – particularly
when forest growth in uneven-aged or mixed species stands is
addressed [40]. Furthermore, crown size and canopy cover
determine the probability of successful natural regeneration by
its influence on the pattern of shade, light, and rainfall on the
ground [49]. In general, many approaches of modelling light
distribution (e.g. [48]), water balance (e.g. [2, 37]), tree growth
(e.g. [7, 41]), and tree physiology (e.g. [50]) depend on infor-
mation about crown dimensions of individual trees. Possibly,
considering a more realistic crown shape will become increas-
ingly important also for stem quality simulation, because branch
dimension is one of the most important determinants [30].
Despite its importance crown extension remains difficult to
determine. It can only be measured by optical methods from
below [44] or from above [1], which both are subjected to a
likely underestimation of crown width due to a limited visibil-
ity of crowns. The crown projection area can be estimated from
stem dimensions [15, 52], but has to be thoroughly parameter-
ised for specific stand conditions [18], which in most cases
involves again a large number of direct measurements. Finally,
canopy cover can not be assumed to be the sum of tree crown
projection areas, because overlapping is a common phenome-
non particularly in dense, uneven-aged, and mixed stands.
The difficult measurements and the sensitivity of crown
dimension on management makes it desirable to develop esti-
mation procedures based on variables that are easier to measure
* Corresponding author:
394 R. Grote
than crown extension itself. Thus, maximum crown radius,
which can be derived from stem diameter, has been used to
estimate crown projection area [19, 51]. Because increasing
stand density results in increasing overestimates an adjustment
factor has been introduced that is generally derived from over-
lap estimates [13]. More recently, average crown radius and
canopy cover in several types of conifer forests were success-
fully estimated with regression equations that have been
derived from stem diameter, height, and/or crown length [17].
All of these methods are developed to give reliable results on
the stand level, which is suitable for many of the purposes
mentioned above. It is not sufficient, however, for analyses
that account explicitly for the asymmetry of crowns. Informa-
tion about asymmetric crown extension has been used e.g. for
detailed ecosystem characterisation [47] or the simulation of
wood quality [28, 45], radiation distribution [10, 11], suscep-
tibility of trees to windthrow [46], crown biomass [22], and
individual tree physiology [23]. Therefore, a method, which
estimates crown radii in various cardinal directions for every
tree in a given stand would be of great value for these research
areas. In this paper, such an approach is presented that is based
on the size of a tree and the size and position of surrounding
competitors. Also, the sum of crown projection area and can-
opy cover (the total area covered by canopy) are both calcu-
lated based on the estimated radii and results are compared
with those obtained with other methods.
2. MATERIALS AND METHODS
2.1. Stand description
In order to test the proposed method for crown radii estimation, a
number of forest stands were selected that include the most important
tree species and stand structure types in Germany. The stands consist
of trees with a coniferous (Picea abies L. Karst.) and a broadleaved
(Fagus sylvatica L.) tree species either in pure or mixed stands. All
of them belong to the network of long-term investigation plots in
Bavaria, South Germany and are maintained by the Chair for Forest
Yield Science in Freising. Thus, tree position, stem diameter, height,
height of crown base, and crown radii length had already been meas-
ured at many trees. The plots of pure spruce (Eurach, 4 plots) and
beech (Starnberg, 5 plots) both represent different degrees of stand
density. The mixed plots (Freising, 6 plots) represent different age
classes. All plots of one site are located closely together to minimise
differences in site conditions. For a more detailed description see
Table I. The plots of pure spruce and the mixed plots are furthermore
described in connection with other investigations [20, 42].
Diameter at breast height had been measured with a girth tape at
all trees. Tree height and crown base height of each tree within one
plot had been determined from height-diameter relations that are
derived from a subset of approximately 40 measured heights at each
plot. The visible crown extension in each of eight cardinal directions
had been measured by vertically looking up as described by Röhle
[43]. Calculations are carried out with all trees within the plots, but
trees at the plot boundaries are omitted from the results. This is nec-
essary because in these cases no competitors at the outward side are
considered and crown radii would thus be overestimated.
2.2. Distance dependent approach
The suggested approach is based on two assumptions. The first is
that the potential horizontal crown extension is a function of stem
diameter, and the second is that the distance between the tree and its
competitors determines the actual crown dimension within the limit
of the potential crown extension. Following Arney [3], competitors
are defined as trees with an overlap in potential crown extensions
(Fig. 1A). Crown radius length in a particular direction is limited by
the position of competitors within a certain angle on both sides of the
radius (Figs. 1A and 1B) and by their crown width at the height where
the maximum crown extension of a centre tree is assumed (Fig. 1C).
The method is further on referred to as ‘maximum radii estimation’
(MRE).
Table I. Site description of the stands used for evaluation.
Location Plot
no.
Reference
year
Yea r o f la st
thinning
Age Plot size
(m
2
)
Average height
(m)
Average diameter
(cm)
Stand density
(trees/ha)
Basal
area
(m
2
/ha)
Area
thinned*
(m
2
/ha)
Spruce Beech Spruce Beech Spruce Beech Spruce Beech
Eurach 1 1999 1996 47 1178 13.89 14.93 1477 25.9 0
2 47 1087 9.85 11.07 1638 15.8 2.9
3 47 1140 13.51 13.67 1316 19.3 6.5
4 47 1197 13.79 16.51 902 19.3 4.1
Starnberg 1 1993 1986 66 1520 16.51 17.58 623 15.1 3.8
2 66 1314 20.64 23.43 731 31.5 0.1
3 66 1423 16.38 16.75 485 10.7 4.6
4 66 1572 18.24 20.8 560 19.0 3.8
5 66 1623 19.69 19.68 327 9.9 4
Freising 1 1994 unknown 44 51 4285 23.51 22.28 24.66 19.28 558 352 36.9
2 77 97 5301 38.9 30.74 32.74 44.66 562 63 57.2
3 95 120 3071 43.83 47.94 37.14 50.87 168 130 44.6
4 88 103 2470 40.64 42.89 35.62 28.84 415 149 51.1
5 42 54 1983 26.64 17.83 14.98 17.25 1214 456 32.1
6 37 54 2642 25.51 13.42 16.18 12.29 847 1032 29.7
* Expressed in basal area loss, only dominant trees considered.
Estimation of crown dimensions 395
Firstly, in order to determine the height where maximum crown
width occurs, a crown shape function is required similar to those that
have been suggested by several authors during the last decades (e.g.
[8, 25, 26, 29, 35]). However, these equations require many parame-
ters that are not directly measurable (e.g. [25]), assume a steady
increase with canopy depth (e.g. [35]), or end with a zero-radius at
crown base height (e.g. [29]). In the current context, these properties
are considered as disadvantages. Thus, a new one-parameter equation
is used that describes crown radius at every height h (r
h
) as a function
of crown base height (hcr), crown length (lcr), and the maximum
radius in a particular cardinal direction (r
max
). The term relH refers
to the relative height within the crown, which is 0 at crown base and
1 at the tip of the tree.
Eq. (1a)
Eq. (1b)
Eq. (1c)
The effect of the base-term in equation (1c) is demonstrated in
Figure 2, with r
max
= 1 and a crown length of 15 m. In a detailed anal-
ysis of 12 trees, values of base were found to be 1.23 ± 0.074 for
spruce and 2.02 ± 0.71 for beech [21]. However, the standard devia-
tion can be decreased if base is derived from crown length according
to equation (1d) (1.23 ± 0.071 for spruce and 2.08 ± 0.345 for beech)
with ps equal to 0.018 (R
2
= 0.65) and 0.0756 (R
2
= 0.54) for spruce
and beech respectively.
Eq. (1d)
ps: shape parameter.
To determine the maximum crown radii of one tree, the maximum
crown extension for the competitor trees j are needed but generally
not known. Thus, for a given competitor, r
max,j
is calculated from the
distance to tree i (d
ij
) and from diameter at breast height (dbh) of both
trees according to equation 2. The distance between a tree and its
competitor d
ij
can easily be calculated from stem positions.
Eq. (2)
However, r
max
of any tree is limited to its potential radius (r
pot
),
which describes the physical maximum is hardly affected by site con-
ditions [24]. Since no open grown trees were available, r
pot
is esti-
mated from the 5% relative largest crown radii found at the trial plots.
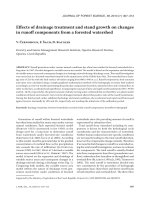
Figure 1. Determination of maximum crown radius per cardinal
direction. (A) Selection of competitor trees that are in the range of
the centre tree. (B) Radius limitation for r
1–4
by competitor positions
(stem position of a competitor tree is indicated by a cross). (C)
Radius limitation by competitor crown extension (here only for r
2
).
T
i
= centre tree, r
pot
= potential radius of T
i
, T
1–4
= competitors with
crown width at the height of maximum crown extension of T
i
, a
s
=
angle between simulated radii (only 4 radii (r
1–4
) are considered,
whereas the calculations are based on 8 radii), a
1–3
= angle between
T
i
and the competitors relevant for the determination of r
1
, T
4
’=
virtual mirror tree for determination of radius length r
2
.
r
h
r
max
1 relH–()fh()×
max 1 relH–()fh()×[]
×=
relH
hhcr–
lcr
=
f
h() base
100
hhcr–
lcr
2
èø
æö
=.
Figure 2. Effect of the ‘base’-variable in equation 1 on crown shape
(inserting a crown length of 15 m for l
cr
). 0 = crown base, 1 = tip of
the tree.
base 1 ps lcr×+=
r
max j,
d
ij
dbh
j
dbh
j
dbh
i
+
.
×=
396 R. Grote
To determine these radii, firstly all radii (with 8 radii measured per
tree) are exponentially fitted to the stem diameter at ground height do
(MS Excel software package). The 5% selected radii are the ones with
the largest positive deviation from this relation. Another exponential
fit through these radii according to equation 3 derives the parameter
pr
1
and pr
2
. The diameter at ground height is derived from dbh by
assuming a certain diameter decrease of the bole with increasing
height (0.3 cm m
–1
). It is used as independent variable instead of dbh
because otherwise equation 3 would imply that small trees (< 1.3 m
height) have no crowns at all, which would restrict the generality of
the approach. Parameters are determined separately for each tree spe-
cies and for pure and mixed stands although the differences between
the relations for spruces in different stand structure types were not
significant (Fig. 3). Values for pr
1
and pr
2
together with the number
of radii that have been used to derive the functions are given in
Table II.
Eq. (3)
(r
pot
and do in m).
From r
max,j
the potential crown extension of all competitor trees is
calculated for every height according to equation 1 in height steps of
0.5 m. In this calculation, r
h
of competing trees below the height of
maximum crown diameter is set to r
max
to better account for the influ-
ence of light competition in deeper canopy layers.
In the next step, the angle a
ij
between the tree (i)
and its competi-
tor (j) is calculated from tree positions (Fig. 1A). Assuming that a
branch will grow until it reaches the crown circumference of a com-
petitor tree, the length of each crown radius is calculated as follows
(Fig. 1C):
Eq. (4a)
Eq. (4b)
Eq. (4c)
r
h,i
: actual radius of centre tree i at height h; r
poth,i
: potential radius of
centre tree i in height h; r
poth,j
: potential radius of competitor tree j in
height h; T
i
S: distance between stem position and the point of inter-
section; l: help variable; T
j
T’
j
: distance between competitor tree j and
a point, mirrored at the radius prolongation (T’
j
is described as a ‘vir-
tual mirror tree’ in Fig. 1C).
The actual radius of r
h,i
is calculated as the minimum radius deter-
mined by considering every competitor within angle a
s
on both sides
of the radius (see illustration in Fig. 1A). Based on former investiga-
tion results [33, 44] and test calculations with different angles, a
s
is
set to 45
o
(8 radii).
Since first calculations showed that the largest crown radii in one
direction was too often equal to the potential radii, a further restriction
was introduced to get more realistic results for r
max
. As illustrated in
Figure 1B, the assumption is made that a radius can not grow beyond
Figure 3. Measured crown radii in dependence on stem
diameter at ground height. The lines indicate the
potential radius r
pot
for a given diameter separated for
tree species (beech: circles, spruce: triangles) and stand
type (A: pure stands, B: mixed stands). Larger points and
triangles indicate the 5% of relative largest radii that are
used to build the boundary function.
r
pot
pr
1
do
pr
2
×=
r
hi,
min T
i
Sr
pot hi,
,()=
T
i
S a
ij
d
ij
l–×cos=
lr
pot hj,
T
j
T
j
¢
×=
Estimation of crown dimensions 397
the stem position of a competitor tree. Despite these limitations, it
should be recognised that an overlap between crowns can result from
the elliptical connection between two adjacent radii (see further
down).
2.3. Other calculations
Currently, the most common estimation procedures of crown pro-
jection area are based on linear [17] or logarithmic [31, 52] relation-
ships between stem and crown diameter. Thus, simple calculations
are carried out using linear correlations between dbh and radius
length (r
max
in dm = a
lin1
+ b
lin1
´ dbh), and dbh and crown projec-
tion area (A in m
2
= a
lin2
+ b
lin2
´ dbh in cm) of individual trees.
Crown projection area is also calculated with a logarithmic relation to
stem cross-sectional area (lnA = a
log
+ b
log
´ ln(dbh
2
´ p ´ 0.25)).
The parameter a
log
and b
log
are derived analytically from the same
data set as pr
1
and pr
2
and are also presented in Table II for each tree
species and for pure and mixed plots (not for each plot!). In order to
derive crown projection area from measured and simulated crown
radii, the area between the radii is considered as a fraction of an
ellipse [44]. Canopy cover is calculated with a computer program that
draws the crown projection area of every tree on a grid and counts the
number of coloured pixels.
3. RESULTS
The relation between simulated and measured radii is
shown in Figures 4A–4D. The coefficient of determination
ranges from 0.2 for pure spruce to 0.45 for beech in mixed
stands. A small bias is obvious in every figure, which indicates
an overestimation of small radii and an underestimation of
large radii. This is at least partly due to radii that had been
measured with zero length, which can not be represented with
the MRE method due to the assumption made in equation 2.
Slope values with the regression line forced through the origin
are presented in Table III separately for species and sites
together with the respective R
2
values. The table shows that
despite the bias positive correlation coefficients had been
obtained with the MRE method in all cases, but not with the
estimation based on the linear approach.
Figure 5 and Table IV show that MRE does not decrease
the accuracy of crown projection area estimates compared
with the fitted logarithmic (LOG) and the linear method (LIN).
The slope values obtained with every method are similar (in
average over all plots separated by species: MRE = 1.00, LOG =
0.91, LIN = 0.96) although the standard deviation of MRE is
highest (MRE = 0.25, LOG = 0.12, LIN = 0.15). The R
2
values
of MRE are similar to those obtained with the LOG approach
and are higher than R
2
values obtained with the linear
approach (MRE = 0.64
± 0.15, LOG = 0.61 ± 0.16, LIN =
0.50
± 0.23, with all negative values excluded from the aver-
age). However, crown projection area for spruce is somewhat
overestimated, particularly in the mixed plots (+4 and +28%
mean deviation from measurements for pure and mixed plots
respectively), whereas for beech it is generally underestimated
(–15 and –17%).
The goodness of fit apparently depends on the density of the
plot and of the thinning intensity that the stand has been treated
with (see Tab. I). In the plots Eurach 1 and Starnberg 2, which
are the most dense for each species, the deviation from the 1:1
line is only marginal (spruce –4%, beech +1%) and the simulated
values are closely correlated with measured crown projection
area (R
2
= 0.7 and 0.8 for spruce and beech respectively). In
spruce, overestimation increases in sparser plots (up to 23% in
the sparsest plot Eurach 2), whereas for beech crown projec-
tion area is underestimated in thinned plots but no particular
trend with the intensity of thinning is obvious.
The sum of crown projection areas within one plot is similar
to that calculated from the measurements although an overes-
timation for spruce (+9%) and an underestimation for beech
(–19%) is obtained (Tab. V). Again, the simulation of the
densest plots for both species are closest to the measurements
(Eurach 1: –6%, Starnberg 2: –4%).
Table V shows canopy cover values derived from either
measured or simulated crown radii. Additionally, crown over-
lap is calculated from the difference between the sum of single
tree crown projection areas and canopy cover. This demon-
strates that the overlap derived with the MRE method is gen-
erally too small. In spruce stands, however, this underestimation
is only slight (–3%), whereas it is in average –14% for beech
stands. Mixed stands are in between (in average –6%).
Table II. Parameter, estimated for determination of radius length and
potential crown cover (pr1 and pr2: maximum radii, alin1 and blin1:
linear radii estimation, alog and blog: logarithmic crown area
estimation, alin1 and blin2: linear crown area estimation, see text for
equations and dimensions).
Pure stands Mixed stands
Spruce n Beech n Spruce n Beech n
pr1 5.89 46 8.24 19 6.43 29 12.30 19
pr2 0.34 0.24 0.37 0.31
alin1 5.24 486
4
7.28 181
9
7.09 324
4
8.51 271
2
blin1 0.66 0.86 0.44 0.73
alog –1.38 607 –0.97 231 –1.28 411 –0.91 342
blog 0.67 0.70 0.60 0.68
alin2 –1.98 607 –4.44 231 1.13 411 –6.00 342
blin2 0.68 1.33 0.52 1.43
Table III. Comparison of the distance dependent method and the
dbh-based estimation of crown radii (MRE: distance dependent
method with 8 radii based estimation, LIN: based on linear correla-
tion to dbh; * = within 10% confidence interval, ** = within 5%
confidence interval).
Location Species n
radii
Slope
(MRE)
r
2
(MRE)
Slope
(LIN)
r
2
(LIN)
Eurach spruce 4864 0.957** 0.08 0.912* –0.27
Starnberg beech 1384 0.825* 0.27 0.878** –0.34
Freising spruce 1816 1.111* 0.26 0.907* –0.41
Freising beech 1808 0.762 0.42 0.809 –0.38
Freising mixed 3624 0.898* 0.26 0.847 –0.28
398 R. Grote
Figure 4. Simulated vs. measured crown radii in pure stands (A: spruce, B: beech) and mixed stands (C: spruce, D: beech).
Estimation of crown dimensions 399
Figure 5. Comparison of crown projection areas calculated from simulated and measured crown radii in pure stands (A: spruce, B: beech) and
mixed stands (C: spruce, D: beech).
400 R. Grote
4. DISCUSSION
Results indicate that the MRE method can be used to esti-
mate crown radii for beech and spruce in dense stands but has
to be applied cautiously. Although some of the variance may
be due to the high inaccuracy of crown measurements [43],
crown radii of trees from sparse plots or in recently thinned
stands are generally overestimated. This is consistent with the
underlying assumption of a balanced crown extension, which
can not be expected in heavily thinned stands and which is
more likely with morphological flexible tree species like
beech than with spruce [4, 16].
Future tests and improvements of the MRE approach will
focus on crown shape estimation, which is based on a quite
small sample size of trees yet. Only a larger sample provides
the possibility to establish dependencies of crown shape on
spacing and competition that have been already found in other
investigations [5, 12, 14, 32, 34]. Further improvements could
be based on the finding that in mixed stands spruce radii are
generally over and beech radii are underestimated. This would
be mitigated if a species-specific weighing factor for the cal-
culation of potential spruce and beech radii is introduced in
equation 2. However, it is not clear from the limited set of test
sites to which degree the effect is due to the stand structure
rather than species-specific properties. Although they are
older, most beeches of the mixed plots are smaller than the
spruces. Thus, the assumption that crowns of small trees are
restricted by the largest extension of competitor crowns rather
than their actual extension may affect beeches more than the
spruces at these particular plots. In this case, separate crown
radii estimations for different crown layers may produce more
favourable results but simulations of differently structured
mixed stands are required to test this assumption.
Improvements in crown radii estimates will generally posi-
tively affect crown projection area and canopy cover esti-
mates. Nevertheless, the good agreement of simulated and
measured canopy cover despite the underestimation of crown
projection area in beech stands shows that the estimation of
Table IV. Slope and correlation coefficients of simulated against measurement-based crown cover calculations (n: number of trees that are
considered for the calculations, MRE: distance dependent method, LOG: based on logarithmic correlation, LIN: based on linear correlation).
Location Plot no. Species n Slope (MRE) r
2
(MRE) Slope (LOG) r
2
(LOG) Slope (LIN) r
2
(LIN)
Eurach 1 Spruce 174 0.96 0.70 0.99 0.73 0.97 0.69
2 172 1.23 0.63 0.91 0.53 0.91 0.50
3 154 1.17 0.62 0.94 0.53 0.94 0.48
4 108 1.00 0.48 0.81 0.54 0.79 0.44
Over all 608 1.04 0.56 0.91 0.63 0.90 0.58
Starnberg 1 Beech 60 0.80 0.78 0.87 0.85 0.86 0.82
2 60 1.01 0.80 1.24 0.54 1.24 0.28
3 38 0.76 0.79 0.77 0.85 0.75 0.86
4 48 0.85 0.63 0.95 0.52 0.97 0.46
5 27 0.92 0.81 0.85 0.86 0.83 0.87
Over all 173 0.85 0.76 0.91 0.68 0.90 0.61
Freising 1 Spruce 65 1.50 0.43 0.86 0.50 1.03 0.38
2 119 1.31 –0.15 0.98 –0.24 1.10 –1.30
3 31 1.17 0.37 0.84 –0.61 0.93 –1.88
4 44 1.10 –1.25 0.97 0.37 1.05 –0.05
5 83 1.20 0.48 0.90 0.49 1.21 0.11
6 69 1.41 0.67 0.79 0.69 1.05 0.31
Over all 227 1.28 0.46 0.92 0.60 1.06 0.37
Freising 1 Beech 98 0.73 0.37 1.10 0.55 1.20 0.57
2 18 0.93 0.87 0.98 0.77 0.89 0.53
3 11 0.95 0.43 0.79 –0.53 0.72 –1.56
4 24 0.88 0.64 0.96 0.33 0.96 0.15
5 73 0.55 0.49 0.85 0.43 0.95 0.40
6 118 0.61 0.69 0.68 0.68 0.75 0.68
Over all 226 0.83 0.77 0.89 0.77 0.88 0.69
Freising 1 Total 162 0.92 0.19 1.04 0.59 1.16 0.61
2 137 1.03 0.71 0.98 0.88 0.95 0.75
3 42 0.98 0.73 0.80 0.75 0.75 0.63
4 68 0.95 0.44 0.96 0.56 0.99 0.43
5 156 0.64 0.22 0.86 0.69 0.98 0.56
6 187 0.73 0.39 0.70 0.71 0.80 0.60
Over all 453 0.93 0.66 0.90 0.77 0.91 0.66
Estimation of crown dimensions 401
crown overlap is also subjected to errors. Again, species-spe-
cific differences have to be considered since the predicted
overlap for spruce trees is quite close to the measurement-
based calculations. This finding strengthen the assumption
that a separate calculation of different crown layers may be
necessary.
The MRE method aims not preliminary on a precise esti-
mate of crown projection area or canopy cover. Over all, the
logarithmic approach, which is used here as an example for
similar and sometimes more sophisticated procedures (e.g.
[13, 17, 51]), produced slightly better results and would per-
form even better if parameters would have been fitted for each
plot separately. Furthermore, the estimates produced with the
MRE method seem to be more sensitive to stand density
effects than established estimation methods [9] – at least for
trees with inflexible crowns.
However, the author has found no other approach that esti-
mates crown radii for different cardinal directions. Thus, the
demand for crown asymmetry-information that has been for-
mulated in various fields of research (scaling, light modelling,
estimation of windthrow susceptibility, wood quality, and
crown biomass) can currently only be fulfilled with actual
measurements. Despite the scatter, the immanent bias, and the
dependency of accuracy on species and stand density, the
MRE method may thus be used as a substitute for measured
crown radii in cases where these are not available but informa-
tion about crown asymmetry is needed. While stem diameter,
tree height, and crown length are often directly measured or
can be estimated with suitable equations (e.g. [24, 36]), the
acquisition of tree position data in the field may be more diffi-
cult and expensive. However, also tree positions can be gener-
ated based on stand inventory data (e.g. [39]), which may be
sufficient for many of the purposes mentioned above.
Acknowledgements: This research has been conducted within the
framework of the joint-research project ‘Growth and Parasite
Defence’, funded by the German Research Agency (DFG). The Chair
of Forest Yield Science, lead by Hans Pretzsch, supported the
research generously with the supply of basic data, collected and
processed by Martin Nickel, Leonhard Steinacker, and Martin
Bachmann. Furthermore, I’d like to thank Hans Pretzsch, Greg
Biging (Berkeley University, California), and the two anonymous
reviewers, who made valuable comments to the manuscript, as well
as Thomas Seifert, who provided yet unpublished data for the
parameter estimation of crown shape for spruce trees.
REFERENCES
[1] Akça A., Aerophotogrammetrische Messung der Baumkronen,
AFZ/Der Wald 30 (1983) 772–773.
[2] Alsheimer M., Köstner B., Falge E., Tenhunen J.D., Temporal and
spatial variation in transpiration of Norway spruce stands within a
forested catchment of the Fichtelgebirge, Germany, Ann. Sci. For.
55 (1998) 103–123.
[3] Arney J.D., Computer Simulation of Douglas-fir Tree and Stand
Growth. Philosophy, Oregon State University, 1972.
[4] Assmann E., Die Theorie der Grundflächenhaltung und die Praxis
der Bestandespflege bei der Rotbuche, Forst- u. Holzwirt /5 (1954).
[5] Baldwin J.V.C., Peterson K.D., Clark III A., Ferguson R.B., Strub
M.R., Bower D.R., The effects of spacing and thinning on stand and
tree characteristics of 38-year old Loblolly Pine, For. Ecol. Man-
age. 137 (2000) 91–102.
[6] Bella I.E., A new competition model for individual trees, For. Sci.
17 (1971) 364–372.
[7] Biging G.S., Dobbertin M., Evaluation of competition indices in
individual tree growth models, For. Sci. 41/2 (1995) 360–377.
Table V. Comparison of total crown area and covered ground area, calculated from measured and estimated crown radii (MRE: distance
dependent method, sd: standard deviation).
Location Plot no. Species Sum of crown area Sum of crown covered ground Multiple coverage
Measured
(m
2
)
sd MRE
(m
2
)
% sd Measured
(m
2
)
sd MRE
(m
2
)
%sd Measured
(m
2
)
%MRE
(m
2
)
%
Eurach 1 Spruce 1363 1288 94 879 956 109 484 36 331 26
2 955 1174 123 727 881 121 228 24 293 25
3 1095 1293 118 771 866 112 324 30 427 33
4 1135 1217 107 754 899 119 380 34 318 26
Average 1137 146 1243 109 50 783 58 901 115 34 354 31 342 28
Starnberg 1 Beech 1219 948 78 746 700 94 473 39 247 26
2 980 941 96 639 668 105 340 35 273 29
3 885 599 68 514 499 97 370 42 101 17
4 839 676 81 494 602 122 345 41 74 11
5 639 549 86 597 491 82 43 7 58 11
Average 912 189 743 81 169 598 91 592 99 86 314 34 151 20
Freising 1 Mixed 2669 2457 92 1759 1818 103 910 34 639 26
2 2747 3469 126 2266 2597 115 481 18 872 25
3 1426 1597 112 1112 1213 109 315 22 384 24
4 1541 1646 107 1125 1189 106 416 27 456 28
5 1807 1387 77 992 960 97 815 45 426 31
6 2242 1789 80 1215 1310 108 1027 46 479 27
Average 2072 518 2057 99 714 1411 454 1515 107 549 661 32 543 26
402 R. Grote
[8] Biging G.S., Wensel L.C., Estimation of the crown form for six
conifer species of northern California, Can. J. For. Res. 20 (1990)
1137–1142.
[9] Bonnor G.M., The Influence of Stand Density on the Correlation of
Stem Diameter with Crown Width and Height for Lodgepole Pine,
For. Chron. 40/3 (1964) 347–349.
[10] Brunner A., A light model for spatially explicit forest stand models,
For. Ecol. Manage. 107 (1998) 19–46.
[11] Cescatti A., Modelling the radiative transfer in discontinuous can-
opies of asymmetric crowns. I. Model structure and algorithms,
Ecol. Modell. 101/2-3 (1997) 263–274.
[12] Chen H.Y.H., Klinka K., Kayahara G.J., Effects of light on growth,
crown architecture, and specific leaf area for naturally established
Pinus contorta var. latifolia and Pseudotsuga menziesii var. glauca
saplings, Can. J. For. Res. 26 (1996) 1149–1157.
[13] Crookston N.L., Stage A.R., Percent canopy cover and stand struc-
ture statistics from the Forest Vegetation simulator, no. RMRS-
GTR-24, Department of Agriculture, Forest Service, Rocky Mountain
Research Station, Ogden, UT, 1999.
[14] Deleuze C., Hervé J.C., Colin F., Modelling crown shape of Picea
abies: spacing effects, Can. J. For. Res. 26 (1996) 1957–1966.
[15] Dubrasich M.E., Hann D.W., Tappeiner II J.C., Methods for evalu-
ating crown area profiles of forest stands, Can. J. For. Res. 27
(1997) 385–392.
[16] Franz F., Pretzsch H., Nüsslein S., Strukturentwicklung und
Wuchsverhalten von Buchenbeständen - Ertragskundliche Merk-
male des Schirmschlag-Femelschlag-Verjüngungsverfahrens im
Spessart, Allg. Forst- und Jagdztg. 160/6 (1989) 114–123.
[17] Gill S.J., Biging G.S., Murphy E.C., Modeling conifer tree crown
radius and estimating canopy cover, For. Ecol. Manage. 126 (2000)
405–416.
[18] Gilmore D.W., Equations to describe crown allometry of Larix
require local validation, For. Ecol. Manage. 148 (2001) 109–116.
[19] Goelz J.C.G., Open-grown crown radius of eleven bottom-land
hardwood species: prediction and use in assessing stocking, S.J.
Appl. For. 20/3 (1996) 156–161.
[20] Grauer A., Auswirkungen unterschiedlicher Moorwasserstände auf
das Wachstum von Fichtenbeständen im Versuch EURACH 259.
Lehrstuhl f. Waldwachstumskunde, TUM, Freising, 2000.
[21] Grote R., Foliage and branch biomass estimation of coniferous and
deciduous tree species, Silva Fennica 36 (2002) 779–788.
[22] Grote R., Von der Baumdimension zur Biomasse und wieder
zurück - Ein neuer Ansatz zur dynamischen Modellierung von
Baum- und Bestandesbiomassen, in: Dietrich H P., Raspe S.,
Preuhsler T. (Eds.), Inventur von Biomasse- und Nährstoffvorräten
in Waldbeständen, Wissenschaftszentrum Weihenstephan, München,
2002, pp. 129–138.
[23] Grote R., Pretzsch H., A Model for Individual Tree Development
Based on Physiological Processes, Plant Biology 4/2 (2002) 167–180.
[24] Hasenauer H., Dimensional relationships of open-grown trees in
Austria, For. Ecol. Manage. 96 (1997) 197–206.
[25] Honer T.G., Crown shape in open- and forest-grown balsam fir and
black spruce, Can. J. For. Res. 1 (1971) 203–207.
[26] Ishii H., Clement J.P., Shaw D.C., Branch growth and crown form
in old coastal Douglas-fir, For. Ecol. Manage. 131 (2000) 81–91.
[27] Iwasa Y., Cohen D., Cohen J.A.L., Tree Height and Crown Shape
as Results of Competitive Games, J. Theoret. Biol. 112 (1984)
279–297.
[28] Kellomäki S., Ikonen V P., Peltola H., Kolström T., Modelling the
structural growth of Scots pine with implications for wood quality,
Ecol. Modell. 122 (1999) 117–134.
[29] Kikuzawa K., Umeki K., Effect of Canopy Structure on Degree of
Asymmetry of Competition in Two Forest Stands in Northern
Japan, Ann. Bot. 77 (1996) 565–571.
[30] Kramer H., Zur Qualitätsentwicklung junger Kiefernbestände in
Abhängigkeit vom Ausgangsverband, Der Forst- und Holzwirt 32/
23 (1977) 1–7.
[31] Laar van A., The Influence of Stand Density on Crown Dimensions
of Pinus radiata D. Don, Forestry in South Africa 3 (1963) 133–143.
[32] Mäkelä A., Vanninen P., Impacts of size and competition on tree
form and distribution of aboveground biomass in Scots pine, Can.
J. For. Res. 28/2 (1998) 216–227.
[33] Mayer R., Kronengröße und Zuwachsleistung der Traubeneiche auf
süddeutschen Standorten, Allg. Forst- und Jagdztg. 129 (1958)
105–114.
[34] Medhurst J.L., Beadle C.L., Crown architecture and leaf area index
development in thinned and unthinned Eucalyptus nitens planta-
tions, Tree Physiol. 21 (2001) 989–999.
[35] Mitchell K.J., Dynamics of simulated yield of Douglas-fir, For. Sci.
Monogr. 17 (1975) 1–39.
[36] Monserud R.A., Marshall D., Allometric crown relations in three
northern Idaho conifer species, Can. J. For. Res. 29/5 (1999) 521–535.
[37] Oltchev A., Constantin J., Gravenhorst G., Ibrom A., Heimann J.,
Schmidt J., Falk M., Morgenstern K., Richter I., Vygodskaya N.,
Application of a six-layer SVAT model for simulation of eva-
potranspiration and water uptake in a spruce forest, J. Phys. Chem.
Earth 21/3 (1996) 195–199.
[38] Opie J.E., Predictability of individual tree growth using various
definitions of competing basal area, For. Sci. 14 (1968) 314–323.
[39] Pommerening A., Biber P., Stoyan D., Pretzsch H., Neue Methoden
zur Analyse und Charakterisierung von Bestandesstrukturen,
Forstw. Cbl. 1/2 (2000) 62–78.
[40] Pretzsch H., Konzeption und Konstruktion von Wuchsmodellen für
Rein- und Mischbestände. Forstliche Forschungsberichte München.
Vol. 115, Forstwissenschaftliche Fakultät der Universität München,
München, 1992.
[41] Pretzsch H., Biber P., Dursky J., The single tree-based stand simu-
lator SILVA: construction, application and evaluation, For. Ecol.
Manage. 162 (2002) 3–21.
[42] Pretzsch H., Kahn M., Grote R., Die Fichten-Buchen-Mischbestände
des Sonderforschungsbereiches “Wachstum oder Parasitenabwehr?”
im Kranzberger Forst, Forstw. Cbl. 117 (1998) 241–257.
[43] Röhle H., Vergleichende Untersuchungen zur Ermittlung der
Genauigkeit bei der Ablotung von Kronenradien mit dem Dachlot
und durch senkrechtes Anvisieren des Kronenrandes, Forstarchiv
57 (1986) 67–71.
[44] Röhle H., Huber W., Untersuchungen zur Methode der Ablotung
von Kronenradien und der Berechnung von Kronengrundflächen,
Forstarchiv 56 (1985) 238–243.
[45] Seifert T., Integration von Holzqualitätsmodellen in den Wald-
wachstumssimulator SILVA, in: Jahrestagung. Schwarzberg, Sek-
tion Ertragskunde des Deutschen Verbandes Forstlicher Forsc-
hungsanstalten, 2002.
[46] Skatter S., Kucera B., Tree breakage from torsional wind loading
due to crown asymmetry, For. Ecol. Manage. 135 (2000) 97–103.
[47] Song B., Chen J., Desanker P.V., Reed D.D., Modeling canopy
structure and heterogeneity across scales: From crowns to canopy,
For. Ecol. Manage. 96 (1997) 217–229.
[48] Stadt K.J., Lieffers V.J., MIXLIGHT: a flexible light transmission
model for mixed-species forest stands, Agric. For. Meteorol. 102
(2000) 235–252.
[49] Utschig H., Analyzing the development of regeneration under
crown cover: Inventory methods and results from 10 years of obser-
vation, in: Skovsgaard J.P., Burkhart H.E. (Eds.), IUFRO – Recent
Advances in Forest Mensuration and Growth and Yield Research,
Danish Forest and Landscape Research Institute/Ministry of Envi-
ronment and Energy, Tampere, Finland, 1995, pp. 234–241.
[50] Wang Y.P., Jarvis P.G., Description and validation of an array
model - MAESTRO, Agric. For. Meteorol. 51 (1990) 257–280.
[51] Warbington R., Levitan J., How to estimate canopy cover using
maximum crown width/DBH relationships, in: Stand Inventory
Technologies '92 Conference, Portland, OR, Am. Soc. for Photo-
grammetry and Remote Sensing, Bethesda, MD, USA, 1992.
[52] Wile B.C., Crown Size and Stem Diameter in Red Spruce and Bal-
sam Fir, no. 47-1056, Department of Forestry, Forest Research
Branch, Ottawa, Canada, 1964.