Báo cáo lâm nghiệp:" Dynamics of litterfall in a chronosequence of Douglas-fir (Pseudotsuga menziesii Franco) stands in the Beaujolais mounts (France)" potx
Bạn đang xem bản rút gọn của tài liệu. Xem và tải ngay bản đầy đủ của tài liệu tại đây (535.95 KB, 14 trang )
475
Ann. For. Sci. 60 (2003) 475–488
© INRA, EDP Sciences, 2003
DOI: 10.1051/forest:2003041
Original article
Dynamics of litterfall in a chronosequence of Douglas-fir (Pseudotsuga
menziesii Franco) stands in the Beaujolais mounts (France)
Jacques RANGER*, Frédéric GERARD, Monika LINDEMANN, Dominique GELHAYE,
Louisette GELHAYE
INRA, Centre de Nancy, Unité Biogéochimie des Ecosystèmes Forestiers, 54280 Champenoux, France
(Received 29 April 2002; accepted 20 December 2002)
Abstract – Litterfall is a major component of the carbon and nutrient cycles in forest ecosystems. Results of the present study are from a
chronosequence of Douglas-fir stands monitored continuously for seven years. Aboveground litterfall was measured every three months, sorted
by components, and analysed for major nutrients. Results make it possible to characterize the dynamics of organic matter and nutrient returns
to the forest floor during stand development. Simple extrapolation was used to estimate the total return in litter, cumulated over a 70-year-
rotation length. Already published data were collected in order to try to identify simple relationships capable of predicting the litterfall return
from structural stand characteristics. These models failed to be predictive, due on the one hand to insufficient data, and, on the other hand, to
data not always perfectly comparable. Litterfall is a quantitative ecological measurement necessary to validate the models of ecosystem
function.
Douglas-fir / litterfall / nutrient cycling / chronosequence / litter traps
Résumé – Dynamique des retombées de litière dans une chronoséquence de Douglas (Pseudotsuga menziesii Franco) située dans les
Monts du Beaujolais (France). Les retombées de litières représentent un paramètre écologique fonctionnel important des écosystèmes
forestiers, apportant des informations-clés sur le cycle du carbone et des éléments nutritifs. Les résultats présentés dans cette étude proviennent
d’une chronoséquence de trois peuplements de Douglas situés dans les Monts du Beaujolais, étudiée pendant sept années. La litière a été
collectée tous les trimestres, séparée en compartiments et analysée pour son contenu en éléments nutritifs. Les résultats permettent d’analyser
en détail la dynamique des restitutions de carbone et d’éléments nutritifs au cours du développement du peuplement. Une extrapolation simple
permet de calculer les retombées cumulées pour la révolution forestière complète. Une analyse bibliographique a permis de sélectionner une
vingtaine de peuplements de Douglas pour lesquels les restitutions de litière ont été mesurées. L’objectif était de mettre en évidence des relations
statistiques simples permettant d’estimer les restitutions de litière à partir de données de structure des peuplements, existant plus couramment
dans la littérature. L’analyse des données montre que ces modèles généraux ne peuvent pas encore être élaborés, d’une part faute de données
suffisamment nombreuses, et d’autre part faute de données parfaitement comparables. Les mesures écologiques quantitatives telles que les
retombées de litière, doivent être poursuivies de façon à pouvoir valider des modèles de fonctionnement d’écosystèmes.
Douglas / retombées de litière / cycle des éléments / chronoséquence / pièges à litière
1. INTRODUCTION
In all forest types, the aboveground litterfall represents a
major component of the carbon and nutrient cycles. It is one of
the most efficient processes supporting the different soil func-
tions over the long term i.e. agronomic, ecological and envi-
ronmental.
Agronomic function. Litterfall provides the soil with soil
organic matter which has numerous well known interests, e.g.
substrate for organisms, efficient cement for soil aggregates,
reservoir of nutrients [10]. It also provides the topsoil with
large amounts of nutrients which were previously taken up
from the whole available soil pool [27]. It is a natural process
acting against soil acidification. In strongly acidic soils, or in
soils without any weatherable minerals such as a large number
of tropical soils, but also temperate ones, litterfall supplies
nutrient cations (Ca, Mg, K) to the upper part of the soil pro-
file, which tend to disappear due to their low competitiveness
regarding ion exchange reactions when compared to Al [18].
Ecological function. Forest soils are characterized by a
high carbon content compared with cultivated soils [4].
Organic material is the most efficient substrate for micro-
organisms and biodiversity is far greater in forest than in culti-
vated soils. The quality and amount of litterfall depends on for-
est vegetation leading to a direct effect of forest management
on soil functions [2].
a
Corresponding author:
476 J. Ranger et al.
Environmental function. The soil carbon reservoir is one
of the largest carbon reservoirs on the scale of the earth and its
stability has become a major factor in global climatic changes.
Soil carbon and nutrient cycles naturally alleviate soil acidifi-
cation and the detrimental processes associated with it, which
constrains the surface waters.
On a global scale, the amount of litterfall depends on many
factors, but above all on stand productivity which is primarily
controlled by the climate and secondarily by the forest species.
Vogt et al. (1986) [34] calculated that litterfall (data expressed
in kg·ha
–1
·yr
–1
) ranged between 5500 and 15 300, 3300 and
8900, and 150 to 5725 respectively for tropical, temperate and
boreal forests. Broadleaved species seem to be more sensitive
to climate than coniferous species, but the large variability of
situations makes it difficult to identify the origin of the differ-
ences. Several reviews have been written on this topic [5, 8,
21, 27, 34].
These studies provide relevant information on a global scale,
but as they mix genera, species, treatments and site conditions,
they may not be helpful for local ecosystem investigations.
The objectives of the study were (i) to quantify the dynam-
ics of C and nutrient returns to soil by means of aboveground
litterfall during the particular development stages of the stand,
and for the whole rotation of a Douglas-fir plantation, and,
(ii) to compare the results with already published data for
Douglas-fir stands in order to estimate the proportion of the
stand nutrient uptake from soil reserves and recycled by litter-
fall directly from aboveground biomass data, which is a more
easily available parameter than litterfall.
2. MATERIALS AND METHODS
2.1. Location
The study site was located in the “massif forestier des Aiguil-
lettes”, at an altitude of 750 m in “les Monts du Beaujolais”, 40 km
NW of Lyon (France). Rainfall was about 1000 mm per year and
mean annual temperature was 7 °C [19].
2.2. Soil characteristics
Soils were developed on a Visean compact volcanic tuff rich in
alkaline and earth alkaline elements i.e. 2% CaO and 1.9% MgO. Par-
ent material weathering was mainly associated to dissolution proc-
esses, leading to a chemically poor residual phase [12]. The soil of the
Alocrisoil [1] (i.e. Typic Dystrochrept type, [33]) was acidic (pH
ranging from 4.2 to 4.5 according to the soil horizon) and desaturated
(alkaline and earth alkaline cations represented between 8 and 20%
of the total CEC depending on the soil horizon).
The soil organic matter content ranged between 6 and 8% with a
C/N ratio between 11 and 12 in the A
1
horizon. The soil was coarse-
textured and unevenly stony. Roots developed mainly in the top
60 cm but can reach 120 cm [19]. The main soil characteristics are
listed in Table I.
2.3. Stand characteristics
A chronosequence of three stands aged 20, 40 and 60 years in
1992 were selected to study the dynamics of the ecosystem. Their
main characteristics are presented in Table II [24]. Stands belong to
the 1st yield class defined by Decourt (1967) [9] leading to a high
mean annual production of 17 m
3
·ha
–1
·year
–1
at age 60.
2.4. Litterfall collection
Litterfall was collected in each stand from July 1992 to August
1996 using 15 plastic containers 0.30 × 0.45 cm wide, and perforated
Tab le I. Main soil characteristics for the three Douglas-fir stands.
20-year-old stand 40-year-old stand 60-year-old stand
0–12 cm 25–40 cm 60–85 cm 0–15 cm 30–45 cm 65–85 cm 0–10 cm 20–35 cm 65–85 cm
Ap1 Bw2 Bw3 Ap1 A/Bw Bw2 Ap1 Bw2 Bw3
pH water
Clay content (% of fine earth at 105 °C)
MO (% of fine earth at 105 °C)
N (% of fine earth at 105 °C)
C/N
Ca exh (cmolc·kg od dry matter at 105 °C)
Mgexh (cmolc·kg od dry matter at 105 °C)
Alexh (cmolc·kg od dry matter at 105 °C)
CEC (cmolc·kg od dry matter at 105 °C)
BS%
P2O5 available (Duchaufour and Bonneau, 1959) [11]
Al Tamm (1922) [29]
Fe DCB (Mehra and Jackson, 1960) [20]
4.2
19.4
8.5
0.4
12
0.78
0.23
7.1
9.1
15
0.06
0.71
0.94
4.4
18.1
4.2
0.2
11
0.34
0.13
4.7
5.6
13
0.04
0.63
0.94
4.8
16
1
0.08
8
0.68
0.28
3.7
5.1
25
0.08
0.51
0.88
4.4
19.9
5.7
0.27
12
0.35
0.11
6.6
7.8
9
0.02
0.66
0.97
4.4
23.6
1.6
0.09
11
0.13
0.04
4.8
5.3
7
0.02
0.37
0.91
4.4
18.5
0.4
0.03
8
0.11
0.04
4.3
4.8
8
0.02
0.23
0.8
4.3
21.7
8.2
0.37
12.8
0.61
0.18
5.8
7.7
15
0.02
0.62
0.93
4.5
23.2
3.1
0.15
12.1
0.18
0.07
4.2
4.9
11
0.01
0.39
0.9
4.5
19
0.33
0.02
8
0.17
0.08
4.2
4.9
10
0.01
0.2
0.65
Table II. Main stand characteristics in 1992.
Stand age (years) 20 40 60
Mean height (m) 14.3 28.0 36.0
Mean cbh (cm) 57 104.7 163.7
Stand basal area (m
2
) 24.2 47.4 64.8
Stand density (nb of trees per ha) 922 490 312
Standing biomass (t·ha
–1
)
– crown
– stem (bark and wood)
– roots (total) (1)
34.2
65.5
nd
38.6
223.5
58.3
65.8
352
nd
(1) Measured in 1999; at this date the standing aboveground total bio-
mass was about the same because of a thinning operation.
Nd: not determinated.
Dynamics of litterfall in Douglas-fir 477
at the bottom for water drainage. They were systematically distrib-
uted in the plot along two rows (15 m between rows and 5 m between
traps). The plastic containers were then replaced by larger ones, man-
ufactured by Icare SA, 0.75 × 0.75 cm wide, in order to homogenize
the data with the sites of the French Renécofor network for forest eco-
system observation [32]. Larger collectors were supposed to improve
the accuracy of measurements. In fact, to test this hypothesis, the two
types of collectors were used simultaneously in the three stands, for
roughly 1.5 years (from spring 1995 to summer 1996). The two sets
of traps were put side by side in the 40-year-old stand. Samples were
collected every three months, individually for each collector at the
beginning, and then together in one overall sample for the rest of the
time. Samples were oven-dried to constant weight at 65 °C. They
were then sorted manually into ten main components i.e. Douglas-fir
brown needles (bn), Douglas-fir dead wood (dw), Douglas-fir green
needles (gn), Douglas-fir living wood (lw), Douglas-fir bark (b),
Douglas-fir cones (c), Douglas-fir flowers and buds (fb), leaves from
other species (l) (local or brought by wind), a remaining component
(fine parts impossible to identify) called miscellaneous (m).
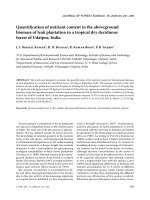
Comparison of the two litter-traps i.e. small traps (ST) and large
traps (LT), showed that there were no significant differences between
the two types of traps for total litterfall, or for the different compo-
nents (needles, branches and twigs). The trends were exactly the same
(Fig. 1) and the mean value for one sampling was 894 kg·ha
–1
for LT
and 908 kg·ha
–1
for ST. The agreement for needles seems relatively
normal, but was more surprising for wood because the size of
branches was large when compared to the collectors. This is probably
due to the fact that Douglas-fir branches fell in small pieces, and not
often as whole branches. This conclusion could not be extended to
species with better self-pruning.
Sampling was systematically carried out every three periods of
four weeks from July 92 to December 99 (except in the 60-year-old
stand clear-felled in October 1998). Distribution according to seasons
was made considering the maximum lapse of time belonging to a cal-
endar season; no attempt was made to correct the discrepancy with
the real calendar season. Total year was considered as the sum of four
seasons.
2.5. Sample analysis
After drying to constant weight in an oven at 65 °C, the samples
were finely ground and conditioned in polyethylene containers. After
moisture control, samples were analysed for major nutrients (N, P, K,
Ca and Mg). A mean weighed sample was analysed for each compo-
nent present, in each stand at each sampling time. P, K, Ca and Mg
were determined after acid digestion (H
2
O
2
+ HClO
4
), by ICP spec-
trophotometry (Jobin Yvon Ultrase). Total N was determined by
colorimetry on a Traacs microflux system, after Kjeldahl mineralisation.
2.6. Tentative generalisation using data
from the literature
A literature review was made in order to collect additional data on
Douglas-fir stands. Seventeen Douglas-fir sites were selected, when
data on stand structure, biomass production (stem, branches and nee-
dles), and aboveground litterfall mass (needle litter and wood litter)
and litterfall nutrient content were available. The additional data set
concerned five sites of the French Renécofor network [32] and 12
from North American studies, both from naturally regenerated sites
and from plantations [15, 16, 30, 31]. The database is presented in
Annex I.
2.7. Statistical data processing
Elementary statistics and analysis of variance were operated using
the UNISTAT statistical package (v. 5.0) in order to compare the data
of the three stands of the chronosequence. Analysis of variance was
used to identify the main factors of variability from the whole data set
(4 annual sampling times during 7 years in the 20- and 40-year-old
Figure 1. Comparison of two litter collectors in a 40-year-old Douglas-fir stand.
478 J. Ranger et al.
stands, and during 6 years in the 60-year-old stand clear-cut in
Autumn 1998) i.e. stand age, season and year. As it was a non repli-
cated experiment (i.e. not several chronosequences) the limited
amount of data prevented us from testing the interaction between year
effect and stand age.
3. RESULTS
3.1. Dry matter production of aboveground litterfall
Litterfall mass amounted to 3950 kg·ha
–1
·yr
–1
in the 20-
year-old stand. It was higher than in the older stands where the
production was very similar, about 3350 kg·ha
–1
·yr
–1
(Tab. III).
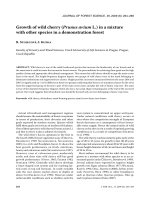
Brown needles represent the largest component of the litter-
fall (respectively 83, 64 and 52% in the 20, 40 and 60-year old
stands), dead wood was relatively constant around 10%.
Another important component was the green material which
increased with stand age (respectively 1, 12 and 22% in the 20-,
40- and 60-year-old stands) (Fig. 2).
The inter-annual variability was relatively high for all com-
ponents. This appeared clearly in Figure 3 for total litterfall
with variations reaching ± 30% of the mean value, and 150%
between the minimum and the maximum values. The seasonal
variability was not often significant, due to the high inter-
annual variability. Significant seasonal differences appeared
for brown needle fall, which occurred mainly in autumn; no
seasonal trend appeared for dead wood (Fig. 4).
Stand age effect was significant for brown needles (20 >
40 = 60-year-old stand) but not for the dead wood. It was not
significant for the total litterfall, because green needles and
live wood components increased with stand age, and tended to
compensate for the trend of brown needles. The mean annual
trend for total litterfall production was relatively similar
between the 20- and the 40-year-old stands with minimum val-
ues for the same years. The behaviour was different for the 60-
year-old stand.
3.2. Nutrient concentration
The detailed results concerning the major components, i.e.
brown needles and dead wood (representing between 65 and 90%
of the litterfall, see previous section), and mean annual results
concerning the other components are presented in Table IV.
It appeared that N, P, K and Mg were more concentrated in
green needles than in brown needles; concerning wood, the
dead wood was the most concentrated litter compartment in N,
but it was generally the reverse for P, K and Mg. N concentra-
tion in bark was higher than in wood, but it was the reverse for
P, K and Mg. Concerning Ca, old tissues were more concen-
trated than young ones i.e. green needles > brown needles,
dead wood ≥ green wood. The relative ranking of the other
components was more variable. The inter-annual variability
only slightly affected the ranking between all the components.
Season had a much larger influence on needles than on
wood, indicating a difference in the origin of litter: needle litter
did not necessarily correspond to the oldest needles while
wood litter contained old wood, strongly affected in the tree
crown by internal translocation of nutrients, nutrient leaching
by rainfall, physical and microbial decaying processes. Sea-
sonal variations for needle litter were relatively constant: con-
centrations in the spring and the winter were higher than in the
summer and the autumn for N, P and K; the reverse was
observed for Ca. A lack of significant seasonal variations was
observed for other elements.
The effect of stand age on nutrient concentration in major
components showed a general trend of significantly higher
concentrations for all elements and for all the seasons in the
younger stand. This trend was confirmed for the mean annual
variations (Tab. IV).
3.3. Nutrient content
The total return of nutrients per ha and year associated to
litterfall amounted to 56, 33 and 32 kg for N, 3.8, 2.2 and
Figure 2. Pie diagram representing the distribution of the various components of litterfall in the Douglas-fir chronosequence of stands.
20-year-old stand
40-year-old stand
60-year-old stand
Dynamics of litterfall in Douglas-fir 479
Table III. Litterfall biomass and nutrient content for the different components according to stand age (data in kg·ha
–1
·yr
–1
).
Compartment Season
Dry matter N P K Ca Mg Mn S Al
20 40 60 20 40 60 20 40 60 20 40 60 20 40 60 20 40 60 20 40 60 20 40 60 20 40 60
Summer 987 462 391 13.5 5.74 4.86 1.04 0.35 0.33 2.01 0.83 0.53 9.65 3.29 2.73 1.03 0.33 0.28
abb abb abb abb abb
Autumn 1010 1125 883 13.0 9.68 7.53 0.83 0.62 0.48 1.89 1.56 1.29 9.90 10.3 8.39 0.99 0.86 0.72
ns ns ns ns ns ns ns ns ns ns ns ns ns ns ns ns ns ns
Brown needles Spring 561 262 242 9.45 3.56 3.30 0.64 0.23 0.22 1.16 0.57 0.68 4.93 1.79 1.68 0.49 0.17 0.19
abb abb abb abb abb abb
Winter 728 233 280 11.7 3.10 3.63 0.75 0.19 0.23 1.73 0.49 0.59 6.41 1.53 1.80 0.72 0.19 0.22
abb abb abb abb abb abb
Total 3287 2081 1795 47.6 22.1 19.3 3.25 1.39 1.26 6.78 3.44 3.09 30.9 16.9 14.6 3.23 1.55 1.40 4.94 3.66 2.55 1.02 0.59 0.29 0.25 0.11 0.35
Summer 78.5 98.7 49.6 1.01 0.81 0.38 0.06 0.06 0.03 0.13 0.17 0.09 0.50 0.50 0.27 0.06 0.05 0.03
ns ns ns ns ns ns ns ns ns ns ns ns ns ns ns
Autumn 52.4 66.7 136 0.63 0.46 0.76 0.04 0.03 0.06 0.13 0.09 0.18 0.34 0.35 0.81 0.04 0.04 0.07
ns ns ns ns ns ns ns ns ns ns ns ns ns ns ns ns ns ns
Brown wood Spring 112 129 126 0.94 0.86 0.68 0.06 0.06 0.04 0.11 0.20 0.15 0.45 0.55 0.68 0.05 0.05 0.05
ns ns ns ns ns ns ns ns ns ns ns ns ns ns ns ns ns ns
Winter 65.7 89.3 73.2 0.91 0.62 0.61 0.06 0.04 0.04 0.16 0.14 0.13 0.48 0.44 0.36 0.06 0.05 0.03
ns ns ns ns ns ns ns ns ns ns ns ns ns ns ns ns ns ns
Total 308 383 385 3.49 2.76 2.43 0.22 0.19 0.17 0.53 0.59 0.56 1.77 1.84 2.12 0.20 0.19 0.18 0.22 0.22 0.17 0.07 0.07 0.04 0.01 0.01 0.01
Green needles 34 293 621 0.51 3.50 6.13 0.04 0.26 0.43 0.22 1.28 2.67 0.18 1.46 2.85 0.04 0.28 0.44 0.06 0.66 0.99 0.02 0.07 0.04 0.00 0.00 0.01
Green wood 8.99 245 238 0.06 1.25 1.07 0.01 0.13 0.10 0.03 0.58 0.45 0.04 0.99 0.98 0.00 0.12 0.09 0.20 0.12 0.02 0.01 0.00 0.01
Cones 10.1 75.1 77.5 0.03 0.35 0.19 0.00 0.04 0.01 0.02 0.18 0.11 0.01 0.06 0.03 0.00 0.04 0.02 0.00 0.03 0.00 0.00 0.01 0.00 0.00 0.00 0.00
Bark 4.10 5.32 9.38 0.09 0.06 0.07 0.00 0.00 0.00 0.01 0.01 0.00 0.04 0.02 0.03 0.00 0.00 0.00 0.01 0.00 0.00 0.00 0.00 0.00 0.00 0.00 0.00
Leaves 90.1 5.76 0.00 1.53 0.08 0.00 0.10 0.00 0.00 0.30 0.02 0.00 0.97 0.03 0.00 0.16 0.01 0.00 0.18 0.01 0.00 0.05 0.00 0.00 0.00 0.00 0.00
Flowers and buds 30.2 54.1 76.2 0.17 0.23 0.53 0.01 0.03 0.04 0.05 0.08 0.09 0.07 0.13 0.21 0.02 0.03 0.04 0.01 0.03 0.00 0.01 0.02 0.00 0.00 0.00 0.00
Miscellaneous 173 194 185 2.88 2.36 2.23 0.19 0.18 0.16 0.38 0.42 0.35 1.17 0.66 0.68 0.22 0.16 0.15 0.36 0.28 0.21 0.07 0.06 0.05 0.07 0.08 0.18
Total 3946 3337 3387 56.4 32.7 32.0 3.82 2.22 2.16 8.32 6.61 7.32 35.1 22.1 21.5 3.87 2.38 2.33 5.78 5.10 4.04 1.24 0.84 0.42 0.32 0.20 0.56
480 J. Ranger et al.
2.2 kg
for P, 8.3, 6.6 and 7.3 kg for K, 35, 22 and 22 kg
for Ca
and 3.9, 2.4 and 2.3 kg
for Mg, respectively in the 20-, 40- and
60-year-old stands. This amount was strongly related to the lit-
terfall production, and was higher for all elements in the young
stand. Brown needles represented most of the nutrients
released annually to the top soil. The relative distribution of
nutrients was strongly related to the biomass distribution. Some
disagreement occurred for green needles, which were more
concentrated than the brown ones. They accounted for 18% of
the litterfall in the 60-year-old stand, but for 36% of the K. The
inter-annual variability was relatively high for all components.
The seasonal variability was not often significant, com-
pared with the high inter-annual variability. Significant sea-
sonal differences appeared for brown needle fall, which
occurred mainly in autumn.
As for dry matter, the effect of stand age was significant for
the brown needle nutrient content (N, P, Ca, Mg content of
20 > 40 = 60-year-old stand) but not for the dead wood. The
effect of stand age was significant for the nutrient content of
total litterfall with the highest significant level of returns in the
20-year-old stand for N, P, Ca and Mg.
4. DISCUSSION
Aboveground litter production decreased with stand age, as
usually observed [3]. Nevertheless, litter production measured
here remained higher than the 1.5 t·ha
–1
observed by Kestemont
(1977) [17] in a 70-year-old Douglas-fir in Belgium.
The maximum total litterfall usually occurred in a forest
stand during the maximum current annual production, when
stand density is rather high. This may be generalized to all spe-
cies, broadleaved [26] or needle leaved [28].
The inter-annual variability tended to show that the mean
annual value calculated for a specific component or for the
Figure 3. Inter-annual variability of total litterfall in the Douglas-fir
stands.
V. Mean annual nutrient concentrations for the different components of the litterfall in the Douglas-fir chronosequence (data expressed in p100 of dry matter at 65 °C).
NP K CaMg Mn S AI
Stand age/
component
20 40 60 20 40 60 20 40 60 20 40 60 20 40 60 20 40 60 20 40 60 20 40 60
Brown needles
Summer
1.34 1.18 1.15 0.1 0.07 0.08 0.20 a 0.18 a 0.14 b 0.97 a 0.71 b 0.70 b 0.10 a 0.07 b 0.07 b
Autumn
1.29 a 0.91 b 0.91 b 0.08 a 0.06 b 0.06 b 0.19 0.14 0.17 0.97 0.88 0.94 0.09 a 0.07 b 0.08 ab
Winter
1.68 a 1.38 a 1.36 a 0.11 a 0.09 b 0.09 b 0.21 0.24 0.28 0.89 a 0.66 b 0.69 b 0.09 a 0.07 b 0.08 c
Spring
1.61 a 1.35 b 1.30 b 0.10 a 0.08 b 0.08 b 0.24 0.21 0.21 0.88 a 0.65 b 0.64 b 0.10 a 0.08 b 0.08 b
Brown needles 1.46 a 1.18 b 1.16 b 0.1 a 0.07 b 0.08 b 0.21 ns 0.19 ns0.2 ns 0.93 a 0.74 b 0.76 b 0.1 a 0.07 b 0.08 b 0.21 ns 0.23 ns 0.19 ns 0.07 ns 0.06 ns 0.05 ns 0.02 ns 0.01 ns 0.04 ns
mean annual
Brown wood
Summer
1.29 a 0.82 b 0.78 b 0.08 a 0.06 b 0.05 b 0.17 0.18 0.17 0.64 a 0.51 b 0.50 b 0.07 a 0.05 b 0.05 b
Autumn
1.34 a 0.76 b 0.64 b 0.08 a 0.05 b 0.05 b 0.25 a 0.14 b 0.14 b 0.64 a 0.49 b 0.56 ab 0.08 a 0.05 b 0.05 b
Winter
1.41 a 0.71 b 0.57 b 0.09 a 0.05 b 0.04 b 0.16 0.17 0.13 0.65 a 0.42 b 0.54 c 0.07 a 0.04 b 0.04 b
Spring
1.31 a 0.74 b 0.82 b 0.09 a 0.05 b 0.04 b 0.23 a 0.14 b 0.17 b 0.69 a 0.47 b 0.50 b 0.08 a 0.05 b 0.05 b
Brown wood 1.34 a 0.76 b 0.7 b 0.08 a 0.05 b 0.05 b 0.21 a 0.16 b 0.15 b 0.65 a 0.48 b 0.53 c 0.08 a 0.05 b 0.05 b 0.11 a 0.09 b 0.08 b 0.06 ns 0.04 ns 0.04 ns 0.01 ns 0.01 ns 0.02 ns
mean annual
Green needles 1.67 1.42 1.29 0.12 0.11 0.09 0.75 0.56 0.57 0.61 0.51 0.58 0.12 0.1 0.09 0.25 0.25 0.23 0.07 0.06 0.01 0.02
Green wood 0.91 0.72 0.65 0.09 0.08 0.06 0.43 0.37 0.29 0.54 0.44 0.53 0.07 0.06 0.05 0.09 0.09 0.07 0.04 0.02 0.01 0.02
Cones 0.42 0.76 0.39 0.02 0.05 0.03 0.15 0.15 0.19 0.11 0.47 0.05 0.03 0.05 0.04 0.02 0.09 0.01 0.05 0.02
Bark 2.12 1.17 0.96 0.1 0.06 0.03 0.18 0.11 0.07 0.89 0.28 0.34 0.09 0.05 0.03 0.19 0.07 0.03
Leaves 1.95 1.49 0.13 0.09 0.4 0.44 1.1 0.56 0.18 0.11 0.26 0.33
Flowers and buds 1.37 0.68 0.77 0.11 0.06 0.05 0.37 0.15 0.2 0.5 0.27 0.27 0.11 0.06 0.06 0.13 0.1 0.06
Miscellaneous 1.51 1.18 1.29 0.11 0.09 0.09 0.22 0.23 0.23 0.57 0.31 0.34 0.11 0.08 0.08 0.18 0.12 0.11
482 J. Ranger et al.
whole litterfall did not represent any simple relevant ecologi-
cal parameter (see Fig. 3). As very often, the mean year was
rarely found and the average value mostly resulted from years
with high or low litterfall amounts. The inter-annual variability
tended to decrease when the size of the component increased
e.g. the maximum relative variation to the mean value was less
than 50%, for brown needles, which always represented more
than 55% of the total litterfall, it increased to more than 50%
for dead wood representing 10% of the litterfall, and was the
highest for small components (green needles, green wood,
bark, cones, flowers, etc.). The proportion of litterfall coming
from green needles and green wood represented 30% of the
whole litter in particular years. Usually, this green litter was
added to the “normal” litterfall, leading to years of exception-
ally high litter production. These data confirmed that ecologi-
cal studies need at least medium term observations, which also
means that a lot of data from the literature resulting from short
term observations are of limited interest.
Tab le V. Calculation of the dynamics of stand nutrient uptake (data expressed in kg·ha
–1
·yr
–1
).
Stand age N P K Ca Mg
20 years Immobilization
Litterfall
Crown leaching
Crown uptake
Uptake
Litterfall/Uptake %
23.1
56.5
12.6
92.2
61
1.8
3.8
0.6
6.2
61
29.5
8.4
28.8
66.7
13
8.6
35.2
0.7
44.5
79
2.6
3.9
1.4
7.9
49
40 years Immobilization
Litterfall
Crown leaching
Crown uptake
Uptake
Litterfall/Uptake %
9.6
33
4.3
46.9
70
0.8
2.2
0.7
3.7
59
9.4
6.8
12.7
28.9
24
4.9
22.3
3.6
30.8
72
0.9
2.4
1.2
4.5
53
60 years Immobilization
Litterfall
Crown leaching
Crown uptake
Uptake
Litterfall/Uptake %
4
31.9
0.2
36.1
88
0.3
2.2
0.8
3.3
67
1.8
7.3
10.2
19.3
38
2.6
21.5
0.9
25
86
0.3
2.3
0.8
3.4
68
Immobilization = calculated from biomass and nutrient tables according to Ranger et al. (1995).
Crown leaching & crown uptake: data from Ranger et al. (2002) [25].
Tab le VI. Cumulated litter returns for a 70-year rotation of Douglas-fir in the Beaujolais Mounts.
DM C N P K Ca Mg
Litterfall cumulated for a 70-year rotation (1)(2) 255 002 148 257 3195 202 570 2107 228
Mean annual litterfall for the rotation 3643 2118 46 3 8 30 3
Nutrients available in the soil profile
– Ol 7745 4503 88 5.6 9.9 53.3 4.3
Of + Oh 47 200 27 442 500.5 36.2 412.9 145.1 138.2
– total forest floor 54 945 31 945 588.5 41.8 422.8 198.4 142.5
– top soil with maximum roots (0.6 m) 280 360 455 79
– whole soil profile (1 m) 370 594 600 132
Apparent mean time residence (3) 15
(1) Calculated estimating linear increment of litterfall from 0 to value observed in the 20- to 26-year-old stand, then value for 26-year-old stand was
used from 15 to 30 years, value observed in the 40- to 46-year-old stand was used between 30 and 50 and finally values observed in the 60- to 66-year-
old stand was used for the period 50 to 70.
(2) Litterfall from the thinned trees was added (calculation were made from inventories made by the foresters).
(3) T= F(forest floor)/L(annual litterfall) calculated only for C due to mineral pollution.
Dynamics of litterfall in Douglas-fir 483
Below-ground litter production was not measured in the
present study due to extreme difficulties to do so properly.
Parameters controlling litterfall varied with each compo-
nent and it is necessary to study each of them individually to
characterize the whole litter production:
(i) Brown needles fell in autumn, mainly due to physiolog-
ical stress, even if mechanical stress was involved.
(ii) Brown wood, and secondarily cones, fell more errati-
cally and were more difficult to connect to physiological stress.
Due to bad self-pruning, dead branches can stay on trees for
years. Mechanical stress is necessary to break the most fragile
parts. This was probably the reason why no difference occurred
between litter traps, even for large components such as
branches which in fact most often fell into small pieces.
(iii) Some components were typically seasonal like buds
and flowers.
(iv) Green litter (needles and wood) typically depended on
mechanical stresses. In the oldest stand of this study, and prob-
ably due to its windy situation in the countryside, “green litter”
represented one third of the total litterfall as a mean. This
rather large amount of matter was able to modify both amounts
of carbon and nutrients, as they were considerably more con-
centrated in nutrients than dead material.
(v) The overall amount of litterfall was related to stand age
with the maximum amount at the maximum current annual
increment. Stand age also changed the relative distribution of
components: dead wood, flowers and fruits, green litter
increased with stand age.
Litterfall is an essential parameter for calculating stand
nutrient uptake, because it is not possible to measure it
directly. This has been shown from a compartment and flux
model [22, 23], in which nutrient uptake of “mature” stands is
defined as follows:
Uptake = immobilization + returns (litterfall and crown
leaching).
Results obtained in the chronosequence of stands are pre-
sented in Table V. Litterfall represented the major part of the
annual uptake of N, P, Ca and Mg (between 50 and 90%
according to nutrient and stand age). As a consequence, deple-
tion of the soil nutrient pool associated to tree nutrition was
quantitatively limited to stand immobilisation when forest
floor mineralisation did not limit the return of nutrients in an
available form for tree uptake. The situation for K was con-
trasted because this element is not usually associated with
organic compounds and thus may be quickly leached from the
tree crown by rain. Consistently, the amount of K uptake by
stands and originating from litterfall increased from 13 to 39%
from the 20- to the 60-year-old stand.
The contribution of litterfall to the stand nutrient uptake
increased with stand age as a result of three main factors:
(i) The amount of litterfall tended to decrease after the max-
imum current annual increment (MCI) and stabilized with
stand age;
(ii) Current stand immobilization strongly decreased with
stand age as the young stand was more or less at the MCI;
(iii) Internal translocation of nutrients increased with stand
age, tending to decrease the mean annual immobilization in
the ligneous compartments.
Return by litterfall is an important mechanism in the inter-
action between vegetation and soil: Table VI presents the data
for litterfall, cumulated for the whole rotation, or as mean
annual values for the rotation, and for comparison the soil
reserves in the forest floor, 60 upper cm and for 1 m depth.
Data confirmed the potential effect of litter returns on nutrient
availability for all nutrients. The tree root system takes up ele-
ments in the whole soil profile which are later re-deposited at
the soil surface [13]. Mineralisation prolongs to varying
extents the time required for elements to become available
again. Several authors proposed simple or more sophisticated
coefficients capable of estimating the mean residence time of
C and elements in the forest floor [14, 35]. These calculations
presupposed that the forest floor was in a steady state, but this
was not the main problem. They assumed that the nutrients
associated with the organic matter, but not with the whole
layer, were involved. However, even in the holorganic layers,
organic matter represents only a part of the mass, depending
on physical and biological parameters leading to a mixture of
nutrient-bearing organic and mineral compounds. In the
present study, mineral particles represented approximately
half of the layer mass. Eliminating all the OM and the associ-
ated nutrients using concentrated H
2
O
2
was not possible. In
these conditions, it was totally erroneous to calculate any res-
idence time for elements other than C. Even for C, this calcu-
lation was not perfect as C from fine roots colonising the
Table VII. Statistical relationships between stand biomass and
litterfall, between litterfall mass and its nutrient content, and
between nutrients of the litterfall, for various stands evaluated by the
linear correlation coefficient (all stands n = 21; plantations n = 11;
french stands n = 8).
Stands
concerned
Needle
litter/total
litterfall
Total crown
biomass / needle
litter
Total crown
biomass /total
litterfall
Crown needle
biomass /
needle litter
All stands 0.82 0 0.64 0.50
Plantations 0.79 0 0 0
French
stands
0.75 0 0 0
Stands
concerned
Total
litterfall /
N litterfall
Total litterfall /
P litterfall
Needle
litterfall/
N litterfall
Needle
litterfall/
P litterfall
All stands 0.55 0.74 0.82 0.63
Plantations 0.79 0.78 0.84 0.77
French
stands
0.88 0.88 0.92 0.88
Nutrients in total litterfall
Stands
concerned
N/P N/K N/Ca N/Mg Ca/Mg K/Ca P/K
All stands 0.3 0.42 0.2 0.39 0.74 0.68 0.73
Plantations 0.69 0.42 0.4 0.62 0.88 0.96 0.85
French
stands
0.99 0.92 0.98 0.97 0.92 0.95 0.91
r5% = 0.43 n = 20; r5% = 0.58 n =11; r5% = 0.66 n = 8; results in bold
are significant at the 5% level.
484 J. Ranger et al.
organic layers can represent a non negligible amount. Only
labelled material can really give the turnover of soil organic
matter [36].
Litterfall is a determining process limiting soil acidification:
Mineralisation releasing cations neutralises protons, while
mineralisation releasing anions produces protons [6]. For forest
vegetation, the balance is in favour of alkalinisation due to
excess cations in the living biomass [7]. Large amounts of cal-
cium and magnesium are released at the soil surface, counter-
acting the desaturation and the aluminisation of the soil
exchangeable pool. In acid soils with low amounts of Ca-bearing
minerals as in the present site [12], since no secondary Ca-minerals
are stable, released Ca is absorbed by vegetation or temporarily
fixed on the soil adsorbing complex. Ca is not competitive
against Al, and tended to be leached down the soil profile. The
Ca-H or Ca-Al exchange reactions in the upper soil layers are
an efficient buffer for soil acidity. The constant load of Ca, K
and Mg (respectively 8, 30, 3.3 and kg·ha
–1
·yr
–1
on average)
from mineralisation strongly limited topsoil desaturation.
Belowground litter was not considered here, even if it can
represent some 80% of the aboveground litterfall of Douglas-
fir, according to Vogt et al. [34]. This means that the total
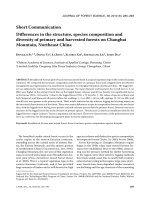
Figure 5. Relationships between litterfall biomass and its nutrient content (a), and between the different elements content in the biomass (b).
Dynamics of litterfall in Douglas-fir 485
Figure 5. Continued.
486 J. Ranger et al.
returns of dry matter and nutrients from vegetation is of para-
mount importance for soil function and more particularly for
the bioavailability of nutrients in soils.
Generalisation of relations using data from the literature:
Data were grouped according to ‘natural’ stands or planta-
tions. The general trends were as follows (Tab VII):
– There was a statistically significant relationship between
needle litter and total litter, indicating that needles represented
a constant part, indeed the main part, of litterfall in all sites (r =
0.82, n = 20).
– There was a lack of any satisfactory relationship between
stand canopy biomass and partial (needles only) or total (nee-
dles + wood) litterfall. The coefficients of correlation were not
significant in both individual groups (“natural” stands and
plantations), but became significant by considering the whole
data set. Nevertheless, the total variance could not be
explained satisfactorily. This was the case for the relationship
between total crown biomass and total litterfall mass (r = 0.64,
n = 20), and between crown needle biomass and needle litter-
fall (r = 0.40, n = 20). These significant trends for the whole
set of data were associated with the large variation of situa-
tions observed in the data set (from 9- to 450-year-old stands).
The relatively poor relationship between crown parameters
and litterfall could have various origins, such as (i) crown bio-
mass is a cumulative parameter, which could blur needle age
variation either according to stand age or to the site, or (ii) nee-
dle fall collected over relatively short periods may not give
any realistic value.
– The relationships between litterfall mass and nutrients
were generally significant. They indicated three main tendencies:
(i) The correlation coefficient was higher when needle fall
was considered instead of total litterfall. This seemed related
to the fact that brown needles represented the larger part of the
total litterfall, and the variations in concentrations of this com-
ponent were rather limited between sites.
(ii) Data fitting was improved when groups (natural stands
and plantations) were distinguished. This could be explained
by stand structure and genotypic properties, but the sample
size was too limited to use this character as an explanatory var-
iable such as stand age.
(iii) The fitting for statistical relationships between nutri-
ents was better when N was excluded. This disagreement
probably results from differences between methodologies
used in the studies. This is quite surprising for such a common
element. This is illustrated in Figure 5. For example, concern-
ing the relationship between N-content and dry matter, there
was a very good linearity for the “French” group, which
remained correct when North American plantations were
added, but which decreased when natural stands were associ-
ated (Fig. 5a). This became more obvious when the relation-
ships between litterfall N and individual nutrients were com-
pared to the relationships between nutrients other than N
(Fig. 5b).
5. CONCLUSIONS
The chronosequence of stands, observed over the medium
term, proved to be a useful tool to identify the trend of litterfall
during stand development, and to quantify the dynamics of
nutrient return to the forest floor. Accurate current and mean
values for the rotation were provided. This study confirms that
litterfall is an ecologically relevant parameter, supplying data
for numerous functions characterizing an ecosystem i.e. stand
nutrient uptake, soil carbon and nutrient supply from above-
ground vegetation.
This research failed to find statistically significant relation-
ships between stand characteristics and litterfall: litterfall
varied with stands but variation was not related to available
stand parameters from the literature, especially with stand
crown biomass. More satisfactory relationships were found
between litterfall and its nutrient content. Nevertheless, it
seemed necessary to distinguish between plantations and nat-
ural stands which probably behaved differently.
There is growing interest in an overall model of ecosystem
functioning, both for fundamental research and development
purposes. Unfortunately, basic data to validate these models
are insufficient. Only 20 case studies were found in the litera-
ture for identifying relationships between litterfall and stand
characteristics for Douglas-fir. In addition, it appeared that
measurements which were too short term in some cases, and
apparent analytical heterogeneities made data difficult to com-
pare. Harmonizing data is a prerequisite for providing general
models in the future: significant duration is required and meth-
odologies for chemical analysis need to be standardised.
Acknowledgements: We thank the forest managers from the “Office
National des Forêts” and, particularly, Bernard Jobard, for providing
all the necessary facilities during sampling, the GIP-Ecofor for
providing financial support. We thank Erwin Ulrich, manager of the
Renécofor network at ONF Fontainebleau, for providing unpublished
data concerning the Douglas-fir sites of the network, and Christine
Young for revising the English.
Dynamics of litterfall in Douglas-fir 487
Annex I. List and characteristics of the stand used.
Type Age
Yea rs of
observation
Stand
density
Stem
biomass
Aboveground
biomass
Total crown
biomass
Crown
needles
Litter
needles
Total
litterfall
N P K Ca Mg Author
Natural 450 734 802.3 68.3 14.12 6138 18.8 4.5 7.3 40.4 3.3 Grier et al., 1974
Plantation 28 5 129 166.2 37.2 14.1 2829 3049 35.3 2.2 6.2 20.9 2.9 Ulrich, 1995
Plantation 54 5 327.9 360 32.1 9.5 2516 3184 35.6 2.2 6.3 21.3 3.1 Ulrich, 1995
Plantation 36 5 165.3 194.5 29.2 9.7 1883 2104 24.1 1.5 4.2 14.3 2 Ulrich, 1995
Plantation 29 5 129.1 164.3 35.2 14.3 1600 1752 20.3 1.3 3.5 12.1 1.6 Ulrich, 1995
Plantation 26 5 127.5 159.1 31.6 12.8 1866 2025 23.7 1.5 4.1 14 1.9 Ulrich, 1995
Plantation 20 7 922 65.5 99.7 34.2 17.4 3286 3900 55.3 3.8 8.2 35 3.9 Ranger et al., 1975
Plantation 40 7 490 223.5 262.1 38.6 13.6 2082 3351 32.6 2.2 6.5 22.7 2.4 Ranger et al., 1975
Plantation 60 6 312 352 417.8 65.8 16.1 1795 3191 30.1 2 6.5 20.5 2.2 Ranger et al., 1975
Natural 9 2022 7.81 10.67 2.86 1.04 344 366 2.5 0.3 1.4 3.4 0.3 Turner and Long, 1975
Natural 22 1 2756 113.34 126.5 13.16 5 2518 2670 18.8 3.2 9.7 22.9 4.4 Turner and Long, 1975
Natural 30 1 1800 145.9 162.59 16.69 6.54 2000 2500 18.5 4.1 6.1 31.7 3.7 Turner and Long, 1975
Natural 42 1 822 177.05 196.58 19.53 8.27 1796 2573 21.1 2.3 6.6 30.7 6.3 Turner and Long, 1975
Plantation 42 1 1289 206.24 229.4 23.16 9.44 2403 3123 21.1 2.6 8.9 35.7 3.7 Turner and Long, 1975
Plantation 49 1 1067 201.19 224.55 23.36 9.39 1780 2280 17.8 2.6 6.6 27.6 2.3 Turner and Long, 1975
Natural 73 1 1889 267.33 293.52 26.19 10.75 1891 3725 17.1 2.3 6.1 34.5 4.3 Turner and Long, 1975
Natural 95 1 644 319.34 347.51 28.17 12.88 1119 2195 18.3 2.6 5.2 38.1 3.2 Turner and Long, 1975
488 J. Ranger et al.
REFERENCES
[1] AFES, Référentiel pédologique. Principaux sols d’Europe, INRA
Ed., 1997, 222 p.
[2] Augusto L., Ranger J., Binkley D., Rothe A., Impact of several
common tree species of European temperate forests on soil fertility,
Ann. For. Sci. 59 (2002) 233–253.
[3] Aussenac G., Production de litière dans quatre jeunes peuplements
de Douglas dans l’Est de la France, Rev. For. Fr. XXXI-1 (1979)
15–19.
[4] Badeau V., Dambrine E., Walter C., Propriétés des sols forestiers
français : Résultats du premier inventaire systématique, Etud. Gest.
Sols 6 (1999) 165–180.
[5] Bray J.R., Gorham E., Litter production in forests of the world,
Adv. Ecol. Res. 2 (1964) 101–158.
[6] Breemen van N., Driscoll C.T., Mulder J., Acidic deposition and
internal proton sources in acidification of soils and waters, Nature
307 (1984) 599–604.
[7] Bonneau M., Dambrine E., Nys C., Ranger J., L’acidification des
sols, Bull. Ecol. 18 (1987) 127–136.
[8] Cole D.W., Rapp M., Elemental cycling in forest ecosystems, in:
Reichle D.E. (Ed.), Dynamic properties of forest ecosystems,
IBP 23, Cambridge University Press, London, 1981, pp. 341–409.
[9] Decourt N., Le Douglas dans le Nord-Est du Massif Central, Ann.
Sci. For. 24 (1967) 45–84.
[10] Duchaufour P., Précis de pédologie, Masson ed., Paris, 1973.
[11] Duchaufour P., Bonneau M., Une nouvelle méthode de dosage du
phosphore assimilable dans les sols forestiers, Bull. AFES 4 (1959)
193–198.
[12] Ezzaïm A., Turpault M P., Ranger J., Quantification of weathering
processes in an acid brown soil developed from tuff (Beaujolais,
France), Part II. Soil formation, Geoderma 87 (1999) 155–177.
[13] Fisher R.F., Amelioration of soils by trees, in: Gessel S.P., Lacate
D.S., Weetman G.F., Powers R.F. (Eds.), ‘Sustained productivity of
forest soils’, Proceedings of the 7th North American forest soils
conference, University of British Columbia, Faculty of Forestry,
Vancouver, BC, 1990, pp. 290–300.
[14] Jenny H., Gessel S.P., Bingham F.T., Comparative study of
decomposition rates of organic matter in temperate and tropical
regions, Soil Sci. 2 (1949) 419–432.
[15] Gessel S.P., Turner J., Litter production in western Washington
Douglas-fir stands, Forestry 49 (1976) 63–72.
[16] Grier C.C., Cole D.W., Dyrness C.T., Fredericksen R.L., Nutrient
cycling in 37- and 450-year old Douglas-fir ecosystems, in:
Integrated research in the coniferous forest biome, Coniferous
Forest Biome Bulletin, No. 5, University of Washington, Seattle,
WA, 1974, pp. 21–34.
[17] Kestemont P., Biomasse et productivité primaire de la Douglasaie
à Mirwart. Plantation de Pseutotsuga menziesii, in: Duvigneaud P.,
Kestemont P. (Eds.), Productivité biologique en Belgique, SCOPE,
travaux de la section Belge du PBI, 1977, pp. 177–189.
[18] Mac Bride M.B., Bloom P.R., Adsorption of aluminum by a
smectite: II An Al
3+
–Ca
2+
exchange model, Soil Sci. Soc. Am. J.
41 (1977) 1073–1077.
[19] Marques R., Ranger J., Villette S., Granier A., Nutrient dynamics
in a chronosequence of Douglas-fir (Pseudotsuga menziesii (Mirb.)
Franco) stands on the Beaujolais Mounts (France). 2. Quantitative
approach, For. Ecol. Manage. 92 (1997) 167–197.
[20] Mehra O.P., Jackson M.L., Iron oxide removal from soils and clays
by a dithionite-citrate system with sodium bicarbonate, Clays and
Clay minerals 7th Conf., Pergamon Press N.Y., 1960, pp. 317–327.
[21] O’Neill R.V., De Angelis D.L., Comparative productivity and
biomass relations of forest ecosystems, in: Reichle D.E. (Ed.),
Dynamic properties of forest ecosystems, IBP 23, Cambridge
University Press, London, 1981, pp. 411–449.
[22] Ranger J., Bonneau M., Effets prévisibles de l’intensification de la
production et des récoltes sur la fertilité des sols de forêt. Le cycle
biologique en forêt, Rev. For. Fr. XXXVI (1984) 93–112.
[23] Ranger J., Turpault M.P., Input-output nutrient budgets as a
diagnostic tool for sustainable forest management, For. Ecol.
Manage. 122 (1999) 139–154.
[24] Ranger J., Marques R., Colin-Belgrand M., Flammang N., Gelhaye
D., The dynamics of biomass and nutrient accumulation in a
Douglas-fir (Pseudotsuga menziesii Franco) stand studied using a
chronosequence approach, For. Ecol. Manage. 72 (1995) 167–183.
[25] Ranger J., Allie S., Gelhaye D., Pollier B., Turpault M.P., Granier
A., Nutrient budgets for a rotation of a Douglas-fir plantation in the
Beaujolais (France) based on a chronosequence study, For. Ecol.
Manage. 171 (2002) 3–16.
[26] Remezov N.P., A procedure for studying the biological cycle of
elements in forests. Pochvovedenie, 1 in: Rodin and Bazilevitch,
(1967) 1959.
[27] Rodin L.E., Bazilevitch N.I., Production and mineral cycling in
terrestrial vegetation, English translation by G.E. Fogg, Oliver and
Boyd (Eds.), Edinburgh and London, 1967, 288 p.
[28] Switzer G.L., Nelson L.E, Smith W.H., The mineral cycling in
forest stands, in: Tenessee Valley Authority, Forest Fertilisation,
Miss. Agr. Exp. Station, 1535 (1968) 1–9.
[29] Tamm O., Um best ämning ow de oorganiska komponenterna i
markens gelcomplex, Medd. Statens Skogsförsökanst. 19 (1922)
385–404.
[30] Turner J., Nutrient cycling in an age sequence of western
Washington Douglas-fir stands, Ann. Bot. 48 (1981) 159–169.
[31] Turner J., Long J.N., Accumulation of organic matter in a series of
Douglas-fir stands, Can. J. For. Res. 5 (1975) 681–690.
[32] Ulrich E., Le réseau Renécofor : objectifs et réalisation, Rev. For.
Fra. XLVII (1995) 107–124.
[33] USDA, Soil Conservation Service, Soil Survey Staff, Soil
Taxonomy US Governement printing office, Washington DC,
1975, 754 p.
[34] Vogt K.A., Grier C.C., Vogt D.J., Production, turnover, and
nutrient dynamics of above- and belowground detritus of world
forests, in: McFayden A., Ford E.D. (Eds.), Advances in Ecological
Research, Academic press, Harcourt Brace Jovanovich, Publ.
London, 15 (1986) 303–377.
[35] Vogt K.A., Grier C.C., Meier C.E., Keyes M.R., Organic matter
and nutrient dynamics in forest floors of young and mature Abies
amabilis stands in western Washington, as affected by fine root
input, Ecol. Monog. 53 (1983) 139–157.
[36] Zeller B., Contribution à l’étude de la décomposition d’une litière
de hêtre, la libération de l’azote, sa minéralisation et son
prélèvement par le hêtre (Fagus sylvatica L.) dans une hêtraie de
montagne du bassin versant du Strengbach (Haut-Rhin), Thèse de
doctorat, Université Henri Poincaré, Nancy I en sciences de la terre,
1998, 138 p. + annexes.