Báo cáo lâm nghiệp:" The key-role of topsoil moisture on CO2 efflux from a Mediterranean Quercus ilex forest" docx
Bạn đang xem bản rút gọn của tài liệu. Xem và tải ngay bản đầy đủ của tài liệu tại đây (292.51 KB, 8 trang )
519
Ann. For. Sci. 60 (2003) 519–526
© INRA, EDP Sciences, 2003
DOI: 10.1051/forest:2003045
Original article
The key-role of topsoil moisture on CO
2
efflux from a Mediterranean
Quercus ilex forest
Richard JOFFRE
a
*, Jean-Marc OURCIVAL
a
, Serge RAMBAL
a
, Alain ROCHETEAU
a,b
a
Équipe DREAM, CEFE-CNRS, 1919 Route de Mende, 34293 Montpellier Cedex 5, France
b
UR CLIFA, IRD-CNRS, 1919 Route de Mende, 34293 Montpellier Cedex 5, France
(Received 7 October 2002; accepted 1 June 2003)
Abstract – CO
2
respiratory losses partly determine net carbon ecosystem exchanges. The main objective of this paper was to understand
regulation imposed by soil water content and temperature on soil and ecosystem CO
2
efflux in a holm oak (Quercus ilex L.) Mediterranean
forest. Soil CO
2
efflux was monitored monthly during 1999 and 2001. Moreover, experimental water treatments were conducted in 1999 over
9 small plots (0.3 m
2
) during nine months. Results showed strong decreases of soil CO
2
efflux for a relative soil water content below 0.7.
Ecosystem respiration measured by eddy covariance over a 4-year period showed strong sensitivity to soil water content and temperature.
Severe limitations of soil and ecosystem efflux imposed by low values of soil water content occurred on about 90 days per year. The best
adjustments of soil and ecosystem CO
2
efflux were obtained using regression models where the exponential effect of temperature is linearly
related to soil water content (r
2
= 0.68 and 0.79 for soil and ecosystem respectively). Our results highlighted strong differences in respiration
sensitivity to topsoil moisture between soil and ecosystem. When the relative water content (RWC) is low (0.4), an increase of 1 °C provokes
an increase of soil respiration of 5.7% and an increase of ecosystem respiration of 8.6%. For nonlimiting soil water conditions, at RWC = 1, the
increases of respiration caused by a 1 °C temperature increase are of 8.5% and 16.5% for soil and ecosystem respectively. These results
emphasized the probable determinant influences of changes in soil water regime for respiratory fluxes and net carbon exchanges of
Mediterranean forest ecosystems.
CO
2
efflux / soil water content / soil temperature / ecosystem respiration / Mediterranean ecosystem / Quercus ilex
Résumé – Le rôle-clé de l’humidité du sol superficiel sur les efflux de CO
2
d’une forêt méditerranéenne de chêne vert. Les pertes de CO
2
par respiration vont déterminer largement les échanges nets de carbone des écosystèmes. L’objectif principal de cet article est de comprendre
les régulations imposées par la teneur en eau et la température du sol sur les efflux de CO
2
du sol et de l’écosystème dans une forêt
méditerranéenne de chêne vert (Quercus ilex L.). La respiration du sol a été mesurée mensuellement en 1999 et 2001. Par ailleurs, une
expérimentation, mise en place en 1999, comprenant trois régimes hydriques a été suivie pendant 9 mois sur 9 parcelles de 0.3 m
2
. Les résultats
mettent en évidence la très forte limitation des efflux lorsque la teneur en eau du sol est inférieure à 70 % de sa capacité de rétention. La
respiration de l’écosystème mesurée sur une période de 4 ans par la méthode des fluctuations turbulentes montre la même sensibilité aux deux
facteurs. Les conditions de fortes limitations par une faible teneur en eau du sol affectent l’écosystème environ 90 jours par an. Les meilleurs
ajustements pour la simulation des flux de CO
2
du sol et de l’écosystème sont obtenus pour un modèle dans lequel l’effet exponentiel de la
température est fonction linéaire de la teneur en eau du sol (r
2
de 0.68 et 0.79 pour le sol et l’écosystème). La sensibilité de la respiration à la
teneur en eau du sol est plus grande pour le sol que l’écosystème. En conditions hydriques sèches, pour une capacité relative en eau (RWC)
égale à 0.4, une augmentation de température de 1 °C entraîne une augmentation de la respiration du sol et de celle de l’écosystème de 5.7 %
et de 8.6 % respectivement. En conditions non limitantes (RWC = 1), le même accroissement de température provoque une augmentation de
respiration de 8.5 % et 16.5 % pour le sol et l’écosysteme respectivement. Toute modification des conditions hydriques aura donc des
répercussions sur les flux respiratoires et sur les échanges nets de carbone des écosystèmes forestiers méditerranéens.
flux de CO
2
/ humidité du sol / température du sol / respiration de l’écosystème / ecosystème méditerranéen / Quercus ilex
1. INTRODUCTION
The efflux of CO
2
from the soil, also referred to as soil res-
piration, is a major component of the global carbon balance
[33, 44]. Its importance is equal or greater than the estimated
terrestrial net primary production [3, 34]. It represents the main
source of all carbon dioxide entering the atmosphere with a
contribution being 20 to 40% of the total flux [22]. The rate at
which CO
2
is produced in the soil is largely controlled by soil
temperature and water content (e.g. [45]). Global temperature
increase could lead to opposite effects on carbon storage: first,
an increase of the net primary productivity and the input of
organic carbon in the soils, and second, a stimulation of
organic matter decomposition increasing the loss of soil
* Corresponding author:
520 R. Joffre et al.
organic carbon which in turns lead to an increase of atmos-
pheric CO
2
with probable influence on air temperature by
feedback effect [19]. Soil moisture constitutes the second fac-
tor regulating the soil CO
2
efflux, by limiting the respiration
when dry conditions occur [17]. Nevertheless, interactions
between soil temperature and soil moisture are non linear. A
change in soil moisture has a greater impact when the temper-
atures are higher while a change in temperatures has a greater
impact when the soil is humid [18].
Various models have been proposed to describe soil respi-
ration. They are generally based on temperature-dependent
relations [21, 23, 25, 42], combined with soil moisture [9, 11,
13, 16]. Most of the models that take into account temperature
and soil moisture at the same time, assumed that the effects are
multiplicative whereas some of them let vary the effect of tem-
perature with soil moisture [9, 37]. The seasonality of Medi-
terranean climates characterised by strong variations of soil
temperature and soil moisture offers a unique opportunity to
study the temporal changes in CO
2
efflux in response to soil
water availability and temperature.
Several data are available on the respiration of Mediterra-
nean ecosystems. Most of them were measured in the Mediter-
ranean Basin [4, 5, 10, 15, 26, 32, 37, 38]. Some other data
dealing with Australian ecosystems under Mediterranean cli-
mate are also available [12, 29]. They all highlight the effect
of the summer drought on soil respiration and some of them
also show the negative effect of the cold temperature in winter
on respiration. Two types of measurements were involved in
the present study. First, hourly ecosystem respiration was
measured using the eddy covariance technique [1, 2] over
extensive period of several months in order to cover a large
array of soil moisture and temperature conditions. Second, soil
respiration measurements were conducted over a large array of
temperature and soil moisture obtained through the design of
an original experiment combining three contrasted treatments
(control, dry and wet). Our main objective was to describe the
effects of soil moisture and temperature on soil and ecosystem
respiration considering both net ecosystem CO
2
exchange
using eddy covariance and soil CO
2
efflux measured with a
soil respiration chamber. Further, we tested the effects of soil
moisture on temperature sensitivity for both soil respiration
and ecosystem respiration.
2. MATERIALS AND METHODS
2.1. Study site
The study site is located 35 km NW of Montpellier (southern
France) in the Puéchabon State Forest (3° 35’ 45” E, 43° 44’ 29” N,
elevation 270 m). This forest has been managed as a coppice for cen-
turies and the last clear cut was performed in 1942. Vegetation is
largely dominated by the overstorey tree Quercus ilex L. whose cover
is larger than 80% and has a leaf area index of 2.96 [20]. Mean tree
height was about 5.5 m. In 2001, the density of resprouted stems was
7149 stems per ha. The percentages of stem with DBH < 4 cm and
DBH > 7 cm were 12% and 46% respectively. The above-ground
biomass was about 11 300 ± 2800 g dry matter (DM) m
–2
. Understo-
rey species compose a sparse (percent cover lower than 25) shrubby
< 2 m layer with Buxus sempervirens L., Phyllirea latifolia L., Pista-
cia terebinthus L. and Juniperus oxycedrus L. The mean annual lit-
terfall was 428 ± 30 g DM m
–2
(leaf = 254 ± 58 g DM m
–2
) and the
current annual growth increment was 185 g DM m
–2
. Consequently
the aboveground net productivity (ANPP) is about 613 g DM m
–2
[36].
The area has a Mediterranean-type climate. Rainfall occurs during
autumn and winter with about 75% between September and April.
Mean annual precipitation over the previous 18 years is 883 mm with
a range of 550–1549 mm. Mean annual temperature over the same
period is 13.5 °C. This forest grows on hard Jurassic limestone. The
soil is classified as calcareous fersiallitic soil (or rhodo-chromic luvi-
sol according to the FAO classification) with high clay (39.6%) and
low sand content (14.1%) in the 0–50 cm layer [26]. The averaged
volumetric fractional content of stones and rocks is about 0.75 for the
top 0–50 cm and 0.90 for the whole profile leading to a maximum
available water of 150 mm cumulated over 4.5 m depth (Rambal
unpublished data).
2.2. Experimental design of the instantaneous soil CO
2
efflux measurements
Nine randomly distributed permanent plots were delimited within
a 30 × 30 m area in December 1998. At each plot, metal frames (55 ×
55 cm) were inserted into the soil at 5 cm depth to avoid water infil-
tration through surface runoff. Three plots corresponding to the dry
treatment (D) were protected from the rain using a PVC roof installed
20 cm above the forest floor. Three other plots were not covered and
corresponded to the control treatment (C) submitted to the current
rainfall regime. The last 3 plots corresponding to the wet treatment
(W) were irrigated and maintained near to field capacity. Twice a
week, the litter fallen on the PVC roof of the D- and W-plots was
replaced inside the plot on the soil surface. In situ soil CO
2
efflux
R
soil
was measured using a dynamic-closed system based on an infra-
red gas analyzer (ADC LCA2, Analytical Development Company,
UK). Air was pumped (60 cm
3
min
–1
)
from the sample chamber (vol-
ume 300 cm
3
, area 33 cm
2
) to the IRGA detector and then back into
the chamber in a closed loop. The change in CO
2
concentration over
time yields an estimate of soil respiration. The system was allowed to
equilibrate with ambient air before measurements. The chamber was
placed on the soil and held firmly. A first reading was taken after 30 s
to let the CO
2
value stabilize. After 60 s a second reading was taken,
the CO
2
efflux being calculated as the difference between the two
measurements. Measurements were done between January and October
1999, 10 times for the dry and wet treatments and 16 times for the
control treatment. Three measurements were performed in each per-
manent plot and averaged. In order to normalise our measurements
with those conducted with the LiCor dynamic closed system (Cham-
ber Li6400-09 coupled with the LiCor 6400 IRGA), an intercalibra-
tion between both systems was conducted in June 2000 giving us the
following corrective equation Rs
Licor
= 0.4735*Rs
ADC
– 0.12 (r
2
= 0.87,
n = 85). All the data measured with the ADC were consequently cor-
rected using this equation. Additional measurements of 4 control
plots were monthly done during the year 2001 using the LiCor
dynamic closed system. A two-way Anova, testing the effects of
treatment and plot, was performed for each date of measurements.
2.3. Soil temperature and soil moisture
In each plot, soil temperature at 15-cm soil depth was measured
every 5 min using a copper–constantan thermocouple (Type T). Data
were recorded with a data-logger (Model 21X, Campbell Scientific
Ltd.) and processed to calculate average hourly values. Soil moisture
was measured with TDR (Trase USA, Model 6050X1) with two pairs
of 15-cm probes in each plot. Measurements were done once a week.
For the D and W treatment soil moisture was interpolated between
two successive measurements. To have a continuous set of soil water
Topsoil moisture and CO
2
efflux 521
content for the C treatment, rather than interpolating the discrete TDR
values, we used a daily soil water balance model. We assumed the
topsoil water to be only influenced by infiltrated rainfall and soil
evaporation. Soil evaporation was calculated in two stages: (1) the
constant rate stage, when the supply of energy to the surface limits
evaporation, and (2) the falling rate stage when water movement to
the evaporating surface is controlled by the soil hydraulic properties.
Details for calculating soil evaporation are given by Ritchie [39]. In
stage 1, the soil was sufficiently wet for water to be transported to the
surface at a rate equal to the rate of potential soil evaporation. During
stage 2, according to diffusion theory, cumulative evaporation (in this
stage) is proportional to the square root of the elapsed time after the
beginning of this stage. Soil evaporation parameters were 10 mm for
the upper limit of first stage evaporation and 4.5 mm d
–1/2
for the sec-
ond stage coefficient. These parameters were the same as those used
by Rambal [35] for a similar soil.
2.4. Eddy covariance measurements of ecosystem CO
2
efflux
A 11 m height tower with a 2 m mast was installed in the middle
of the stand in June 1998. Wind speed components were measured
with an Ultrasonic 3D anemometer (Solent R2, Gill Instruments,
Lymington, UK) installed on the top of the mast, i.e. 7 m above the
tree canopy. Air was sampled at the base of the sonic anemometer
through a 0.2 µm filter (PTFE Acro 50, Gelman) and pumped at a
flow rate of 1.5 10
–4
m
3
s
–1
. Water vapour and carbon dioxide con-
centration were measured with a LI-6262 IRGA analyser (Li-Cor,
Lincoln, NE, USA) placed on the tower, 2 m below the sonic ane-
mometer. Wind speed and gas concentrations were scanned at a fre-
quency of 21 Hz. The IRGA analyser was recalibrated every 3 weeks
for CO
2
and every 7 weeks for H
2
O. The flow rate of N
2
in the refer-
ence cell was 3.3 10
–7
m
3
s
–1
. CO
2
fluxes were computed using
Edisol software [27] and following the corrections described in [1].
Ecosystem respiration could be estimated by night-time eddy cov-
ariance fluxes under some specific conditions of turbulence to elimi-
nate stable night-time conditions leading to CO
2
storage in the layer
below the eddy flux system. To avoid underestimation due to CO
2
storage, we plotted night-time fluxes against friction velocity u* [1]
and determined the value of u* beyond which CO
2
fluxes did not
depend of u*. Above this threshold, 0.35 m s
–1
in our site, storage
may be considered as negligible and CO
2
flux equals ecosystem res-
piration. The threshold determined at Puéchabon was close to the val-
ues determined at many Euroflux sites [1]. Moreover, we selected
nights where at least 6 consecutive half-hour periods presented u*
values equal or higher than 0.35 m s
–1
. To avoid interference with
growth respiration, we analysed data collected out of the vegetation
growth period (from March to June). Over the period of study (July
1998 to November 1999 and July 2000 to December 2001), 302
nights satisfied these conditions and were consequently considered
for ecosystem respiration estimation.
2.5. Data treatment
Soil respiration (R
s
) and ecosystem respiration (R
eco
) were mod-
elled using three classes of models. The first one involves only soil
temperature using an exponential function (model ‘Temp’)
R
s
= R
s,ref
. e
b(T – Tref)/10
(1a)
R
eco
= R
eco,ref
. e
b(T – Tref)/10
(1b)
with T = soil temperature at 15-cm depth, R
s,ref
and R
eco,ref
being
the respiration under standard conditions (at Tref).
In the second type of model, respiration is modelled considering a
multiplicative dependency on soil temperature and soil moisture
(model ‘Multi’):
R
s
= R
s,ref
. f(
θ
) . e
b(T – Tref)/10
(2a)
R
eco
= R
eco,ref
. f(
θ
) . e
b(T – Tref)/10
(2b)
with T = soil temperature at 15-cm depth, R
s,ref
and R
eco,ref
being the
respiration under standard conditions (at Tref and nonlimiting soil
moisture). f(θ) was expressed in two different ways:
as percent of soil water content at field capacity (RWC) (Eq. (3))
(3)
with θ current soil water content and θ
fc
soil water content at field
capacity, that is θ measured after a large rain event and two draining
days;
or as soil matrix potential through a Campbell-type equation (Eq. (4))
[7, 8] for representing the soil moisture characteristic or retention
curve linking potential and soil water content
(4)
with ψ
fc
potential at field capacity, i.e. at a pressure value of –33 kPa.
The exponent b was calculated from the pedotranfer function pro-
posed by [43].
In the third model, the rate constant of temperature is a linear func-
tion of soil moisture (model ‘Expo’):
R
s
= R
s,ref
. f(θ) . e
((b f(θ) + c)(T – Tref)/10)
(5a)
R
eco
= R
eco,ref
. f(θ) . e
((b f(θ) + c)(T – Tref)/10)
(5b)
with T, R
s,ref
, R
eco,ref
and f(θ) as in equations (2a) and (2b).
Tref was fixed in all models at 0 °C.
To take into account a possible delay between the rapid modifica-
tion of soil moisture after rainfall and the induced flush of microbial
respiration, moisture contents over different periods of time were cal-
culated and tested. Five adjustments corresponding to soil moisture
measured on the day of measurement (RWC
1
), or mean values calcu-
lated over 2 (RWC
12
), 3 (RWC
13
), 4 (RWC
14
), and 5 (RWC
15
) days
before this day were performed. For the ecosystem respiration meas-
urements, the soil temperature corresponded to the average of night-
time soil temperature. Parameters were estimated using a non-linear
regression procedure (NLIN) of SAS software. Fits of the different
models were evaluated by calculating the adjusted coefficient of
determination and the root mean squared error (RMSE). For each
model, we selected the best two combinations of variables for the
expression of soil moisture.
3. RESULTS
3.1. Soil RWC and soil temperature
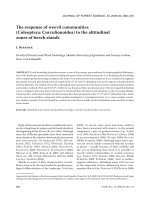
During the 1999 experiment, soil RWC ranged from 0.46
and 0.51 for the D treatment and from 0.76 and 0.93 for the W
treatment. Fluctuations of RWC were larger for the C ranging
during the experiment from 0.45 to 0.94 (Fig. 1b). Water
manipulation in the experimental plots allowed measurements
of soil CO
2
efflux in dry and cold conditions in winter.
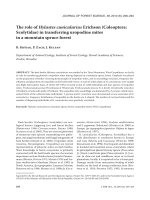
Time-course of topsoil RWC over the four years of moni-
toring showed important seasonal variations whose general
pattern is characteristic of the Mediterranean climate (Fig. 2).
f
θ() RWC
θ
θ
fc
==
f θ() ψ
fc
RWC
b
=
522 R. Joffre et al.
Strong interannual variability affected autumnal recharge. As
a consequence, winter field capacity could be reached early, as
in 1999 and 2000, or very late as in 2001 and 1998. Winter
drought could be marked as in 1999 and 2000 with RWC
reaching low values around 0.5. Strong daily rainfall events
during summer (as in 1999) could modify substantially the
length of summer drought.
Mean daily soil temperatures ranged from 3.9 °C to 20.5 °C
during the water manipulation experiment and were not signif-
icantly different between the 3 treatments. The PVC roofs
installed over the dry plots to avoid the infiltration of rainfall
provoked a maximum difference of daily soil temperature of
0.2 °C as compared to control. Ecosystem respiration was
measured over a quite similar range of temperatures from
2.79 °C to 23.1 °C.
3.2. Soil CO
2
efflux during the field experiment
Mean values of soil CO
2
efflux ranged from 0.47 to
5.59 µmol m
–2
s
–1
for C, from 0.31 to 2.34 µmol m
–2
s
–1
for
the D treatment and from 0.58 to the 10.16 µmol m
–2
s
–1
for
the W treatment (Fig. 1a). Over the experiment, the soil CO
2
efflux increased by a factor 18 for the W, 12 for the C and 7
for the D treatment when soil temperature varied by a factor 5
from 3.9 to 20.5 °C. All treatments experienced low values
when soil temperature was less than 7 °C (mean ratio of CO
2
efflux between D and C plots was 0.86 for the February val-
ues). Differences increased with soil temperature over spring
and summer and were the highest when soil temperature
exceeded 17 °C (mean ratio of CO
2
efflux between D and C
plots = 0.40 for the last 4 dates). During the low temperature
period (from February to mid-March), the efflux were not sig-
nificantly different between treatments. From the end of
March (26/03) till the end of the experiment, the treatment
effect was highly significant (P < 0.001). The plot effect was
only significant in July 1999 due to the high heterogeneity of
data in the C plots. The interaction treatment × plot was never
significant.
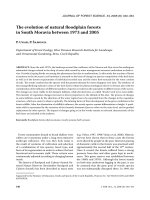
3.3. Ecosystem respiration
Ecosystem respiration ranged from low values close to
1 µmol m
–2
s
–1
recorded in dry summer (1998, 2001) and win-
ter when strong limitations were imposed by low soil moisture
or low temperature, to high values between 6 and 8 µmol m
–2
s
–1
recorded in the wet summer 1999 and in autumn following
important rainfall events and when soil temperature was still
high (around 17–19 °C) (Fig. 3). It is noteworthy that the first
important rainfall (20 mm) in autumn 1998 after the summer
drought provoked a 4.5-fold increase in ecosystem respiration
between 27 September 1998 (1.16 µmol m
–2
s
–1
) and 4 Octo-
ber 1998 (5.37 µmol m
–2
s
–1
). The same pattern of a strong
flush was frequently observed during summer 1999 and in
autumn 2000 and 2001.
3.4. Model comparison
Independent fit on the three soil treatments respiration val-
ues were done in order to compare the adjusted parameters
Figure 1. Time course of meteorological conditions and observed
soil CO
2
efflux during the 1999 experiment. (a) Daily soil
temperature (0–15 cm depth) and soil CO
2
efflux, open squares
correspond to the dry treatment, open circles to the control and closed
squares to the wet treatment (vertical bars indicate standard error of
the mean). (b) Daily rainfall and upper layer (0–15 cm depth) soil
relative water content (RWC), solid line corresponds to control,
dashed line to wet treatment, dot-dashed line to dry treatment.
Figure 2. Daily rainfall, modelled (full line) and observed (data
points) upper layer (0–15 cm depth) relative soil water content
(RWC) during the 1998–2001 period. Vertical bars indicate ± 1 SE.
Topsoil moisture and CO
2
efflux 523
between treatments. Due to the small numbers of degree of
freedom for the D and W treatments (n = 10), and whichever
the model under consideration, parameters were adjusted with
very large confidence limits. Consequently, the parameters
comparison was irrelevant. Pooling soil respiration data from
the 3 treatments (n = 93) or determining model parameters
only on the 1999 C treatment plus the monthly values obtained
in 2001 (n = 73) did not significantly change the parameters
but increased the RMSE of the models. Tables I and II showed
respectively the parameters of the different models on the
whole dataset of soil respiration and on ecosystem respiration.
For both measurements, soil CO
2
efflux and ecosystem res-
piration, the goodness of model fit decreased in the order
‘Temp’ model < ‘Multi’ model < ‘Expo’ model (Tabs. I and II).
In all cases, model estimates were better for ecosystem respi-
ration than for soil efflux. The model ‘Temp’ explained only
6% of the variance of the soil efflux and 23% for the ecosys-
tem respiration. Introducing soil moisture in the two other
model allows us to better describe the measurements (r
2
rang-
ing from 0.50 to 0.68 for soil efflux and from 0.66 to 0.79 for
ecosystem respiration). The ‘Expo’ model gave the best fits
whichever variable considered to describe soil moisture and
RWC gave better results that soil matrix potential. There were
only slight differences between the adjustments, calculated by
using moisture values of the day of measurement or by using
mean values over 2, 3, 4 and 5 days before the measurement
day. Nevertheless, whatever the model considered, the best
results corresponded to those calculated with the moisture
value of the measurement day.
As the ‘Expo’ model gave the best fits, we assessed the tem-
perature sensitivity for respiration taking the partial tempera-
ture derivative of equation 5 that is:
(6)
leading to
.(7)
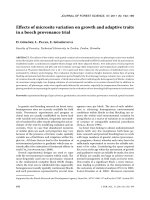
The temperature sensitivity of respiration g(θ) is a linear
function of soil water (Fig. 4). Using the parameter estimates
(Tab. I), it was therefore possible to compare the responsiv-
ness of soil and ecosystem respiration to temperature at differ-
ent soil water conditions. The slope of the g(θ) function, b, was
1.417 and 0.467 for soil and ecosystem respectively. At low
RWC (0.4), an increase of 1 °C provokes an increase of soil
respiration of 5.7% and an increase of ecosystem respiration of
8.6%. For nonlimiting soil water conditions, at RWC = 1, the
increases of respiration caused by a 1 °C temperature increase
are of 8.5% and 16.5% for soil and ecosystem respectively.
Table I . Parameter estimates and regression results of soil CO
2
efflux versus soil temperature and soil relative water content (RWC)
using equations (1–3) (see text) (n = 93). RWC
1
corresponds to the
value on the day of respiration measurement, RWC
15
corresponds to
the mean values calculated over 5 days before the day of respiration
measurement. R
s,ref
is the soil respiration under standard conditions
(at T
ref
), RMSE root mean squared error.
Model
Soil moisture
variable
R
s,ref
bc
r
2
RMSE
Temp (Eq. (1)) – 1.875 0.359 0.06 2.14
Multi (Eq. (2)) RWC
1
1.454 0.759 0.53 1.66
Multi (Eq. (2)) RWC
15
1.613 0.685 0.50 1.71
Expo (Eq. (3)) RWC
1
0.551 1.417 0.241 0.68 1.25
Expo (Eq. (3)) RWC
15
0.761 1.5058 –0.046 0.65 1.31
Figure 3. Time course of soil temperature (dashed line), simulated
ecosystem respiration (full line) modelled using ‘Expo’ model with
RWC
1
and daily measured eddy covariance ecosystem respiration
(open circles) during the 1998–2001 period.
Table I I . Parameter estimates and regression results of ecosystem
CO
2
efflux versus soil temperature and soil water content using
equation (1–3) (see text) (n = 302). RWC
1
corresponds to the value
on the day of respiration measurement, RWC
15
corresponds to the
mean values calculated over 5 days before the day of respiration
measurement. R
eco,ref
is the soil respiration under standard
conditions (at T
ref
), RMSE root mean squared error.
Model
Soil moisture
variable
R
eco,ref
bc
r
2
RMSE
Temp (Eq. (1)) – 1.635 0.364 0.23 1.04
Multi (Eq. (2)) RWC
1
1.282 0.683 0.72 0.66
Multi (Eq. (2)) RWC
15
1.292 0.678 0.66 0.72
Expo (Eq. (3)) RWC
1
1.0625 0.467 0.383 0.79 0.54
Expo (Eq. (3)) RWC
15
1.055 0.529 0.367 0.73 0.62
∂R
∂T
1
10
bf θ() c+()R=
∂R
R
1
10
bf θ() c+()∂Tgθ()∂T==
524 R. Joffre et al.
4. DISCUSSION
Soil CO
2
efflux and soil moisture of the dry plots experi-
enced small variations over the year highlighting the impor-
tance of the control by soil water. Relative soil water content
remained quite constant around 0.5 (Fig. 1a), that is a soil
matrix potential lower than –1 MPa. Bacterial respiration is
severely restricted below –1.5 MPa, whereas root and sapro-
phytic fungi respiration is less affected. Fungi respiration
remains quite constant till –2 MPa [31, 50]. Coarse root respi-
ration is not affected by our treatment as the volume of soil
submitted to water stress imposed in the experimental plot is
much smaller than the volume of soil exploited by these roots.
The water manipulation treatments done in Puéchabon com-
bine the seasonal short-term variations of soil moisture (Control)
with long-term imposed soil moisture (D and W treatments).
Due to the small size of the plots (0.09 m
2
), we could assume
that the treatments had no effect on coarse root respiration. On
the contrary, long-term effects on microbial biomass composi-
tion and activities could be eventually provoked by the water
manipulation. The differences in soil respiration for the
August and September measurement (Fig. 1a) when tempera-
ture and RWC were quite comparable could be possibly due to
such an effect. Acclimation of microbial populations to long-
term modifications of soil water status should be tested on
controlled experiments to identify some possible mechanims
of regulation.
A large body of literature considers soil temperature and
water content as two of the most important parameters control-
ling the variations of soil respiration [14, 24, 34, 41]. The
strong seasonal variations of soil CO
2
efflux recorded in our
study re-emphasize these controls by temperature and soil
moisture as mentioned in previous studies in Mediterranean
[4, 10, 12, 15, 32, 38] or semi-arid conditions [17]. When soil
water content remains constantly high, temperature is the only
parameter related to soil respiration variations [28, 30, 46, 47].
In the majority of the studies, soil moisture plays an important
role and many functions have been proposed to describe it [11,
49]. Interactions between both factors are emphasized by [18],
but only few models consider them [6, 17]. Carlyle and Ba
Than [9] have shown that the Q
10
factor of respiration varies
with soil moisture. The model ‘Expo’ based on the assumption
that the temperature effect was dependent on soil moisture
gave the best fit in our case and could be proposed as a generic
model when strong seasonality of the rainfall regime and
consequently soil moisture conditions is the rule, as in the
Mediterranean climate. The temperature sensitivity of soil res-
piration was strongly affected by soil water status (Fig. 4)
leading to severe limitations under low RWC values. Express-
ing the moisture as RWC over the five days preceding the
measurement day gave slightly better results than expressing
it as soil matrix potential. The matrix potential theoretically
allows to compare soils of different texture, but there is no
general agreement in the literature concerning the best way to
describe the effect of soil moisture on microbial processes
[40]. In our case, it could be noted that the main differences
between the models using RWC or matrix potential were
observed in the period of drying event after rainspell.
Strong limitations of ecosystem respiration caused by soil
drought were recorded during the four years of measurements.
The same pattern was observed too in other Mediterranean
evergreen Q. ilex forests in Italy [37]. The temperature sensi-
tivity of ecosystem respiration was less severely affected by
soil water status than soil respiration. The distinct time-scales
of responses between microbial population and perennial lig-
neous plants have to be considered among the several possible
mechanisms accounting for this distinct control. For instance,
in the Puéchabon conditions we observed that a small summer
rain of 5 mm rewetting the superficial soil layer provoked a
strong flush of soil respiration though not having significant
effect on plant gas exchanges.
The dependence of ecosystem respiration on soil tempera-
ture and moisture provoked important embedded fluctuations
at daily and seasonal scales. Over the four years of study, soil
temperature was always < 10 °C from the beginning of
November to mid-March. During these periods, respiration
was not affected by severe soil moisture limitations. In con-
trast, when soil temperature was higher than 10 °C, i.e.
240 days per year, respiration was severely depressed when
RWC was under 0.7. Over the four years, these environmental
conditions occurred on 86 days, i.e. 36% of the high soil tem-
perature periods. The year 1998 was the driest with 40% of the
non-temperature limited period affected by soil moisture lim-
itations. This value was only 31% in 1999 and 37% in 2000
and 2001. As for the soil, ecosystem respiration models cannot
reproduce the strong variations of daily measurements by a
simple multiplicative effect of soil moisture and temperature.
In contrast, this behaviour is adequately described (r
2
=0.79,
RMSE = 0.54) by the ‘Expo’ model where temperature sensi-
tivity is under soil moisture control.
Soil and ecosystem respirations are under the control of both
temperature and soil moisture, but these two variables are not
independent, the effects of temperature being affected by the
soil moisture level. The temperature sensitivity of respiration
was strongly dependent of soil water status for both soil and
ecosystem. Interestingly, the sensitivity is much higher for soil
than for ecosystem. This results in large uncertainties to pre-
dict how the carbon storage could be affected by climatic
changes. Despite their complexity, studies dealing with the
parameters controlling respiration are necessary, respiration
being the key factor of the ecosystem carbon balance in
Europe [48]. It has been shown that the increase of temperature
has a greater impact on the global respiration of the ecosystem
Figure 4. Dependency of temperature sensitivity of respiration on
relative water content (RWC). The solid line corresponds to soil
respiration and the dotted line to ecosystem respiration.
Topsoil moisture and CO
2
efflux 525
than on primary production [24]. The higher control by topsoil
moisture and higher temperature sensitivity for soil respiration
than for ecosystem respiration shown in the Puéchabon forest
should be confirmed for other water-limited ecosystems.
Acknowledgments: This study was supported by the MEDEFLU
(ENV4-CT98-0455) and CARBOEUROFLUX (EVK2-CT-1999-
00032) European Commission Projects.
REFERENCES
[1] Aubinet M., Grelle A., Ibrom A., Rannik U., Moncrieff J., Foken
T., Kowalski A.S., Martin P.H., Berbigier P., Bernhofer C.,
Clement R., Elbers J., Granier A., Grunwald T., Morgenstern K.,
Pilegaard K., Rebmann C., Snijders W., Valentini R., Vesala T.,
Estimates of the annual net carbon and water exchange of forests:
the Euroflux methodology, Adv. Ecol. Res. 30 (2000) 113–175.
[2] Baldocchi D.D., Hicks B.B., Meyers T.P., Measuring biosphere-
atmosphere exchanges of biologically related gases with
micrometeorological methods, Ecology 69 (1988) 1331–1340.
[3] Baldocchi D.D., Verma S.B., Matt D.R., Anderson D.E., Eddy-
correlation measurements of carbon dioxide efflux from the floor of
deciduous forest, J. Appl. Ecol. 23 (1986) 967–975.
[4] Billès G., Cortez J., Lossaint P., L’activité biologique des sols dans
les écosystèmes méditerranéens. I. Minéralisation du carbone, Rev.
Ecol. Biol. Sol 8 (1971) 375–395.
[5] Billès G., Cortez J., Lossaint P., Lafont F., Prioton J., Étude compa-
rative de l’activité biologique des sols sous peuplements arbustifs
et herbacés de la garrigue méditerranéenne. I. Minéralisation du
carbone et de l’azote, Rev. Ecol. Biol. Sol 12 (1975) 115–139.
[6] Bowden R.D., Newkirk K.M., Rullo G.M., Carbon dioxide and
methane fluxes by a forest soil under laboratory-controlled
moisture and temperature conditions, Soil Biol. Biochem. 30
(1998) 1591–1597.
[7] Buchan G.D., Grewal K.S., The power-function model for the soil
moisture characteristic, J. Soil Sci. 41 (1990) 111–117.
[8] Campbell G.S., A simple method for determining unsaturated
conductivity from moisture retention data, Soil Sci. 117 (1974)
311–314.
[9] Carlyle J.C., Ba Than U., Abiotic controls of soil respiration
beneath an eighteen-year-old Pinus radiata stand in south-eastern
Australia, J. Ecol. 76 (1988) 654–662.
[10] Casals P., Romanya J., Cortina J., Bottner P., Couteaux M.M.,
Vallejo V.R., CO
2
efflux from a Mediterranean semi-arid forest
soil. I. Seasonality and effects of stoniness, Biogeochemistry 48
(2000) 261–281.
[11] Davidson E.A., Belk E., Boone R.D., Soil water content and
temperature as independent or confounded factors controlling soil
respiration in a temperate mixed hardwood forest, Glob. Change
Biol. 4 (1998) 217–227.
[12] Ellis R.C., The respiration of the soil beneath some eucalyptus
forest stands as related to the productivity of the stands, Aust. J. Soil
Res. 7 (1969) 349–357.
[13] Epron D., Farque L., Lucot E., Badot P.M., Soil CO
2
efflux in a
beech forest: dependence on soil temperature and soil water
content, Ann. For. Sci. 56 (1999) 221–226.
[14] Fang C., Moncrieff J.B., A model for soil CO
2
production and
transport. 1. Model development, Agric. For. Meteorol. 95 (1999)
225–236.
[15] Fouseki E., Margaridis N.S., Soil metabolism and decomposition in
a phryganic (East Mediterranean) ecosystem, Oecologia 50 (1981)
417–421.
[16] Hanson P.J., Wullschleger S.A., Bohlman S.A., Todd D.E.,
Seasonal and topographic pattern of forest floor CO
2
efflux from an
upland oak forest, Tree Physiol. 13 (1993) 1–15.
[17] Holt J.A., Hodgen J., Lamb D., Soil respiration in the seasonally
dry tropics near Tawnsville, North Queensland, Soil Biol.
Biochem. 28 (1990) 737–745.
[18] Howard P.J.A., Howard D.M., Respiration of decomposing litter in
relation to temperature and moisture. Microbial decomposition of
tree and shrub leaf litter, Oikos 33 (1979) 457–465.
[19] Jenkinson D.S., Adams D.E., Wild A., Model estimates of CO
2
emissions from soil in response to global warming, Nature 351
(1991) 304–306.
[20] Joffre R., Rambal S., Romane F., Local variations of ecosystem
functions in Mediterranean evergreen oak woodland, Ann. Sci. For.
53 (1996) 561–570.
[21] Kätterer T., Reichstein M., Andrén O., Lomander A., Temperature
dependence of organic matter decomposition: a critical review
using literature data analyzed with different models, Biol. Fertil.
Soils 27 (1998) 258–262.
[22] Kicklighter D.W., Melillo J.M., Peterjohn W.T., Rastetter E.B.,
McGuire D.A., Steudler P.A., Aber J.D., Aspects of spatial and
temporal aggregation in estimating regional carbon dioxide fluxes
from temperate forest soils, J. Geophys. Res. 99 (1994) 1305–1315.
[23] Kirschbaum M.U.F., The temperature dependence of soil organic
matter decomposition, and the effect of global warming on soil
organic C storage, Soil Biol. Biochem. 27 (1995) 753–760.
[24] Kirschbaum M.U.F., Will changes in soil organic carbon act as a
positive or negative feedback on global warming?, Biogeochemis-
try 48 (2000) 21–51.
[25] Lloyd J., Taylor J.A., On the temperature dependence of soil
respiration, Funct. Ecol. 8 (1994) 315–323.
[26] Merzouki A., Les effets d’une coupe à blanc sur l’activité
biologique d’un sol fersiallitique méditerranéen, Université des
Sciences et Techniques du Languedoc, Montpellier, 1986, p. 185.
[27] Moncrieff J., Massheder J., De Bruin H., Elbers J., Friborg T.,
Heusinkveld B., Kabat P., Scott S., Soegaard H., Verhoef A., A
system to measure surface fluxes of momentum, sensible heat,
water vapour and carbon dioxide, J. Hydrol. 188–189 (1997) 589–
611.
[28] Nakane K., Khono T., Horikoshi T., Root respiration rate before
and just after clear-felling in a mature, deciduous, broad-leaved
forest, Ecol. Res. 11 (1996) 111–119.
[29] O’Connel A.M., Litter decomposition, soil respiration and soil
chemical and biochemical properties at three contrasting sites in
karri (Eucalyptus diversicolor F. Muell.) forests of south-western
Australia, Aust. J. Ecol. 12 (1987) 31–40.
[30] Ohashi M., Gyokusen K., Saito A., Measurement of carbon dioxide
evolution from a Japanese cedar (Cryptomeria japonica D. Don)
for floor using an open-flow chamber method, For. Ecol. Manage.
123 (1999) 105–114.
[31] Orchard V.A., Cook F.J., Relationship between soil respiration and
soil moisture, Soil Biol. Biochem. 15 (1983) 447–453.
[32] Piñol J., Alcañiz J.M., Rodà F., Carbon dioxide efflux and pCO
2
in
soils of the Quercus ilex montane forests, Biogeochemistry 30
(1995) 191–215.
[33] Raich J.W., Potter C.S., Bhagawati D., Interannual variability in
global soil respiration, 1980-94, Glob. Change Biol. 8 (2002) 800–
812.
[34] Raich J.W., Schlesinger W.H., The global carbon dioxide flux in
soil respiration and its relationship to vegetation and climate, Tellus
44B (1992) 81–99.
[35] Rambal S., The differential role of mechanisms for drought
resistance in a Mediterranean evergreen shrub: a simulation
approach, Plant Cell Environ. 16 (1993) 35–44.
[36] Rambal S., Productivity of Mediterranean-type ecosystems, in:
Mooney H.A., Roy J., Saugier B. (Eds.), Terrestrial global
productivity: past, present, future, Academic Press, San Diego,
2001, pp. 315–344.
[37] Reichstein M., Tenhunen J.D., Roupsard O., Ourcival J.M., Rambal
S., Dore S., Valentini R., Ecosystem respiration in two Mediterra-
nean Holm Oak forests: drought effect and decomposition dynam-
ics, Funct. Ecol. 16 (2002) 27–39.
526 R. Joffre et al.
[38] Rey A., Pegoraro E., Tedeschi V., De Parri I., Jarvis P.G., Valentini
R., Annual variation in soil respiration and its components in a
coppice oak forest in Central Italy, Glob. Change Biol. 8 (2002)
851–866.
[39] Ritchie J.T., Model for predicting evaporation from a row crop with
incomplete cover, Water Resour. Res. 8 (1972) 1204–1213.
[40] Rodrigo A., Recous S., Neel C., Mary B., Modelling temperature
and moisture effects on C-N transformations in soils: comparaison
of nine models, Ecol. Model. 102 (1997) 325–339.
[41] Rustad L.E., Huntington T.G., Boone R.D., Controls on soil
respiration: implications for climate change, Biogeochemistry 48
(2000) 1–6.
[42] Sampson D.A., Janssens I.A., Ceulemans R., Simulated soil CO
2
efflux and net ecosystem exchange in a 70-year-old Belgian Scots
pine stand using the process model SECRETS, Ann. For. Sci. 58
(2001) 31–46.
[43] Saxton K.E., Rawls W.J., Romberger J.S., Papendick R.I.,
Estimating generalized soil-water characteristics from texture, Soil
Sci. Soc. Am. J. 50 (1986) 1031–1036.
[44] Schlesinger W.H., Andrews J.A., Soil respiration and the global
carbon cycle, Biogeochemistry 48 (2000) 7–20.
[45] Singh J.S., Gupta S.R., Plant decomposition and soil respiration in
terrestrial ecosystems, Bot. Rev. 43 (1977) 449–528.
[46] Tate K.R., Ross D.J., O’Brien B.J., Kelliher F.M., Carbon storage
and turnover, and respiratory activity, in the litter and soil of old-
growth southern beech (Nothofagus) forest, Soil Biol. Biochem. 25
(1993) 1601–1612.
[47] Thuille A., Buchmann N., Schulze E D., Carbon stocks and soil
respiration rates during deforestation, grassland use and subsequent
Norway spruce afforestation in the Southern Alps, Italy, Tree
Physiol. 20 (2000) 849–857.
[48] Valentini R., Matteucci G., Dolman A.J., Schulze E D., Rebmann
C., Moors E.J., Granier A., Gross P., Jensen N.O., Pilegaard K.,
Lindroth A., Grelle A., Bernhofer C., Grünwald T., Aubinet M.,
Ceulemans R., Kowalski A.S., Vesala T., Rannick Ü., Berbigier
P.D.L., Gumundsson J., Thorgeirsson H., Ibrom A., Morgenstern
K., Clement R., Moncrieff J., Montagnani L., Minerbi S., Jarvis
P.G., Respiration as the main determinant of carbon balance in
European forests, Nature 404 (2000) 861–865.
[49] Wildung R.E., Garland T.R., Buschbom R.L., The interdependent
effects of soil temperature and water content on soil respiration rate
and plant root decomposition in arid grassland soils, Soil Biol.
Biochem. 7 (1975) 373–378.
[50] Wilson J.M., Griffin D.M., Water potential and the respiration of
microorganisms in the soil, Soil Biol. Biochem. 7 (1975) 199–204.
To access this journal online:
www.edpsciences.org