Báo cáo lâm nghiệp:" Vegetation control and fertilization in midrotation Pinus taeda stands in the southeastern United States" pot
Bạn đang xem bản rút gọn của tài liệu. Xem và tải ngay bản đầy đủ của tài liệu tại đây (195.06 KB, 6 trang )
619
Ann. For. Sci. 60 (2003) 619–624
© INRA, EDP Sciences, 2004
DOI: 10.1051/forest:2003054
Original article
Vegetation control and fertilization in midrotation Pinus taeda
stands in the southeastern United States
Timothy J. ALBAUGH
a
*, H. Lee ALLEN
a
, Bruce R. ZUTTER
b
, Harold E. QUICKE
c
a
Department of Forestry, North Carolina State University, Box 8008, Raleigh, NC 27695-8008, USA
b
Auburn University, Auburn, AL, USA
c
BASF Corporation, Auburn, AL, USA
(Received 5 July 2002; accepted 24 February 203)
Abstract – We quantified Pinus taeda L. plantation response to vegetation control (VC) applied using site specific methods including chemical
(glyphosate, imazapyr, metsulfuron methyl, and triclopyr) and mechanical means and nitrogen and phosphorus fertilization on a variety of sites
ranging in age from ten to twenty-two years old at treatment initiation in the Piedmont and coastal plain of the southeastern United States. We
examined pine and hardwood (the primary competing vegetation) basal area and pine volume and foliar nutrient responses in a 2 × 2 factorial
combination of a one time application of VC and fertilization in a randomized complete block design with three or four replications at each site.
Vegetation control reduced hardwood vegetation at least 70% at all sites. On average, annual pine volume growth response was greatest on the
combined treatment (6.1 and 11.0 m
3
ha
–1
yr
–1
) followed by fertilization alone (5.5 and 7.9 m
3
ha
–1
yr
–1
) and then VC alone (1.1 and
4.5 m
3
ha
–1
yr
–1
) for years one and two and years three and four, respectively. The range in pine volume response across all treatments for the
sites examined here was –3 to 12 m
3
ha
–1
yr
–1
. There may be sites, not represented here, with greater water deficits, more competing vegetation,
or where nitrogen and phosphorus are not the primary limiting factor that would be more responsive to VC. Fertilization alone did not
significantly affect hardwood basal area at year two or four and the proportion of hardwood vegetation (as basal area) was about the same before
treatment (12%) and up to four years after treatment (11%) in the check and fertilized treatments. We hypothesize that the combined treatment
may provide the best pine response in later measurement periods as fertilization responses diminish because added nutrients are utilized and
VC responses increase from increased nutrient and moisture availability to the pines provided the competing vegetation does not recover.
vegetation control / fertilization / nitrogen / phosphorus / pine
Résumé – Contrôle de la végétation et fertilisation de peuplements de Pinus taeda à mi-révolution dans les états du Sud-Est des USA.
Nous avons évalué l’effet sur des plantations de Pinus taeda L. de différentes méthodes de contrôle de la végétation (VC) à savoir des
traitements chimiques (glyphosate, imazapyr, metsulfuron, methyl et triclopyr) , des interventions mécaniques et une fertilisation phosphatée,
ceci sur un ensemble de stations situées en plaine et en piedmont des Etats du Sud Ouest, portant des peuplements allant de 10 à 22 ans en début
d’expérience. Nous avons étudié la surface terrière des pins et des feuillus (principale végétation concurrente) ainsi que le volume et la
composition foliaire en nutrients des pins dans un dispositif en bloc complet à 2 ou 3 répétitions, avec une combinaison factorielle 2 × 2 d’une
seule application de VC et de fertilisation. Le contrôle de la végétation réduit l’importance des feuillus de 70 % au moins, sur toutes les stations.
En moyenne, c’est le traitement combiné qui a l’effet le plus important sur le volume de pin (6,1 et 11,0 m
3
ha
–1
an
–1
) suivi par la fertilisation
seule (5,5 et 7,9 m
3
ha
–1
an
–1
) et par le VC seul (1,1 et 4,5 m
3
ha
–1
an
–1
), les deux nombres entre parenthèses correspondant aux années 1 et,
puis 3 et 4. L’amplitude de l’effet sur le volume des pins pour l’ensemble des traitements et des stations va de –3 à 12 m
3
ha
–1
an
–1
. Il est
possible que certains stations, non représentées ici, caractérisées par un plus grand déficit en eau, une concurrence plus importante et des
disponibilités suffisantes en azote et phosphore, puissent réagir de manière plus importante aux traitements de contrôle de la végétation. La
fertilisation seule n’a pas d’effet significatif sur la surface terrière des feuillus aux années 2 et 4 ; la proportion de feuillus en surface terrière
est à peu près la même avant et après traitement (12 et 11 %) dans les parcelles témoins et fertilisées. Pour expliquer la supériorité du traitement
combiné sur la croissance des pins au bout de 4 ans, nous émettons l’hypothèse suivante : l’effet fertilisation tend à diminuer, les nutrients
apportés ayant été utilisés, mais l’effet VC augmente compte tenu de l’augmentation des disponibilités en nutrients et en eau au profit des pins,
la végétation concurrente ne pouvant pas se développer.
contrôle de la végétation / fertilisation / azote / phosphore / pin
1. INTRODUCTION
Nutrient and water limitations may reduce pine stand
growth by reducing foliage production and longevity, and
photosynthesis rates [1]. Loblolly pine (Pinus taeda L.) is the
principal commercial tree species in the southeast United
States, and understanding the resources limiting its growth
will be important from an economic and scientific point of
* Corresponding author:
620 T.J. Albaugh et al.
view. Control of competing vegetation reallocates nutrient and
water resources used by the competing vegetation to the crop
species [2] and may alter site conditions to increase soil nutri-
ent supply. Fertilization directly impacts nutrient availability
[3] and has a more indirect impact on water use efficiency [9].
Since both, vegetation control (VC) and fertilization, can
impact the same resources but in different ways they may be
substitutes or they may create a synergistic result when
applied together. Quantification of pine and competing vege-
tation response to VC and fertilization applied singly or in
combination is a necessary step in understanding the primary
resource limitation to pine growth.
In the past, there has been much research examining VC
and fertilization when applied individually. Pines have con-
sistently exhibited positive growth responses to control of both
herbaceous and woody competing vegetation during the first
few years following planting [6–8, 15, 17, 19]. However, the
beneficial effects of a single application of VC following
crown closure, are not as well documented [25]. Significant
increases in loblolly and slash (P. elliottii) pine growth follow-
ing complete and sustained vegetation control have been
observed [11, 20]. Positive growth responses to nitrogen and
phosphorus applications in mid-rotation loblolly pine planta-
tions have been well documented across a variety of sites and
stand conditions in the southeastern United States [2, 10, 16].
More recently studies have reported significant growth
gains relative to check for VC and fertilization applied singly
and when combined for applications at the time of planting [4,
18, 21–23]. Powers and Reynolds found that in P. ponderosa
systems with extended summer droughts and infertile soils the
primary limitation to growth was first soil moisture availability
and secondarily nutritional limitations [23]. Hanna found
changes in soil moisture and N availability due to treatment in
an examination of mid-rotation application of VC and fertili-
zation to a stand with different levels of initial competing
hardwood vegetation on one site in the southeast United States
[13, 14]. Soil moisture availability was increased with VC and
reduced with fertilization while N availability was increased
with low levels of competing hardwoods or when combined
with the application of VC. Regardless of the assessments of
soil moisture and N availability two years after treatment, the
fertilized stands produced more volume growth than the VC
treated stands, however the combined treatment out performed
either treatment applied alone. Hanna’s work [13, 14] was
completed at one site where differing levels of competing veg-
etation were identified for treatment purposes and hence may
not represent the response to these treatments under a variety
of stand and environmental conditions.
Our objective was to quantify loblolly pine volume growth
and foliar nutrient concentration response to a one-time treat-
ment of VC and fertilization applied singly and in combination
over a wide range of sites in the southeastern United States. In
addition, we examined the effects of fertilization alone on the
basal area growth of pines and competing hardwoods.
2. METHODS
Eight studies were installed from 1996 to 1999 on a range of sites
with varying amounts of competing vegetation (Tab. I). The studies
were installed in Alabama, Georgia, North and South Carolina by
members of the North Carolina State Forest Nutrition and the Auburn
University Silvicultural Herbicide Cooperatives. Seven sites (1201,
1301, 2601, 3002, 3901, 4001 and 4301) were well-drained upland
Table I. Pre-treatment site characterizations and treatment applications
a
.
Pine Hardwood
Study
bc
State
Year
installed
Age
Stem density Height Basal area Basal area Vegetation control
Stems ha
–1
se
d
mse m
2
ha
–1
se m
2
ha
–1
se Herbicide Application
1201 AL 1999 12 1581 49 9.5 0.2 22.0 0.8 1.3 0.1 12 L ha
–1
imazapyr Helicopter
1301 NC 1998 14 1212 74 13.1 0.2 26.1 1.1 8.9 0.6 50% triclopyr solution,
followup with glyphosate
Spray
stumps and
regrowth
2601 AL 1996 10 1584 57 8.6 0.1 15.4 0.6 2.6 0.2 12 L ha
–1
imazapyr + l L ha
–1
metsulfuron methyl
Helicopter
2602 NC 1999 12 640 13 12.9 0.2 17.7 0.4 1.5 0.2 9 L ha
–1
imazapyr Skidder
3002 GA 1999 12 1985 41 9.7 0.1 24.9 0.4 2.2 0.2 12 L ha
–1
imazapyr + 0.25% Helicopter
3901 AL 1998 18 538 12 15.5 0.2 18.0 0.4 1.4 0.2 12 L ha
–1
imazapyr Helicopter
4001 SC 1997 22 498 13 16.4 0.1 18.5 0.3 3.1 0.3 92 kg ha
–1
hexazione
e
and 25%
solution imazapyr in water
Spotgun and
injection
4301 GA 1997 14 1508 29 12.3 0.1 29.7 0.4 2.5 0.2 12 L ha
–1
imazapyr + 0.25% Helicopter
a
All sites had fertilizer application of 224 kg ha
–1
elemental N and 56 kg ha
–1
elemental P.
b
Studies installed on NCSFNC member company land holdings.
c
2602, 3901 and 4001 were thinned prior to establishment.
d
Standard error.
e
The hexazinone was ineffective so the imazapyr actually controlled the competing vegetation.
Vegetation control and fertilization in Pinus taeda 621
sites and one site (2602) was a poorly drained coastal plain site. All
sites have data two growing seasons after treatment and 2601, 3901,
4001 and 4301 have data for four growing seasons after treatment
with the following exceptions: no foliar nutrient data were available
for 3002 and hardwood measurements were not completed at 3901
four growing seasons after treatment
The experimental design was a 2 × 2 factorial of VC and fertiliza-
tion replicated three or four times in a randomized complete block
design at each site. All installations were selected and blocked to min-
imize pretreatment variation in dominant height, volume, basal area,
and stocking of the planted pines, and hardwood basal area. Plots
were at least 0.04 hectares with at least 40 planted pines and sur-
rounded by a treated buffer. Check plots received no treatment. Veg-
etation control was accomplished by a one-time application of herbi-
cides applied in the fall prior to the installation year (Tab. I).
Fertilization was a one-time application of 224 and 56 kg ha
–1
of ele-
mental nitrogen (N) (as urea and diammonium phosphate) and phos-
phorus (P) (as diammonium phosphate), respectively, and applied in
the spring of the year installed. The combined VC and fertilization
treatment was the same used for the individual treatments but applied
together.
Height and diameter of planted pines and hardwood rootstocks
greater than 1.4 m in height were measured in the dormant season
(December to February) prior to establishment and two and four
growing seasons after establishment. Individual pine tree volumes
were calculated using [V
ob
= 0.02364 + 0.00275 × D
2
H] where V
ob
is volume outside bark, D is diameter at breast height (1.4 m) and H
is total tree height [27]. Stand volume estimates were the sum of all
individual tree volumes scaled to a hectare basis. Foliage was col-
lected from five dominant or co-dominant pine trees in each plot
(same five at each collection) during the dormant season after two
and four growing seasons. Foliage was collected from the first flush
foliage on a primary lateral branch in the upper one-third of the live
crown. Foliage samples were dried to a constant weight at 65 °C,
ground and analyzed for nutrients using CHN (for nitrogen) and a
nitric acid digest and ICP analysis for all other elements.
Analysis of variance (ANOVA) was used to test for the VC, ferti-
lization, and VC by fertilization interaction effects on the measured
pine and hardwood growth parameters using SAS [26]. Block, VC
and fertilization were assigned as class variables in the ANOVA so
the typical model statement was DV = B VC F VC*F where DV was
the dependent variable, B was block, VC was vegetation control and
F was fertilization. All significance levels were p < 0.05.
3. RESULTS
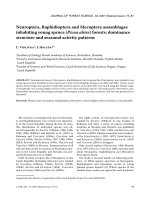
Hardwood basal area was significantly reduced by at least
70% at all sites with the applied vegetation control treatment
(Fig. 1). However, the applied VC treatment at three of the
eight sites (1301, 2601 and 4301) also adversely affected the
pine trees. At 1301, competing pines (P. virginiana) were cut
at the base and these stumps were inadvertently treated with
triclopyr which damaged the crop pines through root grafts. At
2601, the chemicals applied (imazapyr and metsulfuron
methyl) have the same mode of action and resulted in a dose
great enough to damage the crop pines. Finally, at 4301, a sur-
factant labeled for site preparation, not release, was used
which resulted in damage to the crop pines. Consequently,
these three sites were not included in the analyses involving
the VC treatment; however, these sites were used for analyses
involving only the examination of check and fertilization treat-
ment growth responses.
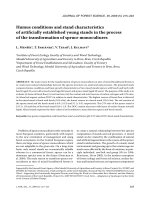
On the VC treatments, average hardwood basal area remain-
ing two (from 1201, 2602, 3002, 3901 and 4001) and four (from
4001) years after treatment was 0.42 (maximum of 0.73 and
minimum of 0.06 m
2
ha
–1
) and 0.30 m
2
ha
–1
, respectively
(Fig. 2). Corresponding average hardwood basal area on the
check treatment was 2.4 (maximum of 2.1 and minimum of
3.0 m
2
ha
–1
) and 3.8 m
2
ha
–1
and on the fertilized treatment 2.3
(maximum of 1.6 and minimum of 2.9 m
2
ha
–1
) and 4.1 m
2
ha
–1
two and four years after treatment, respectively (Fig. 2).
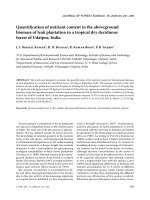
Foliar N and P concentrations were, on average, elevated
with VC but the response was not significant at any of the sites
measured (1201, 2602, 3901 and 4001). Foliar N and P con-
centrations were significantly increased on the fertilized treat-
ments at these sites two years after treatment. Check treatment
foliar N and P average concentrations and standard deviations
(in parentheses) were 1.21% (0.12) and 0.114% (0.014),
respectively. The average response in the fertilized treatment
relative to the check N and P concentrations was 17 and 18%,
respectively (Fig. 3). The combined treatment resulted in an
average increase in N and P concentration relative to the check
of 24 and 22%, respectively (Fig. 3).
Of the five sites (1201, 2602, 3002, 3901 and 4001), VC
treatments resulted in significantly increased volume growth
Figure 1. Response relative to check plot hardwood basal area two
years after treatments were applied for the eight study sites.
Figure 2. Hardwood basal area prior to treatment (growing seasons
after treatment = 0), two and four growing seasons after treatment.
Year 0 and 2 are means from five sites (1201, 2602, 3002, 3901,
4001) and year 4 is from one site (4001).
622 T.J. Albaugh et al.
at two sites with two year data and one site with four year data
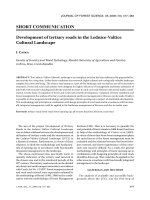
(Tab. II). The average annual pine volume growth response to
VC was 1.1 and 4.5 m
3
ha
–1
yr
–1
for years one and two and
years three and four, respectively (Fig. 4). Fertilization
resulted in a significant positive pine volume growth response
for all five sites with two year data and both sites with four
year data (Tab. II). Average annual volume response to fertili-
zation was 5.5 and 7.9 m
3
ha
–1
yr
–1
in years one and two and
years three and four, respectively (Tab. II and Fig. 4). The
response to the interaction of VC and fertilization was not sig-
nificant. However, the combined treatment (VC and fertiliza-
tion applied together) was greater than the response to either
single treatment at four of the five sites in year two and both
sites in year four. The combined treatment response was
greater than the sum of the single treatment responses for two
sites at year two and for one site at year four. Average annual
volume response to the combined treatment was 6.1 and
11.0 m
3
ha
–1
yr
–1
in years one and two and years three and
Table II. Stand pine volume growth (m
3
ha
–1
) and statistics for all sites for each measurement period.
Check
growth
m
3
ha
–1
Treatment response
a
Statistics
Study
b
VC Fert VC + Fert VC Fert Fert*VC
m
3
ha
–1
%m
3
ha
–1
%m
3
ha
–1
% p value
Years 1–2
1201
1301
2601
2602
3002
3901
4001
4301
53
33
54
38
33
40
36
55
–6
–6
–7
11
3
–4
6
–10
–11
–18
–12
30
9
–5
18
–18
13
12
5
9
14
9
11
8
25
37
9
25
38
28
31
15
16
–2
7
18
2
11
15
3
31
–7
13
49
6
33
41
6
0.765
0.076
0.682
0.022
0.146
0.839
0.028
0.039
0.004
0.144
0.134
0.053
0.036
0.028
0.001
0.007
0.350
0.415
0.444
0.761
0.020
0.572
0.477
0.421
Years 3–4
2601
3901
4001
4301
46
28
24
51
–7
3
16
–10
–16
11
66
–20
6
13
18
–2
12
48
77
–7
18
19
24
5
39
70
103
9
0.669
0.458
0.002
0.653
0.036
0.031
0.000
0.085
0.133
0.797
0.082
0.029
Years 1–4
2601
3901
4001
4301
100
68
59
106
–14
–1
22
–20
–14
–1
37
–19
10
23
29
6
10
33
50
5
25
30
39
8
25
45
66
8
0.973
0.722
0.002
0.155
0.054
0.022
0.000
0.017
0.214
0.677
0.122
0.086
a
Treatments are VC = vegetation control, Fert = fertilization, VC + Fert = vegetation control and fertilization.
b
Studies 1301, 2601, and 4301 had improperly applied vegetation control treatments, see text.
Figure 3. Average N and P response relative to check treatment two
years after treatment (data from 1201, 2602, 3901, 4001). Average
check treatment concentrations were 1.2% for N and 0.11 for P.
Figure 4. Average annual volume response relative to the check
treatment two and four years after treatment.
Vegetation control and fertilization in Pinus taeda 623
four, respectively (Tab. II and Fig. 4). The range in pine vol-
ume response over all treatments and years for the sites
included here was –3 to 12 m
3
ha
–1
yr
–1
(Tab. II).
Fertilization alone did not significantly affect hardwood
basal area at year two or four. In the check and fertilized only
plots the average total basal area prior to treatment initiation
for all sites and for the sites with four year data (2601, 4001,
4301) was similar at 24 m
2
ha
–1
. Also the proportion of total
basal area as hardwood (12%) was similar for these site and
treatment combinations at the beginning of the study. The year
two average pine basal area growth (eight sites) in the check
and fertilized treatments was 3.6 and 4.8 m
2
ha
–1
, respec-
tively, a 31% increase with fertilization (Fig. 5). The corre-
sponding average hardwood basal area growth in the check
and fertilizer treatments was 0.5 and 0.3 m
2
ha
–1
, respectively,
a 47% decrease with fertilization (Fig. 5). After two years the
average (eight sites) total basal area in the check and fertilized
plots was 27.9 and 28.9 m
2
ha
–1
, respectively, and the propor-
tion as hardwood was 11 and 10%, respectively. For the three
sites with four year data, average pine basal area growth for
the third and fourth years after treatment in the check and fer-
tilized treatments was 2.7 and 3.5 m
2
ha
–1
, respectively, a
27% increase with fertilization (Fig. 5). Average hardwood
basal area growth in years three and four in the check and fer-
tilizer treatments was 0.6 and 0.7 m
2
ha
–1
, respectively, a 33%
increase with fertilization (Fig. 5). Consequently, after four
years the average total basal area in the check and fertilized
plots was 31.9 and 33.4 m
2
ha
–1
, respectively, and the propor-
tion as hardwood was 12 and 11%, respectively. The maxi-
mum and minimum pine and hardwood basal area growth for
each treatment (check and fertilized alone) and year (two and
four years after treatment) combination are shown in Figure 5.
4. DISCUSSION
The information for making appropriate vegetation control
prescriptions and applications does exist and is available.
Unfortunately, this information was not utilized at three sites.
Average response when applying VC treatments improperly
(sites 1301, 2601, and 4301) was –3.8 and –4.4 m
3
ha
–1
yr
–1
in years one and two and years three and four, respectively.
Assuming the sites could have achieved the average response
observed at the five (years 1 and 2) and two (years 3 and 4)
sites where VC was properly applied, the cumulative realized
loss of volume was 27.6 m
3
ha
–1
after four years. These data
indicate the importance of using the available information for
research or operational applications.
Levels of hardwood control were consistent with previous
work in young and mid-rotation stands [5, 28]. Hardwoods
showed little recovery through year four with the VC treatment.
Reported loblolly pine growth responses of 2 m
3
ha
–1
yr
–1
with complete and sustained VC four years after treatment
were similar to those found in this study [11, 20].
Over the longer term (> 4 years) VC has proven beneficial
to pine growth. Seven years after treatment in the Quicke et al.
study, the treated pines were 11–22% taller than check trees
even though initial pine stunting was observed [24]. Also,
Fortson et al. indicated that the differences in volume in check
and VC treatments continued to diverge up to at least eight
years after treatment [12].
Vegetation control may have addressed different resource
limitations at the sites where significantly positive growth
responses to VC were observed. At 2602, a poorly drained site
with a low likelihood of soil moisture limitations (relative to
the other study sites), we observed only small increases in
foliar N and P levels with VC. However, boron (B) concentra-
tions were increased 17% relative to the check two years after
treatment with VC and this increase resulted in concentrations
above that considered to be a critical level for good growth
(12 ppm). This increase in B at 2602 may be a result of the
reduction in competing vegetation that allowed the pines to
acquire B that the then dead competing vegetation had used
when it was alive. Boron is moved along with the transpiration
stream and the readily available water at this site would insure
that the pines would be able to capture any unused B. At 4001,
another site with a significant positive pine volume response
to VC, the foliar N, P, and B responses were relatively small.
Although we did not measure moisture availability, this site is
likely to experience droughty conditions during the growing
season and we hypothesize that the positive volume responses
were a result of improved soil moisture availability. Similar to
other studies, our findings indicate that, the primary benefit
from VC may be nutritional or moisture related depending on
individual site conditions [21, 23]. In future studies, it would
be interesting to examine VC and fertilization responses where
fertilization included, in addition to N and P, a broader selection
of nutrients that may be limiting (e.g. boron and potassium).
Clearly N and P were important limiting factors at all five
sites we examined. Given that all studies exhibited a significant
positive response to additions of N and P, it may be reasonable
to conclude that N and P availability were the primary limiting
factor for pine growth. However, once N and P limitations were
ameliorated, other factors limiting growth may have been amel-
iorated by VC since the combined treatment responded, on
average, more than either treatment applied alone.
This is the first study to quantify the response of competing
vegetation to fertilization in mid-rotation on a number of sites
with similar treatments. The proportion of hardwood vegeta-
tion (as basal area) at these sites appears to be largely
Figure 5. Pine and hardwood basal area growth on the check and
fertilized treatments. Bars show average values with minimum and
maximum values displayed by the endpoint of the line covering each
bar. The two year data are from all eight sites while four year data are
from three sites (2601, 4001, 4301).
624 T.J. Albaugh et al.
unchanged by the fertilizer treatment in that hardwood as a per-
centage of the total basal area in the stand is about the same
before treatment (12%) and up to four years after treatment
(11%). Given the range of competing hardwood amounts, the
relatively high applied rates of N and P, and the broadcast fer-
tilizer application method the net ability to acquire and utilize
the added nutrients may be the same for all plants, whether
hardwood or pine, in the short term. This is good news for forest
managers concerned about fertilizing when competing vegeta-
tion is present in a stand at levels similar to those in this study.
From the aspect of resource limitations in these mid-rotation
pine stands, the direct application of limited nutrients (fertili-
zation) generally provided a larger positive volume response
than the removal of competitors (VC) through four years after
treatment when the treatments were applied singly. There may
be site types, not represented in this study, with greater seasonal
water deficits or more competing vegetation, or where N and
P are not the primary limiting factor that may prove more
responsive to vegetation control in the years following treatment.
However, adding limited nutrients and removing competitors
(the combined treatment) provided an even better volume
response than either single treatment in most cases. In later
measurement periods, we would expect the fertilization response
to decrease as the added nutrients are utilized by the stand and
the VC response to increase due to increased nutrient and mois-
ture availability to the crop trees provided the competing veg-
etation does not recover. It remains to be determined how the
combined treatment will compare to the single treatments in
later measurement periods, however based on current informa-
tion one could reasonably hypothesize that the combined treat-
ment may prove to be the best one at that time.
Acknowledgments: We appreciate the support provided by the
members of the North Carolina State University Forest Nutrition
Cooperative and the Auburn Silvicultural Herbicide Cooperative, and
the Department of Forestry at North Carolina State University. The
use of trade names in this paper does not imply endorsement by the
associated agencies of the products named, nor criticism of similar
ones not mentioned.
REFERENCES
[1] Albaugh T.J., Allen H.L., Dougherty P.M., Kress L.W., King J.S.,
Leaf area and above- and belowground growth responses of loblolly
pine to nutrient and water additions, For. Sci. 44 (1998) 317–328.
[2] Allen H.L., Albaugh T.J., Understanding the interactions between
vegetation control and fertilization in young plantations: southern
pine plantations in the Southeast USA, Instituto de Pesquisas e
Estudos Florestais “Il Seminário sobre Manejo de Plantas
Infestantes em Áreas Florestais”, Department of Forest Soils at
ESALQ / Univ. of San Paulo, Brazil, 2000, 14 p.
[3] Allen H.L., Dougherty P.M., Campbell R.G., Manipulation of
water and nutrients – practice and opportunity in southern U.S. pine
forests, For. Ecol. Manage. 30 (1990) 437–453.
[4] Borders B.E., Bailey R.L., Loblolly pine – pushing the limits of
growth, South. J. Appl. For. 25 (2001) 69–74.
[5] Cain M.D., Evaluation of imazapyr for control of woody competitors
in a plantation of submerchantable-size loblolly pine, USDA For.
Serv. South. For. Exp. Sta. Res. Pap. SO-262, 1991, 11 p.
[6] Cain M.D., Mann W.F. Jr., Annual brush control increases early
growth of loblolly pine, South. J. Appl. For. 4 (1980) 67–70.
[7] Colbert S.R., Jokela E.J., Neary D.G., Effects of annual fertilization
and sustained weed control on dry matter partitioning, leaf area, and
growth efficiency of juvenile loblolly and slash pine, For. Sci. 36
(1990) 995–1014.
[8] Creighton J.L., Zutter B.R. Glover G.R., Gjerstad D.H., Planted
pine growth and survival response to herbaceous vegetation
control, treatment duration, and herbicide application techniques,
South. J. Appl. For. 11 (1987) 223–227.
[9] Ewers B.E., Oren R., Albaugh T.J., Dougherty P.M., Carry-over
effects of water and nutrient supply on water use of Pinus taeda,
Ecol. Appl. 9 (1999) 513–525.
[10] Fisher R.F., Garbett W.S., Response of semimature slash and
loblolly pine plantations to fertilization with nitrogen and
phosphorus, Soil Sci. Soc. Am. J. 44 (1980) 850–854.
[11] Fortson J.C., Shiver B.D., Shackelford L.S., Ten-year results of the
SAGS loblolly pine competing vegetation study. Preliminary
Report. Plantation Management Research Cooperative, Univ. of
Georgia, Athens, 1994, GA, USA.
[12] Fortson J.C., Shiver B.D., Shackelford L., Removal of competing
vegetation from established loblolly pine plantations increases
growth on Piedmont and Upper Coastal Plain sites, South. J. Appl.
For. 20 (1996) 188–192.
[13] Hanna S.A., Midrotation response of loblolly pine to fertilization and
vegetation control, Auburn University, Ph.D. dissertation, 2000, 209 p.
[14] Hanna S.A., Glover G.R., Lockaby B.G., Zutter B.R., Torbert J.,
Nitrogen response to vegetation control and fertilization in a
midrotation loblolly pine stand, Proc. South. Weed Sci. Soc. 52
(1991) 112–113.
[15] Haywood J.D., Response of planted Pinus taeda L. to brush control
in northern Louisiana, For. Ecol. Manage. 15 (1986) 129–134.
[16] Hynynen J., Burkhart H.E., Allen H.L., Modeling tree growth in
fertilized midrotation loblolly pine plantations, For. Ecol. Manage.
107 (1998) 213–229.
[17] Knowe S.A., Nelson L.R., Gjerstad D.H., Zutter B.R., Glover G.R.,
Minogue P.J., Dukes J.H., Four-year growth and development of
planted loblolly pine on sites with competition control, South. J.
Appl. For. 9 (1985) 11–15.
[18] Mason E.G., Milne P.G., Effects of weed control, fertilization, and
soil cultivation on the growth of Pinus radiata at midrotation in
Canterbury, New Zealand, Can. J. For. Res. 29 (1999) 985–992.
[19] Miller J.H., Zutter B.R., Zedaker S.M., Edwards M.B., Haywood
J.D., Newbold R.A., A regional study on the influence of woody
and herbaceous competition on early loblolly pine growth, South. J.
Appl. For. 15 (1991) 329–334.
[20] Oppenheimer M.J., Shiver B.D., Rheney J.W., Ten-year response
of midrotation slash pine plantations to control of competing
vegetation, Can. J. For. Res. 19 (1989) 329–334.
[21] Nilsson U., Örlander G., Response of newly planted Norway spruce
seedlings to fertilization, irrigation and herbicide treatments, Ann.
For. Sci. 60 (2003) 637–643.
[22] Nordborg F., Nilsson U., Growth, damage and net nitrogen uptake
in Picea abies (L.) Karst. seedlings, effects of site preparation and
fertilization, Ann. For. Sci. 60 (2003) 657–666.
[23] Powers R.F., Reynolds P.E., Ten-year responses of ponderosa pine
plantations to repeated vegetation and nutrient control along an
environmental gradient, Can. J. For. Res. 29 (1999) 1027–1038.
[24] Quicke H.E., Lauer D.K., Glover G.R., Growth responses following
herbicide release of loblolly pine from competing hardwoods in the
Virginia Piedmont, South. J. Appl. For. 20 (1996) 177–181.
[25] Russell T.E., Control of understory hardwoods fails to speed
growth of pole-size loblolly, USDA For. Serv. Exp. Stn. Note
No. 131 (1961) pp. 3–4.
[26] SAS Institute Inc. SAS/STAT User’s guide, Release 6.03 edition,
Cary, NC, SAS Institute Inc., 1988, 1028 p.
[27] Smalley G.W., Bower D.R., Volume tables and point sampling
factors for loblolly pine plantations on abundant fields in
Tennessee, Alabama, and Geaorgia Highlands, USDA For. Serv.
South. For. Exp. Sta., Res. Pap. SO-32, 1968.
[28] Zutter B.R., Britt J.R., Minogue P.J., Quicke H.E., Response of
hardwoods and loblolly pines two years after a midrotation aerial
application of Arsenal Applicators Concentrate, American Cyanamid
Forestry Tech. Service Research Report 97-02, 1997, 9 p.