Báo cáo lâm nghiệp: "A flexible radial increment model for individual trees in pure even-aged stands" pdf
Bạn đang xem bản rút gọn của tài liệu. Xem và tải ngay bản đầy đủ của tài liệu tại đây (1.2 MB, 9 trang )
327
Ann. For. Sci. 61 (2004) 327–335
© INRA, EDP Sciences, 2004
DOI: 10.1051/forest:2004026
Original article
A flexible radial increment model for individual trees
in pure even-aged stands
Christine DELEUZE
a
*, Olivier PAIN
a
, Jean-François DHÔTE
b
, Jean-Christophe HERVÉ
b
a
AFOCEL Station territoriale nord-est, route de Bonnencontre, 21170 Charrey-sur-Saône, France
b
Laboratoire d’étude des ressources forêt-bois, UMR INRA-ENGREF 1092, Équipe Dynamique des Systèmes Forestiers,
ENGREF, 14 rue Girardet, CS 4216, 54042 Nancy, France
(Received 7 April 2003; accepted 22 September 2003)
Abstract – To capture the common feature of various individual growth models for trees in pure and even-aged stands, a generic model with a
form parameter according to each species is proposed. With a final objective of implementing this model into simulation software of
silvicultural treatments, particular care was taken to structure the model for consistent behaviour outside the data fields of calibration and to
limit the independent variables to those available to managers. The first analysis, using data from a young spruce stand, allowed introduction
of simple variables (basal area and dominant height) to express competition effects. Then the model was fitted on a large data set to take into
account silvicultural treatments and fertility conditions. Finally the model tested on spruce was directly adjusted for Douglas-fir and was found
to be sufficiently flexible to describe growth of this species. This newly derived model is a relatively generic tool, which can be fitted for other
species in regular stands.
tree growth model / regular stand / silviculture / software / simulation / spruce / Douglas-fir
Résumé – Un modèle générique de croissance radiale d’arbre en peuplements purs et réguliers. Un modèle générique de croissance de
type arbre, pour des peuplements purs et réguliers, est proposé en utilisant les points communs de différents modèles de la littérature et en tenant
compte à travers un paramètre des différentes formes observées selon les essences. L’utilisation de ce modèle étant une implémentation
informatique dans un simulateur de sylviculture, sa forme a été contrainte pour un comportement robuste en dehors de la zone de validité, tandis
que les variables directrices ont été choisies pour faciliter l'utilisation par des gestionnaires forestiers. La première étape basée sur un jeune
peuplement clinal d’épicéa a permis d’introduire simplement l’effet de la compétition à l’aide de deux variables explicatives (surface terrière
et hauteur dominante). L’utilisation d’un large réseau d’essais a ensuite permis de prendre en compte l’effet simultané de la sylviculture et de
la fertilité. Enfin ce modèle a directement été ajusté sur une base de données de croissance de Douglas et s’est parfaitement adapté à une forme
de croissance plus progressive.
modèle de croissance d'arbre / peuplement régulier / sylviculture / logiciel / simulation / épicéa / Douglas
1. INTRODUCTION
Growth models are increasingly introduced into simulation
software of silvicultural treatments. These models have been
for a long time “tools of experts”, built and used by researchers
or experts. Now, they are often put together end to end into soft-
ware and then used by forest managers, who did not take part
in the design.
This new aim of the models has been underestimated: com-
puterized models could be used out of validity area without any
critical analysis on results. In this context it appears essential
to work on the structure and form of these models to ensure that
they exhibit a consistent behavior in simulation software.
Firstly to account for validity limits of models fitted on reduced
data sets, validity checking could be introduced inside software
to stop results outside of the validity range. However models
are often a function of many variables, thus the validity range
may be difficult to describe and implicit model extrapolations
(inside space limits, but not covered by data set) may result.
Improving model form and structure is an alternative solution
to ensure coherent behavior outside the validity range (structured
and constrained models are favored over completely empirical
models like multiple regressions).
In addition certain models also use independent variables
that can be difficult to obtain except from data resulting from
experimental tests (for instance information from the origin
stand). These explanatory variables are often kept because
“R-square” is improved during model building but they are dif-
ficult to estimate for managers.
* Corresponding author:
328 C. Deleuze et al.
Since 1996, AFOCEL has developed simulation software of
silvicultural treatments (OASIS [13]) for 3 major species (Nor-
way spruce, Maritime pine and Douglas-fir) in pure even-aged
stands. In this project, a particular emphasis is made to ensure
robust behavior of models by external users such as forest man-
agers. This paper deals with new results concerning the func-
tion of individual tree growth in circumference at breast height.
This approach on the constrained model form with few
explanatory variables consists moreover in developing rela-
tively generic tools that can be fitted for other species in regular
stands. The first stage of construction on Norway spruce is pre-
sented here, along with its adaptation to Douglas-fir.
2. STATE OF THE ART
Houllier et al. [10], then Gourlet-Fleury [9] present a review
of different growth models. To describe one stand, scale goes
from distance dependent tree growth model to general stand
model, without reference to individual trees. OASIS is a dis-
tance non-dependent tree growth model that allows interactive
relationships between silvicultural treatments and simulated
growth reactions. In addition the growth pattern of each tree can
be recalled, which is essential information to characterize the
internal quality of individual stems. On the other hand exact
location of trees is not required in these models.
Tree growth in these models can be described with one equa-
tion by tree (example of Zhang et al. [17] to describe growth
of young pines), with additional constraint to take into account
stand saturation (potential-reducer model [3, 16]).
Other models are focused on growth relation between trees
during the growth period. This approach applies the very strong
social ordered structuring between trees that is established in
regular stand after canopy closure [6]. For instance, Alder [1]
used this structuring by describing growth with a one-to-one
relationship between individual growth and initial relative size.
Dhôte [7, 8] proposed a segmented linear model between
individual basal area increment and initial circumference at
breast height (initially for beech, then for oak). It has an initial
part of null growth for understorey trees and an increasing
growth part for main vegetation storey trees. Pain [12, 14] and
Najar [11] used this same form respectively for Norway spruce
and for Maritime pine in pure even-aged stands (without the
null growth for Maritime pine for trees suppressed sufficiently
to lead to mortality). Finally Bailly et al. [2] used a segmented
cubic model for Douglas-fir, to take into account a more gradual
increase of increment for transitional trees, between suppressed
and dominant.
The general form of Dhôte’s model is quite interesting since
a threshold of social tree status (limit suppressed/dominant) and
a potential global growth (slope increment increase for domi-
nant trees) are introduced at the same time. Variations around
this model simply aim at making the segmented form slightly
more flexible (in particular for Douglas-fir), i.e. a more or less
fast increment increase around the threshold for transitional
trees. This is why a nonlinear hyperbolic model is proposed,
having two segments of Dhôte's model for limits.
To take into account a model evolving with age, environment
or competition, parameters are then related to independent
stand variables. These relationships are usually multiple regres-
sions of different stand variables (stand basal area, number of
trees per hectare, dominant or mean height, dominant or mean
diameter or basal area, basal area weighted mean diameter or
height, site index, crown ratio, different competition index,
dendrometric data for dominant trees, past mean growth, etc.),
quite contrasted from one model to another one [2, 12, 15]. Sim-
ple relationships with few explanatory variables, available to
managers, are proposed here to be fitted to different species.
3. METHODOLOGY
A general model describes tree basal area increment (Ig) as
a function of initial circumference C
i
, with 3 parameters:
threshold A, slope P, and form parameter m: m is greater than
1 (m = 1 for Dhôte’s model).
The hyperbole equation is given by 3 additional constraints:
Model passes point (0,0) i.e. basal area increments (Ig) are
null for initial null circumference (C
i
);
Towards lower C
i
(limit – ), model tends towards Ig = 0. To
ensure a passage through (0,0), asymptote is slightly negative:
Ig ≈ A(1–m);
Towards stronger C
i
(limit + ), model tends towards a linear
Ig ≈ P(C
i
–A).
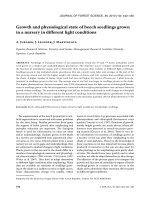
Corresponded equation is then (Fig. 1):
.
(1)
To take into account heteroscedasticity of data, observations
were weighted by 1/C
i
2
.
This model was studied for Norway spruce, using a data set
especially collected for this project. These data came from
experimental plots with continuous gradient of density. Anal-
ysis of these data made it possible: (i) to test model for annual
data, (ii) to better describe competition relationships in juvenile
stage, (iii) and to choose some simple explanatory variables,
easily available to managers.
This model was then fitted on the database from AFOCEL’s
network of experimental trials (stand densities between 350 and
4 500 trees per ha (at the first thinning); site index (dominant
height at 50 years) between 20 and 35 m).
This model was finally tested on Douglas-fir to study its
generic capability.
It was then implemented in interactive OASIS software to
simulate various forestry scenarios (in pure and even-aged
stands for different thinning treatments).
4. DATA
4.1. AFOCEL’s trials
The main database used came from AFOCEL’s network of
experimental permanent plots, which has received periodic
measurements since 1968. Available information is presented
in Table I for Norway spruce and Douglas-fir. For each indi-
vidual tree there corresponds complete stand information (age,
∞
∞
Ig P
C
i
mA mA C
i
+()
2
4AC
i
–+–
2
=
A flexible radial increment model 329
initial density, actual density, total basal area G, dominant
height Ho, etc.).
4.2. Vercel’s trial
Additional measurements were made on a large sample of
trees, coming from an experimental trial installed in 1977 with
a continuous gradient of spacing in two perpendicular direc-
tions, representing densities from 730 to 8 264 stems/ha.
Thirty-eight trees were already sampled in 1993 in 3 repeated
plots. In 1999, 224 other trees were sampled in these plots and
one complete fourth plot. Trees were selected far from previous
sampling, so that around 50 trees were selected in the first 3 plots
and 75 in the fourth one.
The height was regularly measured on all trees from plan-
tation until the present, which enabled us to make very precise
measurements of height growth by readjusting units of first
years growth to these previous measurements, and by finding
all growth unit limits (bud scale scars on the bole) until 1999.
Discs at breast height were also taken to perform ring anal-
ysis and to measure annual growth according to 4 fixed radii
(north, south, east and west).
To be able to increase the number of trees by density, we
built 6 density classes (Tab. II). Stand information was then
computed (G, Ho, N). For these groups, a local basal area G
was calculated (sum of individual basal areas/sum of space
available for each tree). In agreement with Deleuze et al. [5]
these data showed that dominant height Ho was not affected by
density. Hence all densities were pooled together when com-
puting dominant height for each plot.
5. RESULTS
5.1. Vercel
For each year, a global model (for all densities) is compared
(through a F-test) to a model with one parameter by density (the
slope P, the threshold A or the form m: see Tab. III). Residuals
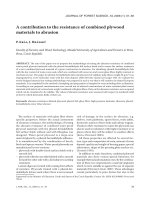
(of the global model) are compared between densities (Fig. 2).
Four stages are then characterized:
Stage 1: 1981–1984: no density effect is observed (the global
model is retained). Stand is still very young and canopy is not
closed.
Stage 2: 1985–1990: residuals decrease gradually with den-
sity (weaker growth in denser part of stand). Canopy is closed
and competition is stronger, which gradually starts in 1985
from highest densities. Effect is mainly sensitive on slope P
which decreases with density (model with local slope P by den-
sity is retained).
Stage 3: 1991–1994: differences between residuals gradu-
ally decrease for highest densities, indicating that there is no
more difference between these densities. Density effect is then
felt only by the lowest densities. It affects mainly threshold A
which increases with density (model with local threshold A is
retained).
Stage 4: 1995–1999: no more effect is visible on the model
(the global model is retained).
This model shows a gradual density effect on growth rela-
tionship. In addition, even when no effect is detected on a
model, there is a shift between tree distributions (more small
trees in the higher densities result in smaller increments).
With an increase in density, the slope decreases, while the
threshold increases, both leading simultaneously to a growth
Table I. Database characteristics for Norway spruce and Douglas-fir
from the AFOCEL’s network.
Principal data base
Norway spruce Douglas-fir
Trials number 19 21
Plots number 40 37
Nb of stand increments 341 465
Individual tree increments 33 277 32 107
Figure 1. Sensitivity analysis for individual tree growth model: variations of one of the parameters, others being constant (P = 10; A = 300;
m = 1.05). a: increase in P; b: increase in A; c: increase in m.
Table II. Density classes and number of sampled trees.
Classes of density Densities Tree nb in 1990
N1 < 1500 st/ha 60
N2 1 500–2 000 st/ha 40
N3 2 000–2 500 st/ha 40
N4 2 500–3 000 st/ha 42
N5 3 000–4 000 st/ha 42
N6 > 4 000 st/ha 38
330 C. Deleuze et al.
decrease (with equal initial sizes, trees grow slowly at higher
density). With threshold increase, some co-dominant trees in
sparse stands are regarded as suppressed in higher densities.
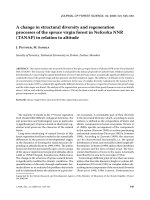
To take into account density effect (or competition) in a
stand, and to scale this effect with age or height, the ratio “total
basal area increment/dominant height increment” is used, that
increases towards an optimum, like saturation point of total
basal area increment for dominant height (Fig. 3).
To describe the exponential form of this saturation, the
S function is built:
S= e
–αG/Ho
(2)
where α is parameter, G is stand basal area, and Ho dominant
height.
For a stand, this function measures the distance from satu-
ration, which indicates deceleration of growth. α is set to 80,
to have the same threshold than Figure 3.
To describe this decrease of growth, two relationships are
introduced:
P=Po × (1+p
s
× S) (3)
A = Ao × (1+a
s
×S)
where P and A are parameters of equation (1), S is previous sat-
uration function (Eq. (2)), Po, Ao, p
s
, and a
s
are parameters.
Then the model is simultaneously fitted on all years with
2 global parameters p
s
and a
s
, taking into account density effect
and annual parameters for each year (Po and Ao). This model
is retained. Density effect is positive and stronger on slope (p
s
=
1.40 ± 0.20), negative and weaker on threshold (a
s
= –0.51 ± 0.22).
Compared to a local model (P and A per year and density),
this global model describes well the data, but added constraints
help to stabilize estimates. Graphically the evolution of density
effect is shown to become very weak in 1999 (Fig. 4).
These detailed annual data from Vercel allow one to study
separately effects of density or age. Comparatively to Dhôte’s
model on beech, density effect does not affect solely slope: ini-
tially effect is especially on slope, and then threshold is also
affected. Global model however makes it possible to show that
density effect is stronger on slope than on threshold.
For this first model, Ao seems to increase with age, and Po
is more stable (Fig. 5), as observed by Dhôte [7]. Increase of
parameter Ao with a small delay looks like crown recession and
could reflect beginning competition (canopy closure).
Figure 2. Global model residuals average (without density effect), for each density classes, and with confidence intervals. 4 years examples,
others being detailed in text.
A flexible radial increment model 331
5.2. AFOCEL’s network for Norway spruce
When increment period does not exceed one year, a sensi-
tivity analysis shows that 2 to 4 iterations of annual model give
comparable results than multiplicative model with 2 × P to 4 × P.
To take this into account the next model is directly used:
(4)
where P, A and m are parameters of equation (1), C is initial
circumference and “period” is period of growth.
Parameter P is thus automatically brought back to annual
increase and then is comparable between each increment, what-
ever their length of growth.
For each trial, each plot (silvicultural treatment), and each
growth period, a local model is fitted, and parameters A, P and
m are analyzed according to available explanatory data. A first
Table III. Results for the 4 models fitting (ggg: global model whatever density; lgg: slope P depends on density; glg: threshold A depends on den-
sity; ggl: form m depends on density). SSE: Sum of Square Errors. A F-test for the “best” local model (SSE in bold) gives retained model, and its
associated P-value.
Year n SSEggg SSElgg SSEglg SSEggl Retained model
Associated
P-value
1981 196 349.63 337.78 354.41 388.96 ggg 25.79
1982 237 860.73 830.55 768.52 1 227.85 glg 0.01
1983 256 455.51 451.84 451.38 526.05 ggg 81.03
1984 257 662.24 654.17 647.14 808.10 ggg 32.85
1985 260 946.51 867.06 876.08 1 029.35 lgg 0.05
1986 261 357.85 233.90 234.85 391.37 lgg or glg 0.00
1987 262 1 023.24 587.03 600.14 1 095.09 lgg 0.00
1988 262 1 233.18 499.73 496.25 1 418.12 glg or lgg 0.00
1989 262 549.47 239.81 246.42 724.38 lgg 0.00
1990 262 659.08 314.91 328.59 868.79 lgg 0.00
1991 262 488.38 302.61 300.60 754.70 glg 0.00
1992 262 374.14 283.24 276.24 680.97 glg 0.00
1993 224 318.82 258.32 255.33 624.23 glg 0.00
1994 224 312.94 275.25 275.47 540.23 lgg or glg 0.00
1995 224 281.15 261.65 261.22 518.56 ggg 0.69
1996 224 296.93 277.50 275.50 623.85 ggg 0.60
1997 224 286.33 279.70 280.01 717.46 ggg 40.47
1998 221 107.91 104.84 104.51 10 837.53 ggg 22.95
1999 220 221.99 208.39 210.79 439.70 ggg 1.91
Figure 3. Density effect on basal area increment and associated saturation function S for stand “potential” (according the so called “Eichhorn
rule”).
Ig P period
C
i
mA mA C
i
+()
2
4AC
i
–+–
2
××=
332 C. Deleuze et al.
effect on growth is the growth period (stand age and dominant
height), and then silvicultural treatment (density and stand
basal area).
For each trial, a relationship is found between P and dominant
height increment ∆Ho (Fig. 6). Parameter A depends mostly on
age or total dominant height (which is in agreement with
Dhôte’s model for beech and oak). Form parameter m is quite
stable, regardless of stand, plot or period. Age has a very slight
increasing effect on form during the young age, but it is quickly
stabilized towards a form value close to 1.02. Moreover a weak
Figure 4. Basal area increment Ig (mm
2
) vs initial circumference at breast height (Ci, mm). Fitting example of global model (black +) compared
to local model by density (gray x) by way of comparison.
Figure 5. Evolution with age of annual parameters Po and Ao for global model fitting on Vercel’s data (with density effect).
A flexible radial increment model 333
influence of the form parameter on fitting results has been
shown by sensitivity analysis. According to these results, a glo-
bal model is built:
A = (Aa + Ab × Ho) × (1 + Ac × exp(–α × G/Ho)) (5)
P = (Pa + Pb × ∆Ho) × (1 + Pc × exp(–α × G/Ho))
where α, Aa, Ab, Ac, Pa, Pb, Pc are parameters, G is stand basal
area, and Ho dominant height.
This global model with 8 parameters is then fitted on data
(Tab. IV) and 88.24% of variance is explained (standard error
is 0.8257 C
i
cm).
A same model is fitted when measured Ho is replaced by glo-
bal evaluation of dominant height with a stand growth model
(dominant height in simulation software is given by height
growth model, then direct fitting is powerful to avoid cumulat-
ing errors). Then 86.51% of variance is explained and residual
error is 0.8846 C
i
cm (see Tab. IV and Fig. 7 for example, trial
54001B). This error is slightly higher because real measured
heights bring information on observed variability, even if these
measurements are not directly available in simulation software.
As for Vercel, density effect is opposed for the two main
parameters: parameter P of slope (Pc > 0) decreases, whereas
parameter A of threshold (Ac < 0) increases, leading both to
growth reduction with density.
Influence of silvicultural treatments is confirmed on these
two parameters. Unlike results obtained by Dhôte for beech, the
threshold is also influenced by silviculture. Once more, the
ratio G/Ho seems efficient to describe competition pressure on
individual tree growth. However parameter α can be estimated
and is relatively far from the fixed value for Vercel. Density
effect is thus more regular, even for values approaching max-
imum values of G/Ho.
5.3. AFOCEL’s network for Douglas-fir
The same model was directly fitted on Douglas-fir data, to
test the flexibility of the form for other species in regular stand
(Fig. 8 and Tab. IV). Comparatively to previous models for
Douglas-fir, this model limits explanatory variables to the which
are easily available to manager, ensures robust behavior inside
the calibration area and improves total explained variance
Figure 6. Relationship between slope P and dominant height increment during increment period.
Table IV. Parameters of the 3 final global models for Norway spruce and Douglas-fir, when dominant height is measured or provided by a
model (estimated parameters and their standard errors in italics).
Parameters N. spruce (measured Ho) N. spruce (estimated Ho) Douglas-fir (measured Ho)
Pa 0.2656 0.0108 0.2138 0.0124 0.1852 0.0032
Pb 0.5185 0.0201 0.6246 0.0338 0.0098 0.0032
Pc 1.198 0.1253 0.8567 0.1433 7.3383 0.0700
Aa –8.7761 0.5181 –15.5394 0.7863 –18.2098 0.1481
Ab 3.2684 0.0895 3.6075 0.1339 5.572 0.0225
Ac –1.0366 0.03356 –1.0215 0.0314 –0.6734 0.0051
a 0.7873 0.0358 0.649 0.0382 0.2722 0.0038
m 1.0165 0.0019 1.0255 0.0022 1.0312 0.0014
334 C. Deleuze et al.
(87.64% with a residual error: 1.1348 C
i
cm). Generic capabil-
ity of this growth model is then shown for pure even-aged stand
for two main species.
A form parameter is slightly greater than for Norway spruce
(1.03 instead 1.02) taking into account the more gradual
increase of increment between suppressed and dominant trees.
This form means higher shade tolerance for Douglas-fir than
Norway spruce for transitional trees.
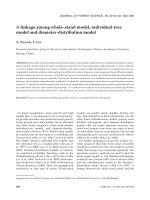
These two models were finally implemented in the AFO-
CEL’s simulation software OASIS (Fig. 9).
Figure 7. Basal area increment Ig (cm
2
) vs. initial circumference at
breast height (Ci, cm). Fitting example of final model, on Norway
spruce trial 54001B with 2 growth periods (25–29 years and 40–
43 years). By way of comparison, predictions of final model (black +)
are given with those of initial local model (adjusted by stand, period
and trial: grey x).
Figure 8. Basal area increment Ig (cm
2
) vs. initial circumference at
breast height (Ci, cm). Fitting example of final model, on Douglas-
fir trial 87066 between ages 24 and 33. Predictions of final global
model (black +) are given with those of initial local model (adjusted
by stand, year and trial: grey x), by way of comparison.
Figure 9. Simulation example of Douglas-fir model with OASIS with a dynamic silvicultural treatment.
A flexible radial increment model 335
6. DISCUSSION
The model of individual growth at breast height for Norway
spruce, adapted to Douglas-fir, is the beginning of a generic
growth model for regular (pure and even-aged) stands. Its con-
strained form partly retains the shape of Dhôte’s model, which
had proven to be effective to describe increments in different
species (oak, beech, and spruce). But by generalizing the seg-
mented Dhôte’s model with a form parameter, a softer transi-
tion from suppressed trees towards dominant trees is allowed
and it is slightly different according to species, as shown in this
paper for Douglas-fir. A more general use of this model for various
traditional species growing in regular stands could lead to a generic
model, with only one form parameter adapted to each species.
Only stand information available to forest manager is required
to implement the model. Available measurements needed are
total basal area, dominant height and their increments.
The effect of period length between measurements on
growth prediction has been particularly studied. Indeed if data
is related to periods between 3 and 7 years, facility in using sim-
ulation software can quickly lead to annual reiterations of the
model, or on the contrary to very large increment simulations
(more than 10 years). As already studied by Dhôte [8], period
length does not have a strong effect, except outside the data
framework, i.e. for increments less than 3 years or more than
7 years.
Model use for other different species finally made it possible
to start discussion on tree competition according to species
characteristics. Using flexible, general models makes it possible
to save energy by avoiding reformulating models and by allow-
ing direct comparisons to be made [4]. To go further in this
methodological step, the generic model should be tested on
other major species. Such a tool would increase the coherence
and robustness all growth models, and would allow a comparison
between species, like different social behaviours, and would
facilitate software implementation in simulators like OASIS
with numerous species. A comprehensive description of differ-
ent species in regular stands could be the first stage towards
modelling mixed stands, which is a real challenge to modellers
in the near future. Indeed operational tools for managers to sim-
ply describe mixed stands are just beginning.
Acknowledgements: This work was funded by the French ministry
of agriculture (DERF). We thank also Mr. Fleury, owner of Vercel’s
trial, who provided us trees for the annual study and also for his
friendly assistance. François Gastine, Pascale Héliot and Christian
Banet have ensured technical support to this project. The English ver-
sion was revised by Vicky Despres.
REFERENCES
[1] Alder D., A distance-independent tree model for exotic conifer plan-
tations in East Africa, For. Sci. 25 (1979) 59–71.
[2] Bailly A., Bigot M., Permingeat J., Modélisation de la croissance et
autres sylviculture du Douglas, Report for the project DERF
01.40.05/96, AFOCEL Centre-Ouest, 1997, 88 p.
[3] Biging G.S., Dobbertin M., Evaluation of competition indices in
individual tree growth models, For. Sci. 41 (1995) 360–377.
[4] Calama R., Canadas N., Montero G., Inter-regional variability in site
index models for even-aged stands of stone pine (Pinus pinea L.) in
Spain, Ann. For. Sci. 60 (2003) 259–269.
[5] Deleuze C., Blaudez D., Hervé J.C., Ajustement d’un modèle hau-
teur-circonférence pour l’épicéa commun. Effet de la densité, Ann.
Sci. For. 53 (1996) 93–111.
[6] Delvaux J., Différentiation sociale, Schweiz. Z. Forstwes. 132
(1981) 733–749.
[7] Dhôte J.F., Modèles de la dynamique des peuplements forestiers :
articulation entre les niveaux de l’arbre et du peuplement. Applica-
tion à la sylviculture des hêtraies, Thèse de Doctorat, Université
Claude Bernard Lyon 1, 1990, 256 p.
[8] Dhôte J.F., Modélisation de la croissance des peuplements réguliers
de hêtre : dynamique des hiérarchies sociales et facteurs de produc-
tion, Ann. Sci. For. 48 (1991) 389–416.
[9] Gourlet-Fleury S., Modélisation individuelle spatialement explicite
de la dynamique d’un peuplement de forêt dense tropicale humide,
Thèse, Université Claude Bernard Lyon 1, 1997, 274 p.
[10] Houllier F., Bouchon J., Birot Y., Modélisation de la dynamique des
peuplements forestiers : état et perspectives, Rev. For. Fr. 2 (1991)
87–108.
[11] Najar M., Un nouveau modèle de croissance pour le pin maritime,
Fiche Informations-Forêt 597, 1999, 6 p.
[12] Pain O., Modélisation de la croissance de l’épicéa commun, Report
for the project DERF 01.40.02/94, AFOCEL Nord-Est, 1996, 52 p.
[13] Pain O., OASIS : le logiciel de sylviculture pratique, de la plantation
à la coupe rase, Fiche Informations-Forêts, AFOCEL, n° 552, 1997, 6 p.
[14] Pain O., Boyer E., A whole individual tree growth model for Norway
spruce, in: Proceedings of the second Workshop “Connection
between silviculture and wood quality through modelling approaches
and simulation software”, South Africa, August, 1996, pp. 13–23.
[15] Palahi M., Pukkala T., Miina J., Montero G., Individual-tree growth
and mortality models for Scots pine (Pinus sylvestris L.) in north-
east Spain, Ann. For. Sci. 60 (2003) 1–10.
[16] Wimberly M.C., Bare B.B., Distance-dependent and distance-inde-
pendent models of Douglas-fir and western hemlock basal area
growth following silvicultural treatment, For. Ecol. Manage. 89
(1996) 1–11.
[17] Zhang S., Burkhart H.E., Amateis R.L., Modelling individual tree
growth for juvenile loblolly pine plantations, For. Ecol. Manage. 89
(1996) 157–172.
To access this journal online:
www.edpsciences.org