Báo cáo lâm nghiệp: ": Climate-tree-growth relationships of Quercus petraea Mill. stand in the Forest of Bercé (“Futaie des Clos”, Sarthe, France)" docx
Bạn đang xem bản rút gọn của tài liệu. Xem và tải ngay bản đầy đủ của tài liệu tại đây (696.72 KB, 12 trang )
361
Ann. For. Sci. 61 (2004) 361–372
© INRA, EDP Sciences, 2004
DOI: 10.1051/forest:2004029
Original article
Climate-tree-growth relationships of Quercus petraea Mill.
stand in the Forest of Bercé (“Futaie des Clos”, Sarthe, France)
François LEBOURGEOIS
a
*, Guillaume COUSSEAU
b
, Yves DUCOS
b
a
Unité Mixte de Recherche INRA-ENGREF 1092, Laboratoire d’Étude des Ressources, Forêt-Bois,
Équipe Écosystèmes Forestiers et Dynamique du Paysage, ENGREF, 54042 Nancy Cedex, France
b
Office National des Forêts, Service départemental du Loiret (45), France
(Received 25 March 2003; accepted 20 August 2003)
Abstract – The past history of a 300-year-old Quercus petraea stand (the “Futaie des Clos”, 8 ha) located 20 km from the town of Le Mans in
the Forest of Bercé in the western part of France (Sarthe) was analysed by a dendroecological approach. According to the number of healthy
trees alive (> 400), the stand age (> 300 years), and the dimensions of the trees (dia: 92 cm; height: 45.2 m), this plot constitutes one of the most
remarkable oak grove in France. High competition pressure between trees appeared to be the most important factor to explain the high-quality
timber (high straight stems without wood defaults, narrow regular rings). After an initial 90-year period of decrease, this stand shows a
1mm·year
–1
growth increment from the 1810s to the present. The growth increase of 40–50% occurring for over than 20 years can be
interpreted as a response to the increase of harvesting intensity. The influence of climate was evaluated by comparing earlywood, latewood and
total ring indices with monthly climatic data collected at Le Mans over the period 1921–2001. Extreme growth years coincided with wet or dry
springs (May–June) (± 40% of rainfall in relation to normal conditions) often associated with warm or fresh July. The climatic models
accounted for between 18 and 26% of the variability of ring widths, and suggested that earlywood formation depended mainly on previous
autumn hydric balance and winter temperature whereas the growth of the latewood band was maximum in early spring (positive effect of May
hydric balance). The ecophysiological interpretations of the climatic correlations are discussed.
dendroclimatology / tree ring / radial growth / climate / response function / Quercus petraea / long term chronology / pointer years
Résumé – Dendroclimatologie du chêne sessile (Quercus petraea Mill.) en forêt de Bercé (“Futais des Clos”, Sarthe, France). Une étude
dendroécologique a été entreprise afin d’analyser l’évolution de la croissance radiale d’un peuplement âgé de chêne sessile (Quercus petraea
Mill.) (la Futaie des Clos) localisé dans la forêt de Bercé à 20 km du Mans (Sarthe – France). En raison du nombre d’arbres présents (plus de
400 sur les 8 ha), de leur âge (> 300 ans en 2001) et de leur dimension (diamètre et hauteur moyens : 92 cm et 45,2 m), ce peuplement constitue
une des plus remarquables chênaie sessiliflore de France. La sylviculture peu intensive pratiquée dans le peuplement explique en grande partie
la très grande qualité des arbres (tronc très droit sans défaut, cernes fins réguliers). Après une période de décroissance de 90 ans, la largeur
moyenne des cernes est d’environ 1 mm par an depuis 1810. L’augmentation de croissance observée depuis une vingtaine d’années (1980–2001)
peut être interprétée comme l’expression de l’augmentation de l’intensité des éclaircies (diminution de la compétition entre les arbres). L’effet
du climat a été analysé en comparant les variations du bois initial, du bois final et du cerne complet aux données climatiques du Mans sur la
période 1921–2001. Les années de croissance extrêmes (années « caractéristiques ») coïncident avec des printemps pluvieux ou secs (mai–juin)
(± 40 % de pluies par rapport aux conditions normales) souvent associés avec un mois de juillet frais ou très chaud. Les modèles climatiques
expliquent entre 18 et 26 % de la variabilité des largeurs des cernes et suggèrent que la formation du bois initial dépend essentiellement du bilan
hydrique de l’automne précédent et des températures hivernales alors que le bois final est fortement influencé par le bilan hydrique du printemps
(rôle essentiel du mois de mai). Les interprétations écophysiologiques des corrélations climatiques sont discutées.
dendroclimatologie / cerne / croissance radiale / climat / fonctions de réponse / Quercus petraea / années caractéristiques
1. INTRODUCTION
Sessile oak (Quercus petraea L.) is one of the main tree species
in France, both in terms of surface area and economic value.
Sessile oak stands are mainly managed in high forests and regu-
larly thinned to improve growth of selected trees. The harvest
occurs mainly between 170 to 200 years [25]. The Forest of Bercé,
which covers 5 380 ha in the western part of France (Sarthe), is
well known for the production of high-quality sessile oak timber
[12]. Among the different oak stands of this forest, “la Futaie des
Clos”, which covers 8 ha, has caught the attention of the foresters
for many years [50]. Because of the particular characteristics of
* Corresponding author:
362 F. Lebourgeois et al.
oak trees (high straight stems with diameters often above 90 cm),
this plot is often considered as a “remarkable oak grove” [50].
However, a detailed survey of this site, especially of growth
dynamic, has not been done yet. Thus, the coupling of old forest
management plans analysis, dendroecology and climatic data
should provide an improved understanding of past stand history.
The objectives of this study were (1) to define the characteristics
of this oak stand (age, growth rate, growth fluctuation), and (2) to
ascertain the relationships between climate and total ring, early-
and latewood radial growth. Such a study will allow to precise the
time of the transition phase between both components and to partly
assess the effect of climate on wood quality. The most prominent
climatic factors affecting tree growth were identified (1) by dis-
tinguishing “pointer years”, which correspond to abrupt changes
in growth pattern and reveal the tree-growth response to extreme
climatic events [46–48] and (2) by establishing the mean relation-
ships between tree ring and climate through simple correlations
and response-function analysis [18, 19].
2. MATERIALS AND METHODS
2.1. Study site
The “Futaie des Clos” is located 20 km from the town of Le Mans,
included in the Forest of Bercé (5 380 ha – Sarthe). The “Futaie des
Clos” has an area of 8 ha, and is located on a plateau, with an altitude
below 100 m asl. Forest ecological type was identified using ground
vegetation and soil description and chemical analysis [12]. The soil is
deep sandy-loam to loam-clay brown earths, with parent material of
flint clay formed in the Turonian. Soil is relatively acidic and poor
(pH = 4.2 and C/N = 18.2 in the first mineral horizon). The maximum
extractable soil water was calculated from simple soil profile obser-
vations: depth of each soil horizon, texture, percentage of stones and
rooting patterns. Soil water reserve averages 150 mm on a depth of
1 m which corresponds to a relatively wet site. From the phytosocio-
logical point of view, the study site belongs to Quercion robori-
petraea alliance. The station type is defined as an acidicline oak grove
of plateau and corresponds to a good class of fertility [25].
Mature sessile oak (Quercus petraea L.) is the dominant tree spe-
cies in the forest canopy and European beeches (Fagus sylvatica L.)
are present under the dominant oaks. For several centuries up to late
1800s, the “Futaie des Clos” was managed by the French Forest Office.
The forest management plan of 1843 planned the regeneration of oaks
between 1903 and 1933. In 1895, due to the high quality of the oak
wood [50], it was decided to preserve this remarkable stand. The “offi-
cial” protection of the “Futaie des Clos” dates from 1930 following
the creation of the “artistic parcels” at the national scale [50].
Oak is managed in high forest and seven inventories was available
from the period 1888–2001 (Tab. I). At each date, mean diameter,
stand basal area, total stand volume and stand density were calculated
[12]. To define the competition pressure, the Relative Density Index
(RDI) was calculated. This index takes into account the mean quad-
ratic circumference (Dg) and the stand density (N). The formulae is:
RDI = N × Dg^1.701/171582. The value leads to zero when the com-
petition pressure between trees is low. Values around 1 correspond to
maximal competition pressure [15, 16].
2.2. Climatic records
Climatic data were used from the meteorological station of Le
Mans (47° 56’ 49.3’’ N, 00° 11’ 40.5’’ W) located at 51 m above sea
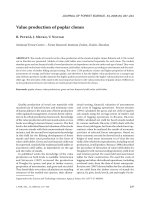
level, 20 km from the study site. For the period 1961–1990, the mean
annual precipitation was 678 mm and the number of rainy days aver-
aged 170 (Tab. II and Fig. 1). The annual temperature averaged
11.1 °C, 6.6 °C and 15.6 °C for mean, minimum and maximum tem-
perature respectively. Snow-covered winters and late frosts in spring
were rare. The growing season rainfall (May to September) averaged
255 mm with 60% of rainless days and 26% of days with a maximum
temperature above 25 °C.
2.3. Sampling, measurements, and computation
of chronologies
Because of the exceptional quality of the timber and the high com-
mercial value of the trees, only 18 dominant oaks were bored to the
pith at 0.50 cm (one core per tree) and measured (diameter at breast
height over bark). The 5 483 rings were measured microscopically for
earlywood, latewood and total ring width to the nearest 0.01 mm using
a digitizing tablet connected to a micro-computer and the tree-ring pro-
gram SAISIE (Becker, unpublished). Early- and latewood transitions
Table I. Evolution of the characteristics of the “Futaie des Clos” oak stand between 1888 and 2001. G: stand basal area (m
2
/ha); Dg: quadratic
mean diameter (at 1.30 cm). TSV: total stand volume over bark (m
3
/ha). The mean height was estimated from measurements of 81 dominant
oaks. RDI: Relative Density Index. Between 1888 and 1986, the stand age and the mean ring width were estimated according to the characte-
ristics of the trees cored in 2001 (see text for details).
Year of inventory 1888 1895 1929 1947 1957 1986 2001
Stand age (years at 50 cm) 192 200 235 254 265 295 311
Nb of oak/ha 166 164 109 105 100 63 53
G (m
2
/ha) 46.7 49.6 43.8 45.8 46 32.8 35.2
Dg (cm) 60 62 72 75 77 81 92
TSV (m
3
/ha) 838 888 776 807 808 573 574
Mean tree volume (m
3
) 5 5.4 7.1 7.7 8.1 9.1 10.9
Mean height (m) – – – – – – 45.2
RDI 1.02 1.07 0.92 0.95 0.94 0.64 0.67
Mean ring width (mm) 0.76 0.79 0.94 0.92 0.83 1.22 1.19
Dendroclimatology of Quercus petraea 363
within the annual rings were defined according to qualitative aspects.
Earlywood is of low density, because of a high proportion of large ves-
sels, whereas latewood, which is made small vessels and fibres, is of
high density [53, 54]. To reduce bias in the tree-ring measurements,
early- and latewood data were collected by only one person. The indi-
vidual ring-width series were crossdated after progressively detecting
regional pointer years. When growing conditions are less favourable,
the annual ring is narrower than normal and is commonly narrow for
most trees falling under the influence of this environmental factor [43,
46–48]. The pointer years were defined for each ring component as
those calendar years when at least 75% of the rings were at least 10%
narrower or wider than the previous year. Thus, each pointer year was
expressed as a relative growth changes in % [2, 30]. Absolute dating
was checked by program COFECHA [24] which identifies all loca-
tions within each ring series that may have erroneous cross-dating. Cli-
matic factors acting on pointer years were analysed for the period
1921–2001.
For each tree, ring characteristics were calculated from the com-
mon period 1715–2001 (287 years). The mean sensitivity (MS) is a
measure of year-to-year variability and the first order-autocorrelation
coefficient (AC) assesses the influence of the previous year’s growth
upon the current year’s growth [18]. Series intercorrelation was esti-
mated according to formulae given in Briffa and Jones [7]. The sta-
tistics of expressed population signal (EPS) and signal-to-noise ratio
(S/N ratio) are calculated to quantify the degree to which the chronol-
ogy signal is expressed when series are averaged. Both parameters are
an expression of the strength of the observed common signal among
trees [52]. Though a specific range of EPS values which constitutes
acceptable statistical quality cannot be given, Wigley et al. [52] sug-
gest a threshold of 0.85 as reasonable. The signal-to-noise ratio (SNR)
is defined as SNR = N r/(1 – r) where r is the average correlation
between trees and N is the number of trees within a site chronology.
The raw ring-widths were standardized by means of a two-step pro-
cedure using the program ARSTAN [24]: the series were first fit to a
negative exponential or straight line and then to a cubic smoothing
spline with a 50% frequency response of 50 years, which is flexible
enough to reduce considerably non-climatic variance [11, 44]. Autore-
gressive modeling of the residuals and biweight robust estimation of
the mean were used to calculate chronology indices for each ring com-
ponent [11, 44]. These master chronologies were used to evaluate the
radial growth-climate relationships.
2.4. Dendroclimatological analysis
Monthly averaged minimum (T
min
) and maximum (T
max
) temper-
atures (°C), monthly sums of precipitation (mm) and hydric balance
Figure 1. Climatic diagram for Le Mans (47° 56’ 49.3’’ N, 00° 11’ 40.5’’ W, 51 m). Mean monthly temperatures (°C; line) and precipitations
(mm; bars) were calculated for the period 1961–1990. MAP, MGSP, MAT and MGST = Mean Annual or Growing Season (May to September)
Precipitation and Temperature.
Table II. Mean climatic conditions in Le Mans (47° 56’ 49.3’’ N, 00° 11’ 40.5’’ W, 51 m). Means were calculated for the period 1961–1990.
GS: growing season (May to September, 153 days).
Jan. Feb. Mar. Apr. May June July Aug. Sept. Oct. Nov. Dec. Year GS
Nb of days with P > 0 mm 17 15 16 14 16 12 11 11 11 14 17 16 170 61
T
min
(°C) 1.2 1.5 2.8 4.9 8.2 11.3 13.1 12.6 10.5 7.6 3.8 1.9 6.6 11.1
T
max
(°C) 7.1 8.5 11.6 14.7 18.4 22.0 24.5 24.0 21.5 16.6 10.8 7.7 15.6 22.1
Nb of days with T
min
< 0 °C 12 10 9 3 1 2 7 11 55 1
Nb of days with T
max
> 25 °C 2 3 7 13 11 6 2 44 40
364 F. Lebourgeois et al.
(BH = P–ETP) from the period 1921–2001 were used as explanatory
variables. ETP was calculated using Turc’s formula; it has the advan-
tage of taking into account only temperature, global radiation and aver-
age day length, which are the data available for the whole period
(1921–2001). BH is a monthly synthetic variable, positive or negative,
that is related to soil moisture variations [2]. Climatic parameters were
considered from October of the previous year to September of the cur-
rent year. For each ring component, the effect of climate on growth
was investigated in three steps. First, pointer years were compared
with climatic data. Second, simple correlation analyses were per-
formed for the whole period 1921–2001 between monthly climatic
data arranged as previously defined and the master index chronologies.
Third, bootstrapped response functions were calculated using the 24
monthly climatic parameters as regressors and the mean chronologies
as a dependent variable [20]. For each ring component, four response
functions were established taking into account as predictors the
(P-T
min
), (P-T
max
), (BH-T
min
) and (BH-T
max
) combinations [49]. The
bootstrap procedure provides an interesting method to simultaneously
test the regression coefficients and the stability of the response func-
tion. The idea is to replace the lack of information on the statistical
properties of the data by a great number of estimates, each based on
different subsamples of data [20, 34, 49]. The comparison of these esti-
mates shows the variability of the estimates. The subsampling is done
by random extraction with replacement from the initial data set. The
size of each subsample is the same as that of the initial data set (n =81
in our study) to avoid bias. Each subsample forms a bootstrap test use-
ful for cross-validation. For each pseudo-data set, the regression coef-
ficients and the multiple correlation are computed on the observations
randomly selected (calibration years). Some observations of the initial
data set are used repeatedly while others are omitted. The verification
years are those that are omitted from the subsample. Repeated
200 times, this procedure yields 200 sets of regression coefficients,
200 multiple correlations, and 200 independent verification correla-
tions. A mean regression coefficients set with standard deviations is
computed on these 200 estimates. Means (R) and standard deviations
(S) are also computed for the multiple correlation and the independent
correlation sets. The R value and the R/S ratio for the verification years
give an estimation of each bootstrapped regression coefficient. When
the ratio ranges from 1.65–1.95, 1.96–2.57, 2.58–3.29 and > 3.29 the
significance of the corresponding regression coefficients reaches 90%,
95%, 99%, 99.9% of probability respectively [20, 34, 49].
3. RESULTS
3.1. Stand characteristics
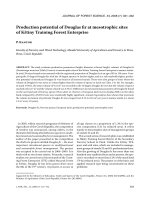
In 2001, oak trees represented more than 75% of the total
stand basal area (Tab. I and Fig. 2). Stand density was 53 oaks/
ha and stand basal area averaged 35.2 m
2
/ha. The total stand
volume over bark was 574 m
3
/ha. Oak tree diameters ranged
from 0.50 to 1.60 m and more than 30% of the trees presented
a diameter over bark (at 1.30 m) above 100 cm (Fig. 2). Trunks
were straight with a mean height without branches of 23 m. The
total tree volume ranged from 3.5 to 15 m
3
and averaged
10.9 m
3
. According to the ages of cored oaks (Tab. III), it might
be suggested that the current stand age ranged between 300 and
330 years. Frost crack was observed for only 8% of the trees.
According to the standard sylvicultural practices defined for
sessile oak [25], this stand appeared very dense. The forest
management plan of 1888 (Tab. I) indicated a mean diameter
of 60 cm for a stand density of 166 trees/ha. For a similar range
of ages (190–200 years), the standard sylviculture recom-
mended a stand density of 80 trees/ha for a mean diameter of
75 cm [25]. Sylvicultural interventions have been effectively
scarce before the 1900s [12, 50] causing a high competition
pressure between trees throughout their life (high values of RDI)
(Tab. I). From the 1900s up to now, the growing conditions of
the trees have varied. Between 1920 and 1929 a total amount
of about 1 500 m
3
of wood was harvested (190–200 m
3
per ha).
Between 1929 and 1947, only the dead trees were harvested.
The forest management plan of 1957 followed by the harvesting
of the storm damage of 1967, 1968 and 1990 (1700–2000 m
3
)
resulted in an important decrease of stand oak density (–40%)
causing a lower competition pressure (RDI values below 0.7)
and a rapid development of beech. Between 1947 and 1986, the
number of beech stems was multiplied by 6.5 (16 to 103 stems/
ha). In 2001, diameters below 30 cm represented more than
60% of the beech stems (Fig. 2).
Figure 2. Number of oak and beech trees in 1888 (first available inventory) and 2001 (last inventory) in the “Futaie des Clos” according to the
diameter classes (in cm at 1.30 cm). The indicated values correspond to the highest diameters of the classes (example: 0.6 = 0.55–0.6).
Dendroclimatology of Quercus petraea 365
3.2. Ring characteristics of cored oaks
The age of cored trees ranged from 288 to 326 years in 2001
(Tab. III). Sapwood width averaged 34 mm with a mean num-
ber of sapwood rings of 31 which was consistent with previous
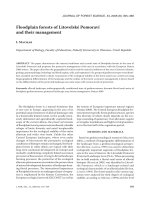
observed values of this species [31]. Total ring, earlywood and
latewood ring-widths averaged 0.97, 0.42 and 0.55 mm, res-
pectively. As previously known [14, 22, 53, 54], latewood pro-
portion ranged from 80 to 50% of total ring width according to
cambial age (between 10 and 320 years) (Fig. 3) and there was
a strong positive correlation between the total tree-ring width
and latewood width (r
2
= 97%). The latewood width mainly
determined the total tree-ring width and the earlywood is more
constant in time. For the period 1715–2001, mean sensitivity
(MS) of total ring width ranged from 0.176 to 0.265 (mean
value: 0.213) (Tab. III). The higher MS values suggested that
latewood was more sensitive to climate than earlywood. EPS-
values exceeded the suggested threshold of 0.85 suggesting a
strong climate signal in each chronology. Lower EPS and S/N
values in earlywood suggested that the climate signal chrono-
logies is lower in this ring component. There was also a high
correlation between current earlywood widths and previous
latewood widths (r
2
= 25.8%; p < 0.001).
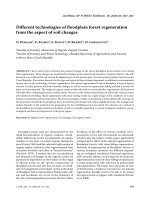
Total ring and latewood ring-width chronologies exhibited
a similar growth pattern (Fig. 4). After an initial decrease
during 90 years (age-related trend), both chronologies showed
a long period of relative stability (1810–1910) followed by a
slow increase from the 1910s to the present. For both chrono-
logies, a more pronounced growth increase occured after the
1980s. Earlywood growth pattern appeared different with a sta-
ble initial growth, but also a slow increase from the beginning
of the 20th century. Between 1910 and 2001, ring-width has
increased of about 50%. The growth pattern of the sampled
trees was in agreement with the stand growing conditions, espe-
cially from the 1900s to the present. Thus, the increase of tree
ring widths during the last century was closely linked to
decreasing competition (Tab. I).
3.3. Pointer years
For the period 1715–2001 (287 years), a total of 60 years
were defined as pointer years, either for total ring, earlywood
or latewood. A total of 24 corresponded to low-growth years
and 36 to high-growth years (Tab. IV).
A total of 33 pointer years were defined for total ring (20 positive
years). The frequency of pointer years was significantly higher
Table III. Tree-ring characteristics of the18 sessile oak trees. Diameter was measured at breast height over bark (cm). TRW, EWW, LWW:
total ring, earlywood and latewood tree-ring widths (mean and standard deviation). MS and AC: mean sensitivity and first-order autocorrela-
tion coefficient of the ring widths. SW: sapwood width (mm). NSR: number of sapwood rings. WS: mean tree-ring width in the sapwood.
r: series intercorrelation. EPS: expressed population signal. SNR: signal-to-noise ratio. The ring characteristics were calculated for the com-
mon period 1715–2001 (287 years) on the unfiltered series.
Total ring Earlywood Latewood Sapwood
r: 0.453 EPS: 0.937 SNR: 14.9 r: 0.292 EPS: 0.881 SNR: 7.42 r: 0.422 EPS: 0.929 SNR: 13.1
Dia. Age TR
W
std Min Max MS AC EW
W
Std Min Max MS AC LW
W
Std Min Max MS AC S
W
N
SR
W
S
Std
96.1 300 1.03 0.27 0.40 2.14 0.209 0.42 0.52 0.16 0.23 1.11 0.229 0.55 0.51 0.23 0.05 1.63 0.360 0.39 67.1 62 1.08 0.24
82.8 311 0.93 0.38 0.34 2.30 0.183 0.83 0.45 0.12 0.21 0.80 0.227 0.44 0.48 0.31 0.05 1.82 0.297 0.83 33.3 35 0.95 0.25
83.4 308 0.93 0.35 0.30 2.53 0.176 0.77 0.50 0.16 0.16 1.20 0.215 0.57 0.43 0.25 0.11 1.41 0.286 0.75 31.7 20 1.59 0.46
86.9 288 1.07 0.43 0.31 2.67 0.228 0.72 0.46 0.14 0.18 0.91 0.247 0.49 0.61 0.35 0.10 1.99 0.335 0.67 35.8 22 1.63 0.45
73.5 315 0.95 0.40 0.25 2.50 0.211 0.75 0.40 0.13 0.13 0.77 0.239 0.58 0.55 0.32 0.11 1.97 0.321 0.65 27.4 41 0.67 0.15
78.9 317 1.01 0.41 0.32 3.63 0.226 0.67 0.38 0.13 0.12 0.95 0.260 0.56 0.63 0.34 0.07 2.89 0.328 0.60 48.2 36 1.34 0.41
80.5 288 1.20 0.57 0.37 3.63 0.256 0.76 0.49 0.16 0.12 1.20 0.238 0.60 0.70 0.46 0.13 2.82 0.382 0.69 42.5 37 1.15 0.37
77.0 311 0.99 0.35 0.28 2.30 0.213 0.7 0.43 0.12 0.13 0.75 0.235 0.42 0.56 0.28 0.10 1.63 0.299 0.68 28.5 25 1.14 0.30
75.1 320 0.73 0.32 0.20 1.81 0.265 0.67 0.27 0.07 0.11 0.51 0.235 0.36 0.46 0.27 0.05 1.47 0.366 0.67 22.9 36 0.64 0.20
81.5 326 0.99 0.42 0.22 2.63 0.207 0.8 0.42 0.16 0.12 0.96 0.227 0.72 0.57 0.30 0.04 1.99 0.309 0.73 33.1 24 1.38 0.33
75.4 320 0.86 0.45 0.26 2.82 0.255 0.74 0.35 0.12 0.15 0.90 0.250 0.56 0.52 0.36 0.06 2.02 0.349 0.72 20.8 35 0.59 0.21
89.8 308 1.04 0.48 0.33 2.81 0.225 0.77 0.42 0.15 0.13 0.83 0.247 0.62 0.61 0.38 0.10 2.09 0.326 0.74 37.6 32 1.17 0.41
82.4 308 0.92 0.47 0.36 2.82 0.196 0.81 0.41 0.14 0.16 0.86 0.219 0.62 0.51 0.38 0.11 2.24 0.294 0.76 37.9 27 1.41 0.53
74.8 315 0.86 0.38 0.20 2.76 0.177 0.86 0.37 0.12 0.1 0.79 0.222 0.62 0.49 0.29 0.08 2.08 0.274 0.82 19.9 21 0.95 0.14
77.0 326 1.08 0.49 0.48 3.20 0.201 0.79 0.45 0.15 0.19 1.29 0.224 0.53 0.63 0.40 0.17 2.41 0.308 0.76 22.9 20 1.14 0.20
86.6 311 1.02 0.48 0.33 2.89 0.219 0.79 0.42 0.13 0.17 0.98 0.260 0.38 0.61 0.41 0.09 2.36 0.326 0.76 19.8 27 0.73 0.17
69.7 321 0.92 0.36 0.30 2.74 0.186 0.73 0.46 0.16 0.15 1.04 0.250 0.57 0.46 0.26 0.12 1.83 0.310 0.65 52.7 36 1.46 0.44
67.2 300 0.97 0.38 0.35 3.08 0.199 0.74 0.44 0.14 0.19 0.97 0.234 0.53 0.52 0.28 0.09 2.11 0.306 0.69 30.4 22 1.38 0.54
366 F. Lebourgeois et al.
Figure 4. Raw tree-ring ring mean chronologies for total ring, earlywood and latewood from the “Futaie des Clos”. Thin line represents a
10-year running average. The number of trees per year is 18 (period 1715–2001; 287 years).
Figure 3. Earlywood (dotted line) and latewood width (solid line) in relation to cambial age. For each ring, the cambial age corresponds to the
age of the tree when the ring was formed (period 1690–2001). After 100 years, LW/TR ratio is relatively stable around 51%.
Dendroclimatology of Quercus petraea 367
for latewood (46 years) than for earlywood (16 years). The
negative years 1996, 1906 and the high-growth years 1983,
1967 and 1743 appeared for each ring component. There were
many points of agreement between total ring and latewood
whereas earlywood component reacted more individually.
Among the 33 pointer years defined in total ring, only 2 did not
appeared in latewood (1870 and 1778). For earlywood, 11 of
the 16 pointer years appeared only in this ring component.
There were three relatively long periods when no signature
years occured: 1715–1739; 1790–1819; 1830–1869. From the
1930s to the present, at least one pointer year was observed for
each decade (1 to 5; mean: 2.4/10 years). The recent period
1990–2001was characterized by the highest number of pointer
years (n =5).
There were many points of agreement between latewood
pointer years and extreme spring precipitation and maximum
July temperature (Fig. 5). Thus, 9 of the 12 low-growth years
were characterized by both spring drought (P < 60 mm) and
warm summer (+0.5 to +4.5 °C above normal conditions). By
contrast, the positive pointer years often corresponded to the
“coldest” summers. This was particularly true for the four posi-
tive years 1936, 1978, 1993 and 1958 characterized by a very
wet spring (P > 120 mm) and “fresh” summer (–2.5 °C below
normal value). The similar pattern was observed for total ring
(data not shown). The growth depression centred on the negative
pointer year 1934 was not correlated to exceptional weather
conditions, but was a consequence of an important defoliation
caused by an oak defoliating caterpillar during the two conse-
cutive years 1933–1934 [12].
The low number of earlywood pointer years (only 9 for the
period 1921–2001) made climatic analysis difficult. High mini-
mum temperature in September and low maximal temperature
values in Spring seemed to play a major role in producing ear-
lywood signature years (data not shown).
3.4. Simple correlations and response functions
analysis
For total ring and latewood, correlations between growth
and climate appeared slightly higher when hydric balances
(BH) and minimal temperatures (T
min
) were taken into account
as predictors. Correlations with maximal temperatures were
never significant excepted for July in latewood (r = –0.220;
p = 0.048). For both components, simple correlations and res-
ponse function analysis appeared consistent and showed that
each chronology was more closely correlated to hydric balance
than temperature (Fig. 6). Climatic models found four months
to be significant. Previous October hydric balance, current May
hydric balance and minimal May temperature entered in both
models with positive regression coefficients. For both ring
component, the highest correlation was observed for current
May hydric balance (r = 0.301 and 0.363 for total ring and
latewood, respectively; p < 0.001). Total ring also showed a
positive association with previous November hydric balance.
The positive effect of current June hydric balance was also
significant for the latewood growth. The percentage of the cli-
matic variance accounted for by total ring and latewood chro-
nologies was 21.4% and 25.1%, respectively (Fig. 7).
The response function obtained for earlywood series was
different and the percentage variance explained was weaker
Table IV. Calendar years characterized by a strong relative decrease
(negative pointer years) or increase (positive pointer years) in radial
growth for each ring component. TR: total ring; EW: earlywood;
LW: latewood. The years refer to a strong relative increase or decrease
(> 10%) found in at least 75% of the 18 crossdated trees (period
1715–2001).
Negative pointer years (relative decrease in %)
Year TR EW LW Year TR EW LW
1996 –27 –18 –33 1915 –22 –31
1995 –22 –29 1906 –26 –23 –26
1989 –30 –41 1892 –18
1985 –22 1887 –26
1984 –11 1883 –22
1976 –31 1870 –23
1968 –26 –31 1824 –25
1959 –23 –34 1784 –32
1956 –25 –28 1778 –16
1952 -16 1755 –20 –20
1944 –17 –23 1722 –16
1934 –29 –40
1921 –22
Total 13 4 20
Positive pointer years (relative increase in %)
Year TR EW LW Year TR EW LW
1998 30 1897 31
1997 32 73 1894 20 41
1994 28 41 1882 109
1993 26 59 1881 32
1991 45 1865 25
1988 37 68 1848 44
1983 32 35 34 1829 30 41
1978 40 91 1821 28 39
1973 41 1789 27 46
1967 28 22 46 1787 23 40
1958 52 104 1786 39
1937 32 1783 59
1936 47 169 1769 26
1931 25 1768 36 63
1924 18 1763 26
1916 47 1756 56 94
1917 34 1747 28 38
1907 38 58 1743 32 25 49
Total 20 12 26
368 F. Lebourgeois et al.
(r
2
= 18.2%). The effect of temperature became more pro-
nounced (Fig. 6). The influence of previous autumn weather
conditions increased: positive influence of both October-
November hydric balance and minimal November tempera-
ture. The current hydric balance influence shifted to late winter
(March) instead of spring (May–June) in the case of total or
latewood (Fig. 6). In addition, minimum January and August
temperatures negatively influenced earlywood growth. For
January and March, a negative influence of maximum tempe-
rature was also observed at the 95% and 90% level, respecti-
vely. Adding the previous latewood indices to the regressors
resulted in a significant increase in the global significance of
response function. The response function included 4 regressors:
previous latewood indice (positive effect; +), previous Novem-
ber hydric balance (+), minimum temperature in January (–)
and August (–). This model explained 25.7% of the variance.
For total ring and latewood series, response functions were
similar when ring parameters were involved in the calculation.
4. DISCUSSION
According to the number of healthy trees alive (more than
400 on the 8 ha), the stand age (> 300 years), the dimensions
of the trees (dia: 92 cm; height: 45.2 m), indeed the “Futaie des
Clos” constitutes a remarkable oak grove [9, 36]. The range of
observed ages suggests that the regeneration of this stand star-
ted before 1700. High stand density and high competition pres-
sure between trees appear to be the most important factor to
explain the formation and the quality of this stand (high straight
stems without wood defaults, narrow regular rings). After an
initial 90-year period of decrease, this stand shows a 1 mm·year
–1
growth increment from the 1810s to the present. The growth
increase of 40–50% occuring for over than 20 years can be
interpreted as a response to the decrease of stand oak density.
The high harvesting intensity has created canopy gaps and has
stimulated a pulse beech establishment. The oak ring width is
usually considered as a good indicator of wood quality because
wood properties (density, shrinkage, machinability…) are clo-
sely correlated with ring widths [39–41]. Thus, wide rings
(> 1.5–2 mm) correspond to denser wood which is less favou-
rable to veneer production (the main use of oak wood) because
denser wood in this species is associated with higher shrinkage
and machinability [14, 53, 54]. Thus, from this point of view,
this oak grove can be considered as a high quality stand for
veneer production.
The calculation of response functions provides readily
accessible information about the dominant mode of linear res-
ponse between tree-ring and climate variables of many years.
Thus, response function analysis allowed us to determine the
common mesoclimatic factor which makes the series compa-
rable with each other [18, 19]. As a disadvantage, however, res-
ponse functions and also correlation analysis are unable to render
evidence about less frequent and time-dependent growth limi-
ting factors. The pointer years analysis provides information on
an individual year basis and can be considered as a supplement
to the calculation of linear regression models [43, 48]. The com-
bination of these different procedures gives the most compre-
hensive dendroclimatological information [30]. In this study,
the three methods clearly showed that the radial growth of old
sessile oak trees, growing at low elevation on acidic soil in the
Forest of Bercé, is mainly controlled by current spring hydric
balance and previous autumn conditions. A deficient water
balance negatively influences annual growth as a result of low
precipitation and high temperature. Climatic models reflect
only between 18–26% of the variance. To explain this relatively
weak response of global growth to climate, it might be sugges-
ted that the environmental conditions in the forest under study
are usually not restrictive for tree growth: low altitude and tem-
perate climate associated with deep soil. For the later point, soil
water reserve is estimated to 150 mm on a depth of 1 m. Because
of the high capacity of soil prospection by the roots of oak spe-
cies [4, 5, 33], it may be suggested that rooting depth is superior
to 1 m which increases the maximum extractable soil water
reserve and leads to minimize the effects of drought. It might
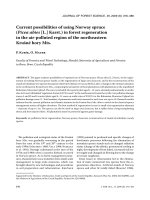
Figure 5. Correlation between the 22 latewood pointer years observed for the period 1921–2001 and spring precipitations (May–June, in mm).
The values in brackets correspond to the mean maximum July temperature (°C) (Average maximum July temperature: 24.8 °C). Each pointer
year is expressed as a relative growth change in % (see text for details).
Dendroclimatology of Quercus petraea 369
be also suggested that the oak growth on this site is too “com-
plex” to be explained only by monthly climatic parameters. A
stronger correlation can probably be achieved by using daily
climatic data grouped into periods of different lengths [5, 17,
29]. Even if low, the percentage of explained variance is within
the usual range in other Europe localities [5, 8, 27, 35, 38, 44,
49].
The same clear pattern for spring weather conditions is vis-
ible for extreme years which result from extreme May–June
precipitations. Thus, the majority of pointer years coincides
with dry or wet spring (+40% or –40% of rainfall in relation to
mean conditions) often associated with warm or fresh July. This
type of relation, however, cannot always be found. For exam-
ple, the years 1949 and 1962 were expected to be negative
pointer years, due to severe droughts, but this was not the case.
These years present narrow rings (Fig. 4) but the calculation of
the relative growth change shows that the different thresholds
fixed by the method were not attained (data not shown). A sim-
ilar remark can be done for the rainy years 1950 and 1951.
These years present wide rings but there are not defined as
pointer years because only 50% of the trees present the same
positive change of growth.
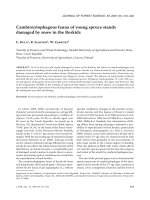
Figure 6. Simple Pearson’s correlation (r) coefficients (bars) and response function coefficients (lines) for monthly minimum temperature and
hydric balance (P-ETP) from previous October to current September for each ring component (period 1921–2001; n = 81). The number of stars
(for response function) and triangles (for correlation function) indicates significance at the 90%, 95%, 99% and 99.9% levels.
370 F. Lebourgeois et al.
Our results agree with previous studies done throughout
Europe which showed that signature years in European oaks
were mainly linked to growing season precipitation anomalies;
temperature anomalies playing no or a secondary role in deter-
mining the pointer years [3, 6, 26, 32, 43]. Few pointer years
observed in this old oak stand are in agreement with previous
observations done throughout France, where the most frequent
pointer years observed in the sessile oak stands of the French
network RENECOFOR are the rainy years 1958 (+) and
1946 (+) and the dry years 1976 (–) and 1989 (–) [32]. The years
1976 (–), 1958 (+) and 1989 (–) seem to be very important
throughout Europe because they have also been observed in
north-eastern France in the region of Lorraine [3], in the plain
of Alsace [5] and in a wide range of taxa in England [6].
Latewood appears to be more sensitive to current climate
variations than earlywood and the response pattern obtained for
latewood is very similar to the one defined from total ring
series. The reliability of the climatic response of early- and late-
wood widths confirms that both parameters can be used to
obtain subseasonal climatic information [35]. This kind of
quantification may be considered as an intermediate step
between classical measures of ring widths and methods based
on wood structure. This method is easily applicable in the case
of ring porous species (abrupt transition between earlywood
and latewood) and takes into account wood-structural features.
Earlywood formation seems to be mainly controlled by previ-
ous autumn conditions, latewood widths of the preceding years
and January temperature. This positive link has been previously
observed in other studies [35, 37, 45] and could be ecophysio-
logical meaningful. It could be the consequence of a trade-off
between allocation to vessels or leaves at bud burst time. In oak trees,
carbohydrate storages (starch and sugars) mainly occur in autumn
(October to December) and spring mobilization is especially
high [1, 28]. This seasonal dynamic of stored carbohydrates
Figure 7. Actual growth index (solid line) and estimated growth index (closed symbols) of sessile oak for each ring component at the “Futaie
des Clos”, Forest of Bercé (Sarthe) (Period 1921–2001). The open symbols correspond to the pointer years (see text for details). The variance
accounted for by the significant climatic variables is given by the r
2
value.
Dendroclimatology of Quercus petraea 371
corresponds to the typical phenology and anatomy pattern of
this ring-porous species where about 30% of the total annual
stem increment (mainly earlywood formation) is added before
bud burst [1, 4, 23]. Spring mobilization of carbohydrates
reserves in oak may be related to its hydraulic properties. The
large vessels in oaks are very sensitive to winter embolism [21,
51]. A large part of the previous year’s earlywood vessels are
embolized by frost events in winter; therefore, the production
of new earlywood large vessels before leaf expansion is nec-
essary for the spring recovery of hydraulic conductivity [10,
13]. The large vessels in oaks are very sensitive to winter embo-
lism, and so spring reactivation of growth is very dependent on
stored carbon. This ecophysiological pattern could explain the
climatic correlations observed in our study between autumn
and winter conditions and earlywood formation. The high neg-
ative influence of low temperature in January was also observed
in north-eastern France by Becker et al. [3]. Another explana-
tion could be that roots will continue to grow at the end of the
growing season if they have a sufficient supply of nutrients and
water, until the soil temperatures become too low [42]. As a
result, if it rains during this period the roots will grow and when
the new growth cycle begins, the following year, the tree will
have a much larger root structure and will therefore be in a posi-
tion to grow more [45]. For earlywood formation, the related
shortening of the growing season due to deficient hydric bal-
ance in March could partially explain the correlation (only sig-
nificant at the 0.10 level) observed with this month.
To ensure wide latewood and total ring widths the trees need
an important supply of water in May and June. The above
growth pattern of oak is organized in successive fluxes and, dur-
ing the growing season, the same axis can produce several buds
consecutively. Therefore, an ample water supply during this
period is essential to ensure foliar development and thus to
ensure that growth can continue. A decrease in spring precip-
itation (SP) also leads to a decrease of the latewood-to-total-
wood ratio of about 12% (48% for SP below 70 mm to 54%
for SP above 150 mm; period 1921–2001; r = –0.383***).
Thus, by modifying the latewood ratio, spring drought also
changes wood density and thus wood quality characteristics.
In conclusion, this study has revealed the past and the current
level of radial growth of a 300-year-old Quercus petraea stand
located at low altitude in a wet acidic station in the western part
of France. Mean radial growth and extreme growth years
appeared to be more sensitive to spring and autumn precipita-
tion than temperature which coincides with the radial growth-
climate relationships for this species in Atlantic, Mediterranean
and Central European localities (positive response to precipi-
tation during May to July) [3, 5, 35, 38, 44, 45]. Both ring com-
ponents can be successfully used for dendroclimatological pur-
poses and to obtain subseasonal climatic information.
REFERENCES
[1] Barbaroux C., Bréda N., Contrasting distribution and seasonal
dynamics of carbohydrate reserves in stem wood of adult ring-
porous sessile oak and diffuse-porous beech trees, Tree Physiol. 22
(2002) 1201–1210.
[2] Becker M., The role of climate on present and past vitality of silver
fir forests in the Vosges mountains of northeastern France, Can. J.
For. Res. 19 (1989) 1110–1117.
[3] Becker M., Niemenen T., Géremia F., Short-term variations and
long-term changes in oak productivity in northeastern France. The
role of climate and atmospheric CO
2
, Ann. Sci. For. 51 (1994) 477–
492.
[4] Bréda N., Granier A., Intra- and interannual variations of transpira-
tion, leaf area index and radial growth of a sessile oak stand (Quercus
petraea), Ann. Sci. For. 53 (1996) 521–536.
[5] Bréda N., Peiffer M., Bilan hydrique et impact des épisodes de
sécheresse sur la croissance radiale des chênes, Rapport Scientifique
Final, Convention ONF-INRA, Unité Écophysiologie INRA-Nancy,
1999.
[6] Bridge M.C., Gasson P.E., Cutler D.F., Dendroclimatological obser-
vations on trees at Kew and Wakehurst place: event and pointer
years, Forestry 69 (1996) 263–269.
[7] Briffa K.R., Jones P.D., Basic chronology statistics and assessment,
in: Cook E.R., Kairiukstis L.A. (Eds.), Methods of dendrochronol-
ogy. Applications in the environmental sciences, Kluwer Academic,
Dordrecht, 1990, pp. 137–152.
[8] Briffa K.R., Jones P.D., Wigley T.M., Pilcher J.R., Baillie M.G., Cli-
mate reconstruction from tree rings: part 1 basic methodology and
preliminary results for England, J. Climatol. 3 (1983) 233–242.
[9] Camus R., Granet A.M., Dossier : les arbres remarquables, un trésor
vivant, Arborescences 92 (2001) 1–25.
[10] Cochard H., Bréda N., Granier A., Aussenac G., Vulnerability to air
embolism of three European oak species (Quercus petraea (Matt)
Liebl., Q pubescens Willd., Q robur L.), Ann. Sci. For. 49 (1992)
225–233.
[11] Cook E.R., Peters K., The smoothing spline: a new approach to
standardizing forest interior tree-ring width series for dendrocli-
matic studies, Tree-ring Bull. 41 (1981) 45–53.
[12] Cousseau G., Étude d’un peuplement exceptionnel : la Futaie des
Clos (Forêt de Bercé, 72), Mémoire de BTSA Gestion Forestière,
2002.
[13] Cruiziat P., Cochard H., Améglio T., Hydraulic architecture of trees:
main concepts and results, Ann. For. Sci. 59 (2002) 723–752.
[14] Degron R., Nepveu G., Prévision de la variabilité intra- et interarbre
de la densité du bois de chêne rouvre (Quercus petraea Liebl.) par
modélisation des largeurs et des densités des bois initial et final en
fonction de l’âge cambial, de la largeur de cerne et du niveau dans
l’arbre, Ann. Sci. For. 53 (1996) 1019–1030.
[15] Dhôte J.F., A model of even-aged beech stands productivity with
process-based interpretations, Ann. Sci. For. 53 (1996) 1–20.
[16] Dhôte J.F., Définition de scénarios d’éclaircie pour le hêtre et le
chêne, Rev. For. Fr. 48 (1995) 106–110.
[17] Foster J.R., LeBlanc D.C., A physiological approach to dendrocli-
matic modeling of oak radial growth in the midwestern United
States, Can. J. For. Res. 23 (1993) 783–798.
[18] Fritts H.C., Tree-ring and climate, Academic Press London, 1976.
[19] Fritts H.C., Xiangding W., A comparison between response-func-
tion analysis and other regression techniques, Tree-ring Bull. 46
(1986) 31–46.
[20] Guiot J., The bootstrapped response function, Tree-ring Bull. 51
(1991) 39–41.
[21] Hacke U., Sauter J.J., Xylem dysfunction during winter and recovery
of hydraulic conductivity in diffuse-porous and ring-porous trees,
Oecologia 105 (1996) 425–439.
[22] Helinska-Raczkowska L., Variation of vessel lumen diameter in
radial direction as an indication of the juvenile wood growth in oak
(Quercus petraea Liebl.), Ann. Sci. For. 51 (1994) 283–290.
[23] Hinckley T.M., Lassoie J.P., Radial growth in conifers and decidu-
ous trees: a comparison. Mitt. Forstl. Bundesversanst. Wien. 142
(1981) 17–56.
[24] Holmes R.L., Dendrochronology program library user’s manual.
Laboratory of tree-ring research, University of Arizona, Tucson,
1994.
[25] Jarret P., Sylviculture du chêne sessile, Bulletin Technique de l’ONF
31 (1996) 21–28.
372 F. Lebourgeois et al.
[26] Kelly P.M., Munro M.A.R., Hughes M.K., Goodess C.M., Climate
and signature years in west European oaks, Nature 340 (1989) 57–59.
[27] Krause C., Climate-growth relationships from continuous tree-ring
series versus pointer years, in: Bartholin T.S., Berglund E., Eckstein
D., Schweingruber F.H., Eggertsson O. (Eds.), Tree Rings and Envi-
ronment, Proceedings of the International Symposium, Ystad, South
Sweden, 3–9 September, 1990, Lund University, Department of
Quaternary Geology, Lund, 1992, pp. 164–167.
[28] Lacointe A., Carbon allocation among tree organs: a review of basic
processes and representation in functional-structural tree models,
Ann. For. Sci. 57 (2000) 521–533.
[29] Lebourgeois F., Analyse du bilan hydrique et de la croissance des
arbres dans le RENECOFOR, Rapport scientifique final, Union
Européenne, DG VI, projet n° 9760FR0030, Unité d’Écophysiolo-
gie Forestière, 1999.
[30] Lebourgeois F., Climatic signals in earlywood, latewood and total
ring width of Corsican pine from western France, Ann. For. Sci. 57
(2000) 155–164.
[31] Lebourgeois F., Les chênes sessile et pédonculé (Quercus petraea
Liebl. et Quercus robur L.) dans le réseau RENECOFOR : rythme
de croissance radiale, anatomie du bois, de l’aubier et de l’écorce,
Rev. For. Fr. 51 (1999) 522–536.
[32] Lebourgeois F., Renecofor. Étude dendrochronologique des 102 peuple-
ments du réseau, Office National de Forêts, Département des Recher-
ches Techniques, 1997.
[33] Lebourgeois F., Jabiol B., Enracinements comparés des chênes (ses-
sile et pédonculé) et du hêtre sur différents matériaux. Réflexions
sur l’autécologie des essences, Rev. For. Fr. 54 (2002) 17–42.
[34] Messaoudène M., Tessier L., Relations cerne-climat dans les peu-
plements de Quercus afares Willd. et Quercus canariensis Pomel
en Algérie, Ann. Sci. For. 54 (1997) 347–358.
[35] Nola P., Climatic signal in earlywood and latewood of deciduous
oaks from northern Italy, in: Dean J.S., Meko D.M., Swetnam T.W.
(Eds.), Tree Rings, Environment and Humanity, Radiocarbon, 1996,
pp. 249–258.
[36] Office National des Forêts, Guide de gestion : Les arbres remarqua-
bles en forêt, Office National des Forêts, Département des Recher-
ches Techniques, 2001.
[37] Orcel A., Orcel C., Favre A., Mohnhaupt M., Hurni JP., Dendrocli-
matic model constructed with oakwoods of the Swiss Piémont
Jurassien, in: Bartholin T.S., Berglund E., Eckstein D., Schweingru-
ber F.H., Eggertsson O. (Eds.), Tree Rings and Environment, Pro-
ceedings of the International Symposium, Ystad, South Sweden,
3–9 September, 1990, Lund University, Department of Quaternary
Geology, Lund, 1992, pp. 247–253.
[38] Pilcher J.R., Gray B., The relationships between oak tree growth and
climate in Britain, J. Ecol. 70 (1982) 297–304.
[39] Polge H., Facteurs écologiques et qualité du bois, Ann. Sci. For. 30
(1973) 307–328.
[40] Polge H., Production de chênes de qualité en France, Rev. For. Fr.
37 (1984) 34–48.
[41] Polge H., Keller R., Qualité du bois et largeur d’accroissements en
forêt de Tronçais, Ann. Sci. For. 30 (1973) 91–125.
[42] Riedacker A., Rythmes de croissance et de régénération des racines
des végétaux ligneux, Ann. Sci. For. 33 (1976) 109–138.
[43] Romagnoli M., Codipietro G., Pointer years and growth in Turkey
oak (Quercus cerris L.) in Latium (Central Italy). A dendroclimatic
approach, Ann. Sci. For. 53 (1996) 671–684.
[44] Rozas V., Detecting the impact of climate and disturbances on tree-
rings of Fagus sylvatica L. and Quercus robur L. in a lowland forest
in Cantabria, Northern Spain, Ann. For. Sci. 58 (2001) 237–251.
[45] Santini A., Bottacci A., Gellini R., Preliminary dendroecological
survey on pedunculate oak (Quercus robur L.) stands in Tuscany
(Italy), Ann. Sci. For. 51 (1994) 1–10.
[46] Schweingruber F.H., Abrupt growth changes in conifers, IAWA
Bul. 7 (1986) 277–283.
[47] Schweingruber F.H., Albrecht H., Beck M., Hessel J., Joos K., Keller
D., Kontic R., Lange K., Niederer M., Nippel C., Spang S., Spinnler
A., Steiner B., Winlkler-Seifert A., Abrupte Zuwachsschwankungen
in jahrringabfolgen als ökologische indikatoren, Dendrochronologia
4 (1986) 125–184.
[48] Schweingruber F.H., Eckstein D., Serre-Bachet F., Bräker O.U.,
Identification, presentation and interpretation of even years and
pointer years in dendrochronology, Dendrochronologia 8 (1990) 9–38.
[49] Tessier L., Nola P., Serre-Bachet F., Deciduous Quercus in the Med-
iterranean region: tree-ring/climate relationships, New Phytol. 126
(1994) 355–367.
[50] Viney R., À propos d’une parcelle artistique, Rev. For. Fr. 12 (1950)
734–736.
[51] Wang J., Ives N.E., Lechowicz M.J., The relation of foliar phenology
to xylem embolism in trees, Funct. Ecol. 6 (1992) 469–475.
[52] Wigley T.M., Briffa K.R., Jones P.D., On the average value of cor-
related time series, with applications in dendroclimatology and
hydrometeorology, J. Clim. Appl. Meteorol. 23 (1984) 201–213.
[53] Zhang S.Y., Nepveu G., Owoundi R.E., Intratree and intertree vari-
ation in selected wood quality characteristics of European oak
(Quercus petraea and Quercus robur), Can. J. For. Res. 24 (1994)
1818–1823.
[54] Zhang S.Y., Owoundi R.E., Nepveu G., Mothe F., Dhôte J.F., Mod-
elling wood density in European oak (Quercus petraea and Quercus
robur) and simulating the silvicultural influence, Can. J. For. Res.
23 (1993) 2587–2593.
To access this journal online:
www.edpsciences.org