Báo cáo lâm nghiệp: "Screening for efficient cold hardening in a breeding population of Salix using near infrared reflectance spectroscopy" pps
Bạn đang xem bản rút gọn của tài liệu. Xem và tải ngay bản đầy đủ của tài liệu tại đây (272.95 KB, 6 trang )
449
Ann. For. Sci. 61 (2004) 449–454
© INRA, EDP Sciences, 2004
DOI: 10.1051/forest:2004038
Original article
Screening for efficient cold hardening in a breeding population
of Salix using near infrared reflectance spectroscopy
Mattias LENNARTSSON, Erling ÖGREN*
Umeå Plant Science Centre, Department of Forest Genetics and Plant Physiology, Swedish University of Agricultural Sciences, 901 83 Umeå, Sweden
(Received 16 June 2003; accepted 28 October 2003)
Abstract – The inheritance of cold hardening components – the timing of onset and the inherent rate – was studied in Salix spp. This was
achieved by characterising the F
2
population of a cross between an early-and-rapidly hardening clone and a late-and-slowly hardening clone.
The cold hardiness of stems was estimated using the infrared reflectance spectra of dried and homogenised samples. This method was first
calibrated against the freeze test method. The timing of growth cessation was used to determine the onset of cold hardening. In the F
2
progeny,
traits were partly recombined as indicated by the occurrence of clones with early-and-slowly hardening characteristics. The frequency
distributions of clones also indicated that the timing of onset and the inherent rate of hardening were independently inherited traits. None of the
clones exhibited the desirable late-and-rapidly hardening characteristics, combining a long growing period with effective cold hardening. This
is not surprising since few F
2
clones exhibited late hardening.
cold hardiness / growth cessation / near infrared spectroscopy / Salix / tree breeding
Résumé – Criblage d’une population de Salix pour une acclimatation au froid optimale au moyen de la spectroscopie de réflectance en
proche infrarouge. La transmission des facteurs d’acclimatation au froid – le délai d’action et le taux d’acclimatation intrinsèque – a été étudiée
chez Salix spp. Ceci a été effectué par caractérisation d’une population F2 issue d’un croisement entre un clone à acclimatation précoce et rapide
et un clone à acclimatation tardive et lente. L’acclimatation au froid des tiges a été estimée à partir du spectre de réflectance infrarouge
d’échantillons séchés et homogénéisés. Cette méthode a tout d’abord été calibrée par comparaison avec la méthode de test par congélation. Le
minutage de l’arrêt de la croissance a servi à déterminer le délai d’acclimatation. Dans la génération F2, les caractères étaient partiellement
recombinants, comme indiqué par l’occurrence des clones présentant une acclimatation précoce et lente. Les distributions de fréquence des
clones ont montré également que le délai d’action et le taux d’acclimatation intrinsèque étaient transmis de façon indépendante. Aucun clone
n’a présenté les caractéristiques recherchées, associant une longue période de croissance avec une acclimatation au froid optimale. Ceci n’est
pas une surprise étant donné que peu de clones F2 montraient d’acclimatation tardive.
acclimatation au froid / arrêt de croissance / spectroscopie du proche-infrarouge / Salix / amélioration génétique des arbres
1. INTRODUCTION
In Europe, fast-growing willows (Salix spp.) are increasin-
gly being used for biomass production [15]. In northern areas
such production is limited by injuries inflicted as a result of
autumn frost [9]. In Salix, as with most other woody species,
cold hardening does not begin until growth has stopped in res-
ponse to the reduction in day length [17]. The small variations
in cold hardiness that plants display while actively growing
seem to be phenotypic, rather than genetic in origin [13]. Nor-
thern ecotypes of Salix cease to grow earlier – at longer day
lengths – than the southern ones [12], as do other woody species
[10]. This linkage between growth and hardening cycles impo-
ses restrictions on the extent to which either of these factors can
be improved in isolation [19, 22]. However, we have previously
presented evidence that cold hardiness is also affected by dif-
ferences in the inherent rate of cold hardening [13, 14]. Some
northern and continental ecotypes have the ability to undergo
cold hardening up to three times as quickly as typical southern
and maritime clones. This suggests that autumnal cold hardi-
ness can be improved without adversely affecting growth by
selecting for the combination of late commencement and a
rapid rate of hardening. None of the clones tested so far, howe-
ver, have displayed this combination. Breeding could create the
desired combination, provided that the underlying traits are
independently inherited.
Levels of cold hardiness can be evaluated practically by field
trials. However, such trials cannot discriminate between the
two factors contributing to hardening, namely the inherent rate
and the timing of onset. This is because genotypes that begin
* Corresponding author:
450 M. Lennartsson, E. Ögren
to harden late in the autumn will experience lower hardening
temperatures than those starting early. Hardening is a tempe-
rature dependent process, with a temperature optimum at
around 10 °C at the start, but at lower temperatures during later
stages [14]. A few studies using other woody plants suggest that
there is variation in the inherent rate [1, 7], but none of them
have been carried out under controlled conditions. In potato,
however, genetic variation in the rate of hardening has been
confirmed [25].
Under controlled hardening regimes, levels of cold hardi-
ness can be evaluated by means of freeze tests. Such tests,
however, have the disadvantage of being laborious and destruc-
tive. Alternatively, cold hardiness can be evaluated indirectly
by means of underlying physiological and genetic factors. Cha-
racterising quantitative trait loci (QTLs) could supply the desired
information in the future [3], but currently detailed quantitative
data are not available [4, 6]. Quantitative data can be obtained
using electrical impedance spectroscopy during the early harde-
ning phase [20]. Recently, promising results have been obtained
using reflectance spectroscopy in the visible and near infrared
ranges. Most of the genetic and phenotypic variation shown by
conifer seedlings [23], and Salix [14] could be evaluated using
this technique. Its value is that it detects the chemical changes
associated with cold hardening, for instance in pigmentation
and water and sugar content [14]. Similarly, this technique is
useful for the analysis of wood properties [2], characteristics
that also have a strong chemical basis.
The objectives of the present study were twofold: to study
the inheritance of hardening components by characterising the
F
2
progeny of a cross between a late-and-slowly hardening
clone and an early-and-rapidly hardening one; and to test the
value of the spectral technique for diagnosing cold hardiness
in a breeding situation.
2. MATERIALS AND METHODS
2.1. Plant material
A cross between the female clone ‘Jorunn’ (Salix viminalis L., cul-
tivar of Svalöf Weibull AB, Sweden) and the male clone ‘SW901290’
(S. dasyclados Wimm., collected wild from Kirov, Russia) was used
to produce F
2
progeny [21]. Of these, 78 were used in the present study.
Replicate plants of the F
2
, F
1
and P clones were raised from 10 cm
cuttings. They were grown for the first three weeks in 0.1 dm
3
pots
and thereafter in 2.6 dm
3
pots, using the substrates and nutrient solu-
tions described in [17]. During the day, growth room temperatures
varied from 20 to 30 °C and at night from 15 to 20 °C. The irradiance
varied from 300 to 600 µmol·m
–2
·s
–1
(19 h photoperiod), measured at
the top of the plants using a quantum sensor (Li-189; Li-Cor, Lincoln,
Neb., USA). After seven weeks of growth, when plants had reached
a height of 1–2 m, they were divided into three sets and subjected to
various regimes to induce hardening (see below).
2.2. Hardening regimes
The timing of growth cessation, which marks the onset of cold hard-
ening [17], was determined using a set of three replicate plants of each
clone, and subjecting them to a natural day length reduction. From the
middle of August they were kept in a greenhouse room shielded from
any extraneous artificial light. During the day, except the twilight
hours, additional light was provided by lamps to maintain an irradiance
of approximately 300 µmol·m
–2
·s
–1
at the top of the plants. Temper-
atures varied from 20 to 25 °C during the day, and from 15 to 20 °C
at night. Plants of similar height were placed adjacent to each other
so as to minimize shading. All the remaining plants were treated to
drastic day length reduction (from 19 to 6 h), known to trigger growth
cessation [13]. Thus, the rate of cold hardening could be determined
from a single measurement at a later stage. Three growth rooms were
used with day/night/overall temperatures averaging 8.8/7.5/8.5 °C,
10.3/4.1/8.8 °C, and 9.4/7.1/8.8 °C, measured using thermocouples
(0.05 mm) logged at 5 s intervals (CR10, Campbell Scientific, Logan,
Utah, USA). The irradiance at the top of plants varied from 250 to
350 µmol·m
–2
·s
–1
in all the growth rooms. The plants treated to the
abrupt day length reduction represented two sets. The first set – the
calibration set – comprised ten replicates each of 15 representative
clones, four of which were the parental and grandparental clones.
These were used for assessing cold hardiness and reflectance spectra,
in order to calibrate the multivariate model for predicting cold hardi-
ness from spectral data. The second set – the prediction set – comprised
four replicates of each of the clones. The cold hardiness of these plants
was assessed, using the model, from their spectral data. The replicates
from the prediction set were evenly distributed between the three
growth rooms whereas all replicates of a particular clone from the cal-
ibration set were kept together, so there were five clones in each
growth room. After 10 weeks of cold hardening, the plants from the
prediction set were harvested: the 34–38 cm stem segment below the
stem tip was cut off and stored at –25 °C for subsequent spectral anal-
ysis (see below). After 8–12 weeks of cold hardening, the clones from
the calibration set were assessed, individually, for cold hardiness by
means of the freeze tests described below.
2.3. Freeze tests
Freeze tests were performed on the calibration set using the proto-
col described in [13], except that plants were assessed individually.
The 20–54 cm section below the stem tip was cut into fifteen 2 cm
segments, leaving the central 4 cm segment for subsequent spectral
analysis. Prior to analysis, this segment was stored at –25 °C. The
smaller segments were separated into fourteen test tubes, to form a
temperature series with controls (two segments were used for the con-
trol). Segments from two replicate plants were placed in the same
series of tubes, with one replicate marked for later identification. All
ten replicate plants were prepared this way, resulting in five series of
tubes. The thirteen test temperatures were set apart by 1.4 °C starting
from a temperature within the range of –6 to –12 °C depending on the
expected cold hardiness of the clone as determined by the length of
hardening treatment and genetic factors. The cooling rate was 3 °C·h
–1
.
In order to initialise ice nucleation, cooling was temporarily halted at
–2 °C and small amounts of ice added to the tubes. After a test tem-
perature had been reached, the tubes were transferred to Dewar flasks,
which had been pre-cooled to the same temperature. This allowed slow
thawing when they were subsequently transferred to 5 °C. After thaw-
ing and subsequent recovery in darkness at 10 °C for 13 d, freezing
damage was determined by measuring the ratio of variable to maximal
chlorophyll fluorescence, a method that was validated before by com-
parison with scorings of tissue browning and regrowth capacity [17].
Data for individual plants were fitted to a sigmoid function by regres-
sion analysis (SPSS software, Chicago, USA), to determine the inflec-
tion point corresponding to 50% injury (LT50), as detailed in [13]. For
fifteen out of the 150 plants tested no LT50 value could be obtained.
For three of these this was because water was not added to the samples
during recovery, so they became desiccated. For the remaining twelve,
the data were too variable to allow regression analysis.
Cold hardening in Salix 451
2.4. Reflectance spectroscopy
The stem segments to be used for spectral analyses were freeze-
dried and ground to a powder, using a ball mill. Samples were handled
and analysed in a random order. Reflectance spectra were recorded
within the interval 1100 to 2500 nm (2 nm intervals; Model 6500,
FOSS NIR Systems, Silver Spring, USA), using the accompanying
software. Each sample was pressed into a sample holder, 2 mm deep
and 5 mm wide, using a metal plate attached to a spring to produce a
standard force. One spectrum per sample was recorded. The reflect-
ance (R) values were converted into absorbance (A) values using the
formula A = log (1/R). In order to identify outliers among data, all
spectra were combined in a principal component analysis plot, pro-
duced using the SIMCA 8.0 package (Umetrics, Umeå, Sweden). Nine
outliers were identified. However, when re-analysed, these samples
were suitable for inclusion, suggesting that they were initially handled
incorrectly. In further analysis of the calibration set, one sample was
identified as an outlier in the X versus Y correlation space (see below).
After excluding this sample, and the 15 samples for which no LT50
could be obtained (see above), 134 out of the 150 samples could be
used for modelling.
In order to predict LT50 values from the spectral data, a partial least
squares projection to latent structures (PLS) model was created using
the SIMCA 8.0 package. Only a brief description is provided here, but
a full review of the method can be found in [16]. A data matrix, X,
formed by measurements of p variables (absorbance spectra) from
n samples, can be projected down onto an A-dimensional subspace to
obtain a good approximation of matrix X, as well as a good correlation
with matrix Y (LT50), on the basis of the least-squares criterion. The
statistically significant number of dimensions, A, for the projection is
determined by the model’s ability to predict the Y-matrix for deleted
samples (the method of cross validation). Using this method, one-
quarter of the samples are deleted and a model is developed for the
remaining three-quarters; this model is then applied to the deleted sam-
ples to predict their Y-matrix. This procedure is repeated to obtain pre-
dictions for all samples. The method of orthogonal signal correction
(OSC), described by Wold et al. [26], was used to remove irrelevant
systematic data, mainly the result of light scattering. In short, the
method involves the removal of spectral X data that is unrelated to Y.
The data from the samples of the prediction set were then imported
and the same OSC algorithm as for the calibration set was applied. This
allowed prediction of their LT50 values from their spectral data.
2.5. Growth cessation and growth rate
The timing of growth cessation was assessed for plants subjected
to natural day length reduction. The length of the shoot apex was
assessed daily. The length of the growing leaf whose width was closest
to 3 mm was also measured. Cessation of growth was determined by
comparing this measurement with the length of the shoot apex. Growth
was deemed to have ceased when the apex length was reduced to half
that of the leaf. The rate of shoot growth was determined, for the pre-
diction set, by dividing the height of the plants when growth ceased
by the time since planting.
3. RESULTS
A multivariate model was developed to predict LT50 values
for Salix stems from the reflectance spectra of dried and milled
samples. Reflectance was determined for wavelengths ranging
from 1100 to 2500 nm. A subset of 15 clones was used to cal-
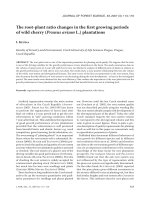
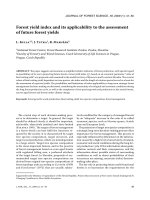
ibrate the model. The model was able to predict 73% of the var-
iation in LT50 values for the calibration set during the early
stage of cold hardening studied here (Fig. 1). The model com-
prised only two dimensions, A, further demonstrating its cred-
ibility and value in practical work. Although the model was val-
idated for LT50 values from –10 to –25 °C, it may have
underestimated the true level of cold hardiness at the lower end
of this range (Fig. 1). However, only a few of the plants reached
this end: plants that had been hardening for 12 weeks instead
of the standard period of 10 weeks.
The model was then used to predict LT50 values for the pre-
diction set, comprising all clones of the breeding population.
The standard error of determination for individual plants was
< 0.7 °C throughout (data not shown). Figure 2a shows the rela-
tionship, for all clones, between the predicted LT50 value and
the timing of the onset of growth cessation and hence the start
of cold hardening. All clones are known to start cold hardening
when treated to drastic day length reductions and they are
known to be equally cold sensitive while actively growing [13].
A single measurement of LT50, therefore, after 10 weeks in this
case, provides a measure of the rate of cold hardening. The
range of variation across clones with respect to the timing and
the inherent rate of hardening was extensive, with the onset
beginning between 240 and 285 days from the beginning of
the year, and LT50 values after 10 weeks ranging from –10 to
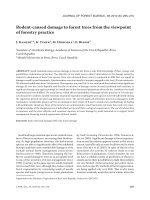
–20 °C. Figures 2b and c show the frequency distributions for
clones with respect to both characters. Clearly, the male grand-
parent (P*), which originated from continental Russia, dis-
played an earlier start and a more rapid rate of cold hardening
than the female grandparent (P**), which originated from a
temperate climate. The range of values exhibited by the F
2
clones extended the range displayed by the grandparents with
respect to both characters. Both F
1
parents exhibited interme-
diate values, although these were shifted towards those of the
P* grandparent. With respect to LT50 values, the frequency
distribution of clones apparently had the characteristics of a
Figure 1. Predicted versus observed LT50 values for the 134 plants
in the calibration set. Predictions were based on multivariate model-
ling using the absorbance spectra (1100–2500 nm) as X variables and
the LT50 value assessed from freeze tests as the Y variable. The dot-
ted line represents the 1:1 relationship.
452 M. Lennartsson, E. Ögren
normal distribution, with its centre shifted slightly towards the
P* grandparent (Fig. 2b). By contrast, the frequency distribu-
tion for the timing of onset of cold hardening was heavily
skewed towards the P* grandparent (Fig. 2c). A Shapiro-Wilk
normality test confirmed that only the former distribution was
normal (P = 0.23 for LT50 and P = 0.00 for growth cessation).
The different hardening characteristics of the grandparents
were partly recombined in the F
2
offspring: among the F
2
clones exhibiting early onset of hardening, like the P* grand-
parent (at around day 245), there were several with a slow hard-
ening rate, like that of the P** grandparent (Fig. 2a). Although
the rapid hardening of the P* grandparent was not recombined
with the late onset of hardening of the P** grandparent, this
may be coincidental and reflect the low numbers of late hard-
ening clones.
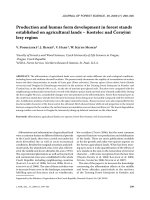
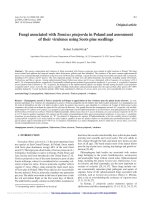
There was a wide variation in growth rate between the
clones, but this was unrelated to the variation in the inherent
rate of cold hardening (Fig. 3).
4. DISCUSSION
4.1. Assessing cold hardiness using reflectance
spectroscopy
The levels of cold hardiness of Salix stems could be assessed
from the reflectance spectra of dried and milled samples: 73%
of the variation in the calibration set could be predicted (Fig. 1).
In a previous study, however, we were able to predict as much
as 96% of the variation in cold hardiness by analysing intact
tissues [14]. It, therefore, seems that intact tissues provide bet-
ter estimates than homogenised and dried ones, despite the fact
that the former are optically more heterogeneous. However, the
intact tissues also provided more hardening-related informa-
tion: in the near infrared range, they revealed the decreasing rel-
ative water content with advancing cold hardening, and, in the
visible range, they revealed the decreasing chlorophyll content
and increasing anthocyanin content [14]. Neither water nor pig-
ment could be assessed using dried samples. The pigments were
degraded by the drying process.
Cold hardening was monitored during its relatively early stages.
Beyond an LT50 value of about –20 °C, however, the spectral
method may underestimate the true level of cold hardiness
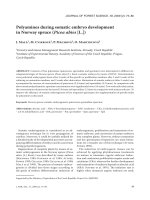
Figure 2. Cold hardening characteristics of the 78 F
2
clones, the two
F
1
parents and the two P grandparents: the LT50 value, predicted
from spectral measurements, after 10 weeks of cold hardening
induced by a drastic reduction in day length, and, during natural day
length reduction, the number of days from the beginning of the year
to the cessation of growth and the onset of cold hardening. (a) LT50
values versus number of days to growth cessation; (b) the frequency
distribution of clones with respect to LT50 values; (c) the frequency
distribution of clones with respect to number of days to growth ces-
sation. The male (*) and female (**) clones of parents and grandpar-
ents are indicated. In (a), mean ± SE values are shown for four
(LT50) and three (growth cessation) replicates.
Figure 3. The relationship between LT50, predicted from absor-
bance spectra after 10 weeks of cold hardening, and the rate of shoot
growth prior to cold hardening. The data represent individual plants
of the 78 F
2
clones, the two F
1
parents and the two P grandparents.
Cold hardening in Salix 453
(Fig. 1). Other techniques for estimating cold hardiness from
chemical changes also seem to provide underestimates beyond
this point [5, 18]. This may be because the hardening process
undergoes a shift at about this point from mainly broad chem-
ical changes to mainly qualitative changes, such as the forma-
tion of the glass state [11]. This complication does not seriously
limit the value of the spectral technique because the early hard-
ening stage is more critical than the later stages. In Salix plan-
tations, autumn frosts cause more severe injuries than winter
frosts, and even frost-sensitive Salix clones have sufficient
capacity for cold hardening in relation to prevailing winter tem-
perature minima [9]. Similarly, a greater genetic variation in
cold hardiness in the autumn than in the winter has been
observed in sessile oak [8] and Douglas fir [1].
In conclusion, the spectral method for determining cold har-
diness is best applied to intact tissues undergoing initial cold
hardening, and by utilising information in both the visible and
near infrared spectral ranges.
4.2. Inheritance of cold hardening traits
Previously we have demonstrated the existence of a large
genetic variation in Salix with respect to both the timing of
onset and the rate of cold hardening [13]. Clones from colder
climates exhibit an earlier start and a higher rate than those from
milder climates. None of the clones examined showed the desir-
able combination of a late start and a rapid rate. One of the
objectives of the present investigation was to look for such a
combination in a cross between an early-and-rapidly hardening
clone and a late-and-slowly hardening one. Traits were par-
tially recombined in the F
2
offspring, with several of the clones
showing the early-and-slowly hardening combination (Fig. 2a).
Although none of the clones showed the desirable late-and-
rapid hardening recombination, this may be the result of the low
numbers of late-hardening F
2
clones overall. The distribution
of F
2
clones is asymmetrical with respect to the timing of onset,
with the majority of clones showing the early-hardening char-
acter. This is probably the result of a difference in the ploidity
of the grandparents: after completion of the study we learned
that the early-hardening grandparent is hexaploid, whereas the
late-hardening one is diploid (Rönnberg-Wästljung, personal
communication). The greater impact of the hexaploid grand-
parent on the progeny, however, was restricted to the timing of
onset of hardening. In contrast, the rate of cold hardening was
normally distributed with the centre of the distribution only
slightly shifted towards the hexaploid grandparent (Fig. 2b).
This may suggest that the rate of hardening is controlled by a
larger number of genes, thus cancelling out the difference in
ploidity. In general, cold hardening is a quantitative trait
involving many genes with small additive effects [24], but
genetic studies in the past have not distinguished between the
different hardening components. Another possible explanation
for the rate of hardening being normally distributed but not the
timing of onset may be a higher degree of heterozygosity of
genes controlling the rate.
In conclusion, the results presented here suggest that the
inherent rate and the timing of onset of cold hardening are inde-
pendently inherited traits in Salix. This, in turn, suggests that
it should be possible to improve cold hardiness without
adversely affecting growth, by selecting for a high rate and a
late onset. The discovery that hardening rate and growth rate
are unrelated traits (Fig. 3) lends further support to this possi-
bility. Wide-scale screening will, clearly, be required to find
desirable genotypes, but the spectral analysis method should
make this possible.
Acknowledgements: We wish to thank Drs Ulf Lagercrantz, Ann-
Christin Rönnberg Wästljung and Urban Gullberg for the generous
gift of the plant material. The work was supported financially by the
Swedish Energy Agency and the Swedish Research Council for the
Environment, Agricultural Sciences and Spatial Planning.
REFERENCES
[1] Aitken S.N., Adams W.T., Genetics of fall and winter cold hardi-
ness of coastal Douglas-fir in Oregon, Can. J. For. Res. 26 (1996)
1828–1837.
[2] Baillères H., Davrieux F., Ham-Pichavant F., Near infrared analysis
as a tool for rapid screening of some major wood characteristics in
a eucalyptus breeding program, Ann. For. Sci. 59 (2002) 479–490.
[3] Van Buijtenen J.P., Genomics and quantitative genetics, Can. J.
For. Res. 31 (2001) 617–622.
[4] Byrne M., Murrell J.C., Owen J.V., Williams E.R., Moran G.F.,
Mapping of quantitative trait loci influencing frost tolerance in
Eucalyptus nitens, Theor. Appl. Genet. 95 (1997) 975–979.
[5] Calmé S., Margolis H.A., Bigras F.J., Mailly D., The relationship
between water content and frost tolerance in shoots of hardwood
seedlings, Can. J. For. Res. 25 (1995) 1738–1745.
[6] Chen T.H.H., Howe G.T., Bradshaw H.D., Molecular genetic stu-
dies of dormancy-related traits in poplars, Weed Sci. 50 (2002)
232–240.
[7] Cox S.E., Stushnoff C., Temperature-related shifts in soluble car-
bohydrate content during dormancy and cold acclimation in Popu-
lus tremuloides, Can. J. For. Res. 31 (2001) 730–737.
[8] Deans J.D., Harvey F.J., Frost hardiness of 16 European provenan-
ces of sessile oak growing in Scotland, Forestry 69 (1996) 5–11.
[9] Von Fircks H.A., Frost hardiness of dormant Salix shoots, Scand. J.
For. Res. 7 (1992) 317–323.
[10] Heide O.M., Growth and dormancy in Norway spruce ecotypes
(Picea abies) I. Interaction of photoperiod and temperature, Phy-
siol. Plant. 30 (1974) 1–12.
[11] Hirsh A.G., Vitrification in plants as a natural form of cryoprotec-
tion, Cryobiology 24 (1987) 214–228.
[12] Junttilla O., The cessation of apical growth in latitudinal ecotypes
and ecotype crosses of Salix pentandra, J. Exp. Bot. 33 (1982)
1021–1029.
[13] Lennartsson M., Ögren E., Causes of variation in cold hardiness
among fast-growing willows (Salix spp.) with particular reference
to their inherent rates of cold hardening, Plant Cell. Environ. 25
(2002) 1279–1288.
[14] Lennartsson M., Ögren E., Predicting the cold hardiness of willow
stems using visible and near-infrared spectra and sugar concentra-
tions, Trees 17 (2003) 463–470.
[15] Makeschin F., Short rotation forestry in Central and Northern
Europe – introduction and conclusions, For. Ecol. Manage. 121
(1999) 1–7.
[16] Martens H., Naes T., Multivariate calibration, Wiley, New York,
1989.
[17] Ögren E., Fall frost resistance in willows used for biomass produc-
tion. I. Characterization of seasonal and genetic variation, Tree
Physiol. 19 (1999) 749–754.
[18] Ögren E., Fall frost resistance in willows used for biomass produc-
tion. II. Predictive relationship with sugar concentration and dry
matter content, Tree Physiol. 19 (1999) 755–760.
454 M. Lennartsson, E. Ögren
[19] Rehfeldt G.E., Early selection in Pinus ponderosa: Compromises
between growth potential and growth rhythm in developing bree-
ding strategies, For. Sci. 38 (1992) 661–677.
[20] Repo T., Hiekkala P., Hietala T., Tahvanainen L., Intracellular
resistance correlates with initial stage of frost hardening in willow
(Salix viminalis), Physiol. Plant. 101 (1997) 627–634.
[21] Rönnberg-Wästljung A.C., Tsarouhas V., Semirikov V., Lagercrantz
U., A genetic linkage map of a tetraploid Salix viminalis × S. dasy-
clados hybrid based on AFLP markers, For. Genet. 10 (2003) 185–
194.
[22] Stevenson J.F., Hawkins B.J., Woods J.H., Spring and fall cold har-
diness in wild and selected seed sources of coastal Douglas-fir, Sil-
vae Genet. 48 (1999) 29–34.
[23] Sundblad L G., Andersson M., Geladi P., Salomonson A., Sjöström
M., Fast, non-destructive measurement of frost hardiness in conifer
seedlings using VIS + NIR spectroscopy, Tree Physiol. 21 (2001)
751–757.
[24] Thomashow M.F., Plant cold acclimation: freezing tolerance genes
and regulatory mechanisms, Annu. Rev. Plant Physiol. Plant Mol.
Biol. 50 (1999) 571–599.
[25] Vega S.E., Palta J.P., Bamberg J.B., Variability in the rate of cold
acclimation and deacclimation among tuber-bearing Solanum
(potato) species, J. Am. Soc. Hortic. Sci. 125 (2000) 205–211.
[26] Wold S., Antti H., Lindgren F., Öhman J., Orthogonal signal correction
of near-infrared spectra, Chemometr. Intell. Lab. Syst. 44 (1998)
175–185.
To access this journal online:
www.edpsciences.org