Báo cáo lâm nghiệp: "Effects of defoliation on the frost hardiness and the concentrations of soluble sugars and cyclitols in the bark tissue of pedunculate oak (Quercus robur L.)" potx
Bạn đang xem bản rút gọn của tài liệu. Xem và tải ngay bản đầy đủ của tài liệu tại đây (461.94 KB, 9 trang )
455
Ann. For. Sci. 61 (2004) 455–463
© INRA, EDP Sciences, 2004
DOI: 10.1051/forest:2004039
Original article
Effects of defoliation on the frost hardiness and the concentrations
of soluble sugars and cyclitols in the bark tissue of pedunculate oak
(Quercus robur L.)
Frank M. THOMAS
a
*, Gabriele MEYER
a
, Marianne POPP
b
a
Department of Plant Ecology, Albrecht von Haller Institute of Plant Sciences, University of Göttingen, Untere Karspüle 2, 37073 Göttingen, Germany
b
Department of Chemical Physiology of Plants, Institute of Ecology and Conservation Biology, University of Vienna, Althanstraße 14,
1090 Vienna, Austria
(Received 9 July 2003; accepted 26 September 2003)
Abstract – As a measure of frost hardiness, we determined an index of injury (I
–30
) in living bark tissue of 20-year-old pedunculate oaks
(Quercus robur L.) that had been manually and almost completely defoliated in the first half of May of one or two years, and of non-defoliated
control trees. I
–30
was calculated as a percentage value on the basis of electrolyte leakage from samples artificially frozen at a temperature of
–30 °C, and from unfrozen control samples. In parallel, the bark’s concentrations of soluble sugars, of nitrogen and of quercitol, a cyclic polyol,
were measured. Repeated defoliation significantly reduced the frost hardiness of the bark as well as its concentrations of raffinose, stachyose,
nitrogen and quercitol. The I
–30
values were correlated with the total concentration of soluble sugars and with the concentrations of the
individual sugar compounds, but not with the quercitol concentration. Less tight, yet significant correlations were obtained between I
–30
and
nitrogen concentrations. We conclude that repeated defoliation decreases the bark’s capability to acclimatize to winter frost due to a reduction
in the concentrations of soluble sugars, particularly those of raffinose and stachyose.
electrolyte leakage / oak decline / quercitol / raffinose / stachyose
Résumé – Effets de la défoliation sur la résistance au gel et les concentrations de sucres solubles et de cyclitols dans le liber de chênes
pédonculés (Quercus robur L.). Comme mesure de la résistance au gel du liber vivant de chênes pédonculés âgés de vingt ans et ayant déjà
été défoliés manuellement presque entièrement dans la première moitié du mai d’une ou deux années, on a calculé un index de dommage (I
–30
)
et on a comparé avec la valeur correspondante d’arbres témoins non défoliés. On a déterminé I
–30
comme une valeur de pourcentage sur la base
de perte d’électrolytes des échantillons congelés artificiellement à –30 °C, et des échantillons pas congelés. Parallèlement on a mesuré les
concentrations de sucres solubles, d’azote et de quercétol, un polyalcool cyclique, du liber. La deuxième défoliation a réduit de manière
significative tant la résistance au gel du liber que ses concentrations en raffinose, stachyose, azote et quercétol. Les indices de dommage (I
–30
)
étaient en corrélation avec la concentration totale de sucres solubles et avec les concentrations de sucres individuels, mais pas avec la
concentration de quercétol. Des corrélations moins étroites mais toutefois significatives ont été mises en évidence entre les valeurs I
–30
et les
concentrations d’azote. Ces résultats nous permettent de conclure qu’une défoliation répétée réduit la capacité d’acclimatation du liber aux gels
d’hiver en raison d’une diminution des concentrations de sucres solubles, surtout de raffinose et de stachyose.
dépérissement du chêne / perte d'électrolytes / quercétol / raffinose / stachyose
1. INTRODUCTION
In contrast to the beech (Fagus sylvatica L.), which is the
other most important Central-European deciduous forest tree
species, the pedunculate oak (Quercus robur L.) and sessile
oak (Q. petraea [Matt.] Liebl.) are normally subject to several
severe defoliation events, including complete defoliation
(> 90%), during their life cycles. On average, defoliation
occurs at least once per decade [18]. However, complete defo-
liation in two or more consecutive years may also occur, and
can exert severe stress to the trees due to great loss of photo-
synthate. Several investigations have supplied evidence that
severe or complete defoliation by lepidopteran larvae plays a
predominant role in the occurrence of increased oak mortality
(“oak decline”) in various regions of Europe (e.g., [19, 25, 36, 41]).
Defoliation results in alterations in the trees’ carbohydrate levels.
In twigs, trunks and fine roots of young poplars (Populus ×
canadensis), the concentrations of total non-structural carbo-
hydrates were lower in the weeks following defoliation in spring
and early summer [24]. In oaks, defoliation leads to substantially
* Corresponding author:
456 F.M. Thomas et al.
reduced starch and sucrose contents in the roots, but to
increased concentrations of fructose and glucose in the cambial
zone of the bark [50].
In most cases, repeated defoliation alone is not sufficient to
trigger increased oak mortality, but has to be accompanied by
additional stress factors. Extreme summer droughts and severe
winter frosts are the most important ones of these factors. In
oaks, extremely low winter temperatures (down to –26 °C)
were found to cause necroses in the living bark tissue of the
trunks, and obviously represented one of the factors that
resulted in an episode of oak decline in Northern Germany [19].
Generally, the seasonal development of frost hardiness is
closely linked to photoperiod, temperature and to the tissues’
concentrations of soluble sugars [2, 15, 26, 38]. This has also
been shown for the bark tissue of several deciduous tree species
[33]. Other components that have been related to frost hardiness
are cyclitols (isocyclic polyols) and nitrogen (N) compounds
[27, 38, 51]. In Q. robur, quercitol (L-1,3,4/2,5-cyclohex-
anepentol) is the predominant cyclitol [35]. A significant
reduction in the concentration of quercitol of bark tissue was
found in 21-year-old sessile oaks (Q. petraea [Matt.] Liebl.),
after a single manual defoliation in June, in the following winter
[16]. Recently, some cyclitols, including quercitol, have been
shown to decrease damage induced by a freeze-thaw cycle in
thylakoid membranes [32].
A combination of severe defoliation in at least two consec-
utive years with climatic extremes such as severe winter frost
can be presumed to be the most significant factor complex in
the occurrence of oak decline in Central Europe [18, 47]. Pre-
liminary investigations had shown that, in tendency, the frost
hardiness of bark from pedunculate and sessile oaks was
reduced in winter after insect defoliation in the preceding
spring [45]. However, these investigations could only be con-
ducted on a limited number of trees and sampling dates. Con-
sequently, a more thorough study was initiated, which included
a larger number of trees that had been manually defoliated once
or twice before beginning the determination of frost hardiness.
We hypothesize that complete defoliation of oaks in the spring
– especially when occurring in consecutive years – reduces the
frost hardiness of the bark in the following winter via a reduc-
tion in the content of soluble sugars and/or cyclitols. To obtain
preliminary indications on the role of nitrogen compounds in
a defoliation-induced decrease in frost hardiness, the nitrogen
concentration and the C:N ratios of the bark tissue were
included in the study.
2. MATERIALS AND METHODS
2.1. Study site, plant material and defoliation
The investigated pedunculate oaks (Quercus robur L.) grew on
loamy sand on the ground of a tree nursery near the village of Wietze
in the southern heath land of Lower Saxony (NW Germany; N 52° 39’,
E 09° 50’; 30 m a.s.l.). They had been grown from acorns originating
from the Netherlands (“NLA Selektion Holland 0–100 m”). In Mai
2000, the trees were 20 years old and grew on an open field, in a row
exposed to the North-Northeast with a length of 300 m from the first
to the last investigated tree. The distance between the trees, which were
approximately 5 m high, was about 3 m. Since 1997, the area had been
excluded from the nursery’s fertilization scheme.
In the region of the nursery, the mean annual temperature is 8.9 °C,
and the mean annual precipitation, 654 mm (average for the period
1960–1990; data from the meteorological station of Celle-Wietzen-
bruch, N 52° 38’, E 10° 01’; 39 m a.s.l.; 16 km southeast of the nurs-
ery). For the sampling period, the daily minimum air temperatures
(Fig. 1) were obtained from the meteorological station at Unterlüß
(N 52° 51’, E 10° 17’; 95 m a.s.l.), which is located in the same cli-
matic region, 38 km to the northeast of the nursery, and is operated
by the German Meteorological Service [12].
To exclude possible position effects, six groups consisting of three
oaks of the same height and the same habit, which were growing in
close vicinity, were selected from the tree row. Within each group,
each tree was randomly assigned to one of the following three treat-
ments (to give a total number of six trees per treatment): control (C;
no defoliation), single defoliation (SD; in May 2000), or repeated defo-
liation (RD; in May 1999 and 2000). Defoliation was performed in the
first half of May, after budbreak, by manually stripping the leaves from
the shoots. The extent of defoliation was 90–95%. Only the uppermost
shoots that could not be reached with ladders remained non-defoliated.
The intensity and timing of this treatment mimicked a complete defo-
liation by larvae of Tortrix viridana L. [29], a lepidopteran species that
belongs to the most important oak-defoliating insects in Central
Europe [47].
2.2. Determination of growth and sampling
In May 2000, the circumference of the tree stems was measured.
To determine the radial stem growth increment, the measurement was
repeated in March 2001.
In 2000, leaf samples were taken in mid-July, during the regular
period of leaf sampling from broadleaved trees in German forest mon-
itoring [8]. At that time, the defoliated trees had restored their canopies
through the formation of replacing shoots (canopy restoration was
completed by the end of June, as was assessed by visual inspection).
From each tree, three shoots were harvested from the upper crown, and
were combined to form one sample per tree. The leaves were placed
in plastic bags and put on dry ice in a cool box for transportation. In
the laboratory, they were stored at –18 °C until further processing.
On eight dates, from October 2000 to April 2001, samples of the
living bark were taken at breast height from the north-northeasterly
exposed side of the stems with a cork borer (10 mm diameter). Rem-
nants of cambium and dead bark (rhytidome) were removed with a
scalpel. The samples were placed in glass vials closed with screw caps.
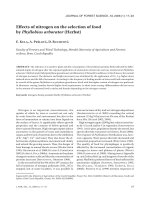
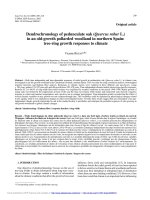
Figure 1. Daily minimum air temperature in the region of the inves-
tigation site during the sampling period in winter 2000/2001.
Defoliation, frost hardiness and sugars in oak 457
For transportation, they were stored, immediately after sampling, in a
cool box at +5 °C (for the determination of frost hardiness and freezing
injury), or on dry ice (for chemical analyses). In the laboratory, the
samples were kept at +5 °C in a refrigerator until the determination of
frost hardiness and freezing injury on the following day, or at –18 °C
until chemical analyses.
2.3. Frost hardiness and freezing injury
Frost hardiness of the bark tissue was determined by artificial freez-
ing according to Kolb et al. (1985) [23], modified according to Thomas
and Ahlers (1999) [44]. The glass vials with one bark sample each were
frozen in a cryostat (Fryka FT 10-44; National Lab., Mölln, Germany)
from +5 °C to –30 °C with a cooling rate of 5 °C·h
–1
(extreme mini-
mum air temperatures below –25 °C had occasionally occurred in
Northern Germany during the past decade). After being kept at –30 °C
for 30 min, the samples were allowed to thaw overnight in a refriger-
ator at +5 °C. Two replicates were used per tree and sampling date. A
respective number of control samples remained unfrozen in a refrigerator
at +5 °C during that time. Electrolyte leakage from the samples was
measured with a conductivity sensor (sensor LTA 1 and conductom-
eter LF 2000/C; WTW, Weinheim, Germany) after incubation in 6 mL
of 3% (v/v) propanol in distilled water for 24 h. The relative conduc-
tivity (RC; %) of the medium was determined after killing the tissue
by autoclaving as described by Thomas and Ahlers (1999) [44]. From
the RC values of frozen and control samples, an index of injury by
freezing at –30 °C (I
–30
) was calculated according to Flint et al. (1967)
[13]. The maximum range of this index was 0% (no freezing injury)
to 100% (tissue completely killed by freezing). Low index values indi-
cate high frost hardiness and vice versa.
For the determination of this index of injury, we could rely on only
one freezing temperature (–30 °C) for the following reasons. First,
most of the previous measurements had shown that, in bark tissue from
oaks, a linear relationship exists between the index of injury and freez-
ing temperatures ranging from –5 °C to –30 °C [45, 46]. Second, tem-
peratures of –25 °C and –30 °C – with the above-mentioned procedure
for cooling, duration of exposure to freezing temperature, and thawing
– were shown to be sufficiently low for the detection of differences in
frost hardiness of bark tissue obtained from trees subjected to different
treatments or conditions, including defoliation history [44–46]. And
third, with those freezing temperatures, the course of hardening and
dehardening of bark tissue from oaks during winter can be revealed
[44, 46].
In order to test whether the actual air temperatures during winter
did cause any injury to the bark tissue of the trees, the possible freezing
injury was determined according to Murray et al. (1989) [30], modified
according to Thomas and Ahlers (1999) [44]. Three replicates per tree
and sampling date were incubated with 10 mL of 0.5% (v/v) propanol
(in distilled water), and the conductivity of the medium was measured
11 times starting at 0.5 h and ending at 144.5 h after the start of incu-
bation. Between the measurements, the samples were kept in a refrig-
erator at +5 °C. Before each measurement, they were brought to room
temperature. After the last measurement, the tissue was killed by auto-
claving, and the RC was determined for each time of measurement as
described above. The log values of RC were plotted against the log
values of time (hours), and the slopes of the regression lines (b) were
computed. A mean b value was calculated for each tree and sampling
date. Higher b values indicate increased freezing injury.
2.4. Chemical analyses
The leaf and bark samples were lyophilized at –48 °C for four days
and pulverized. The N concentrations were measured, in one sample
per tree and sampling date, with a CHNOS-analyzer (vario EL III, Ele-
mentar-Analysensysteme, Hanau, Germany), with acetanilide as a
standard. For the determination of soluble sugars and cyclitols, 20 mg
of the lyophilized and pulverized bark material from the control and
the repeatedly defoliated oaks (one sample per tree and sampling date)
were extracted for 30 min with water at 100 °C and centrifuged. The
supernatant was dried in a vacuum, and 200 µL pyridine and 50 µL of
a mixture of N,O-bis(trimethylsilyl)-trifluoracetamide (BSTFA) and
trimethylchlorosilane (volume combination 9 + 1) were added. For
silylization, the samples were heated for 60 min at 75 °C. The analyses
were made with a gas chromatograph (HP 6890, column: HP 5 MS).
The injected sample volume was 0.5 µL. The temperature profile was
as follows: 85 °C for 1 min, heating to 240 °C with 8 °C·min
–1
, heating
from 240 °C to 325 °C with 12 °C·min
–1
. The measurement was per-
formed with an FID detector at 330 °C. The internal standard was phe-
nyl-β-D-glucopyranoside. The following soluble sugars were deter-
mined: fructose, glucose, raffinose, stachyose and sucrose; and the
following cyclitols: myo-inositol (4,6/1,2,3,5-cyclohexanehexol),
quercitol (L-1,3,4/2,5-cyclohexanepentol) and viburnitol (2,4/3,5,6-
cyclohexanepentol). These compounds were selected because they
have previously been reported to occur in larger quantities in the bark
of oaks (fructose, glucose, sucrose, myo-inositol, quercitol, viburnitol
[16, 35]), or to be related to the frost hardiness of the bark or stem of
woody species (raffinose, stachyose [33, 43]). The identity of the
cyclitols was established by comparison with previously isolated
standards [32].
2.5. Statistics
In the presentation of the results, means ± 1 standard error are
given. The data sets were tested on normal distribution using the UNI-
VARIATE procedure of SAS 8.1 (SAS Institute, Cary, NC, USA) and
the distribution of the W values [40] (significance level P <0.1). The
glucose concentration data were not normally distributed; thus, dif-
ferences between the treatments (control and repeated defoliation) on
the individual dates were tested using the non-parametrical U test [37]
(P < 0.05). In all other cases, the data were normally distributed, and
one-way ANOVA (growth increment, foliar nutrient relations) or one-
way ANOVA with repeated measurement analysis (frost hardiness,
freezing injury, chemical analyses of bark samples; independent var-
iables: defoliation treatment and date) was employed (GLM proce-
dure; SAS 8.1), followed by Tukey’s test (P < 0.05). Regressions were
performed with the REG procedure (SAS 8.1), and the regression coef-
ficients were tested on significance using the t-test [37]. Multiple
regressions on I
-30
as the dependent variable, with the single sugar con-
centrations, the total sugar concentration, the nitrogen and quercitol
concentrations and C:N ratios of the bark and the defoliation as the
predictor variables, were conducted with the RSQUARE procedure
(SAS 8.1). The significance of the multiple determination coefficients
R
2
and the significance of the increase in R
2
by including additional
variables into the model were tested using the distribution of F values [37].
3. RESULTS
3.1. Growth increment, freezing injury and frost
hardiness
In May 2000, at the time of the second defoliation of the RD
treatment, the diameter at breast height of the oak stems was
10.8 ± 0.8, 11.0 ± 0.5 and 10.2 ± 0.7 cm in the treatments C,
SD and RD, respectively. The diameters did not differ signifi-
cantly among the treatments. In March 2001, ten months after
the last defoliation treatment, the relative growth increment of
the control trees’ stems was significantly higher than that of the
SD and RD oaks; whereas no significant difference was
detected between the two defoliation treatments (Tab. I).
458 F.M. Thomas et al.
Data on freezing injury and frost hardiness are given for a
period extending from the beginning of November (when the
daily minimum air temperature in the region was below +5 °C
on three consecutive days for the first time in that winter) to
the beginning of April (after air temperatures lower than –1 °C
had occurred for the last time – i.e., on March 28 – in that winter;
cf. Fig. 1).
The frost periods during the investigation period (absolute
minimum: –12.5 °C) were not severe enough to induce differences
in freezing injury of the bark tissue among the treatments as was
obvious by the lack of significant differences in the slope b
(Fig. 2).
The method employed to assess the frost hardiness of the
bark tissue (determination of an index of injury) was suitable
to reveal the periods of frost hardening (in late autumn) and
dehardening (in late winter; Fig. 3). Compared to the control
trees, the frost hardiness of the bark tissue of the repeatedly
defoliated trees was significantly reduced. This was true for a
comparison considering the entire investigation period as well
as for a comparison on one single date in late winter (first half
of February; Fig. 3). The frost hardiness of the bark of the SD
treatment did not differ significantly from that of control or RD
trees. Therefore, chemical analyses of the bark tissue were con-
fined to samples from control and repeatedly defoliated oaks.
3.2. Chemical analyses
In July 2000, foliar N concentrations and C:N ratios did not
differ significantly among the treatments, and the N concentra-
tions were within the range of “adequate” N nutrition of pedun-
culate oak plantations (21–28 mg N·g
–1
D.M. [48, 49]), i.e.
within a range where growth increase will only occur after high
rates of N application. However, N concentrations were lower,
and C:N ratios higher, in the bark of repeatedly defoliated oaks
compared to the control trees on most of the sampling dates
including the date in February, on which the differences in I
–30
between C and RD trees were significant (Fig. 4). For N con-
centrations and C:N ratios, the difference between C and RD
trees was also significant for the entire investigation period.
The predominate soluble sugar compounds in the bark tissue
were fructose, glucose and sucrose, with concentrations between
approx. 20 and more than 100 mmol·kg
–1
D.M. The concentrations
Table I. Relative growth increment of stem diameter, foliar N concentration and foliar C:N ratio of 20-year-old (in 2000) pedunculate oaks
subjected to different defoliation treatments. Different letters indicate significant differences among the treatments.
Period or time of measurement
Treatment
Control Single defoliation Repeated defoliation
Relative stem growth increment (%)
May 2000–March 2001 7.2 ± 1.2 a 1.9 ± 0.4 b 1.2 ± 0.3 b
Foliar N concentration (mg·g
–1
D.M.)
July 2000 22.8 ± 1.0 25.0 ± 1.3 21.7 ± 0.8
Foliar C:N ratio (g·g
–1
D.M.)
July 2000 20.4 ± 0.9 18.7 ± 0.9 21.4 ± 0.9
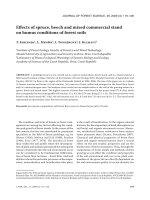
Figure 2. Freezing injury caused by actual air temperatures to bark
tissue of 20-year-old pedunculate oaks subjected to different treat-
ments (closed circles, control; open squares, single defoliation; open
triangles, repeated defoliation). The freezing injury was determined
as the slope b of the linear relationships between the log values of rela-
tive conductivity (RC; %) of the incubation solution and the duration
of bark tissue incubation (h) during the investigation period. The slope
is a relative measure of freezing injury, and is used here for a compa-
rison among the defoliation treatments (see text for details).
Figure 3. Index of injury (I
–30
) after artificial freezing (–30 °C) of
bark tissue from 20-year-old pedunculate oaks, which had been sub-
jected to different defoliation treatments (closed circles, control; open
squares, single defoliation; open triangles, repeated defoliation). High
values of I
–30
indicate low frost hardiness and vice versa. Different
lower case letters indicate significant differences between the treat-
ments on a given date. For the entire investigation period, I
–30
values
of repeatedly defoliated oaks were significantly higher than those of
control trees (indicated by different upper case letters in the legend;
ANOVA with repeated measurement analysis).
Defoliation, frost hardiness and sugars in oak 459
of raffinose and stachyose were considerably lower. The con-
centrations of the soluble sugars exhibited a typical course dur-
ing winter, increasing from November to January, February or
March, and decreasing thereafter (Fig. 5). The only exception
is sucrose whose concentration already was high in October,
and did not differ significantly among the sampling dates. Inter-
estingly, no significant differences were found between the
control trees and the repeatedly defoliated oaks except for raffi-
nose and stachyose, whose concentrations were lower in the
bark of the RD trees on some (stachyose) or all (raffinose) sam-
pling dates.
Of the cyclitols investigated in bark tissue, only quercitol
was present in concentrations that were high enough for quan-
titative evaluation. The quercitol concentrations were between
8 and 33 mmol·kg
–1
D.M. and exhibited an increase from the
beginning of October to mid-November, but then remained on
a more or less constant level until April (Fig. 6). On all sam-
pling dates but the last one (beginning of April), the quercitol
concentrations were significantly lowered in the repeatedly
defoliated oaks.
3.3. Relationships between chemical components
and frost hardiness
The total sugar concentrations were negatively correlated
with the I
–30
values (Tab. II). This was true for the entire inves-
tigation period from October to April as well as for the period
with the lowest temperatures (January–February), and indicates a
decrease in frost hardiness with decreasing sugar concentra-
tions (Fig. 7). For the whole study period, significant negative
correlations were also obtained for the single sugar compounds,
the strongest one for stachyose, the weakest for fructose
(Tab. II). Weaker, but still significant correlations were detected
between I
–30
, on the one hand, and N and C:N, on the other. In
January and February, these correlations were even closer in
contrast to those of glucose and fructose, whose concentrations
were rather constant during that period. No significant corre-
lation was found between I
–30
and quercitol.
The multiple correlation for predicting I
–30
from the concen-
trations of N and organic compounds, C:N ratios and defoliation
during the entire investigation period shows that 45% of the total
variation could be explained solely by stachyose concentration
Table II. Results of linear correlation analyses between the index of injury at –30 °C (I
–30
; as a measure of frost hardiness) of the bark tissue as
the dependent variable and concentrations of individual and total soluble sugars, quercitol, N and C:N as independent variables. The analyses
were calculated for the entire investigation period (October–April), and for the period with the lowest temperatures (January–February). n,
number of samples; r, correlation coefficient. Bold P values indicate significant correlation.
Compound
October–April January–February
nrPnrP
Stachyose 83 –0.668 < 0.0001 35 –0.535 0.0009
Glucose 95 –0.416 < 0.0001 35 –0.162 0.354
Sucrose 95 –0.407 < 0.0001 35 –0.351 0.039
Raffinose 95 –0.406 < 0.0001 35 –0.451 0.0065
Fructose 95 –0.393 < 0.0001 35 –0.312 0.068
Soluble sugars 95 –0.528 < 0.0001 35 –0.394 0.0191
N 95 –0.313 0.002 35 –0.513 0.0016
C:N 95 0.328 0.001 35 0.563 0.0004
Quercitol 95 –0.173 0.093 35 –0.280 0.1036
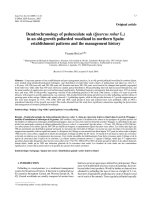
Figure 4. Nitrogen concentrations (a) and C:N ratios (b) of bark tissue from non-defoliated (control, closed circles) and repeatedly defoliated
(open triangles) 20-year-old pedunculate oaks. Asterisks indicate significant differences between the treatments on a given date. For the entire
investigation period, bark N concentrations of repeatedly defoliated oaks were significantly lower, and bark C:N ratios higher, than those of
control trees (indicated by different upper case letters in the legend; ANOVA with repeated measurement analysis).
460 F.M. Thomas et al.
(Tab. III). The multiple correlation coefficient was signifi-
cantly raised to 0.53 by including the cumulative amount of soluble
sugars into the model, but could not be significantly increased
by considering further variables.
4. DISCUSSION
Frost causes damage to plant tissue primarily by two mech-
anisms [4, 38, 51]: (1) by the formation of ice within cells and
(2) by cell dehydration due to the large difference in the water
potential between the unfrozen cell content and the intercellular
space, which contains extraplasmatic ice. Under natural con-
ditions, bark, leaves and vegetative buds of freezing-tolerant
angiosperms survive freezing temperatures lower than –10 °C
to –15 °C only if freezing is confined to the extracellular space
[38]. Damaging effects due to severe dehydration can be pre-
vented and, thereby, frost resistance increased by an accumu-
lation of cryoprotective compounds such as sugars in the cells.
The correlation of frost hardiness during winter with the con-
centration of sugars in the tissues, at least during frost harden-
ing, is a common feature of various organs of deciduous woody
species (rhizomes of Rubus chamaemorus [22]; shoots of Salix
viminalis, Cornus florida, Rhus typhina, Robinia pseudoacacia
[31, 33]). The marked seasonal course of the concentrations of
total and individual sugars (except for sucrose) with an increase
Figure 5. Concentrations of different soluble sugars, and of the cumulative amount of these sugars, in bark tissue of non-defoliated (control,
closed circles) and repeatedly defoliated 20-year-old pedunculate oaks (open triangles). Asterisks indicate significant differences between the
treatments on a given date. For the entire investigation period, raffinose and stachyose concentrations of repeatedly defoliated oaks were signi-
ficantly lower than those of control trees (indicated by different upper case letters in the legend; ANOVA with repeated measurement analysis).
Defoliation, frost hardiness and sugars in oak 461
until mid-winter and a decrease thereafter (Fig. 5), as well as
the significant correlations between sugar concentrations and
the index of frost injury (I
–30
; Fig. 7 and Tab. II) in the bark of
Quercus robur, fit those observations well. The fact that the
concentrations of sucrose only exhibited slight seasonal varia-
tions may be related to the sugar's fundamental role in carbo-
hydrate transport [1, 20]. Sugars can function as cryoprotect-
ants, which can non-specifically dilute the concentrations of
compounds that are potentially toxic to proteins and mem-
branes below the critical threshold of inactivation [39, 51]. In
addition to this “colligative” effect, a more specific “non-col-
ligative” effect has been postulated. This effect relies on inter-
actions between the cryoprotectant and the biomolecule, or on
the prevention of water crystallization in the vicinity of bio-
molecules [39]. In this regard, di- and trisaccharides seem to
be more effective than monosaccharides [11]. This might
explain the fact that, in the present investigation, the correlation
of I
–30
was closest with the concentration of the tetrasaccharide
stachyose; despite of its relatively low amount per unit dry matter.
In Q. robur, defoliation in spring causes loss of photosynt-
hate, resulting in a reduced formation of latewood [5, 36]. In
Q. petraea, a significant correlation was found between defo-
liation intensity and latewood increment [6]. Accordingly, the
relative growth increment in the stem diameter of our repeat-
edly defoliated (RD) pedunculate oaks was significantly lower
than that of the control trees (Tab. I).
Compared to the control trees, repeated defoliation resulted
in significantly higher I
–30
values, when the entire cold season
is considered: this indicates reduced frost hardiness. Although
the amount of photosynthate must have been considerably
reduced in the repeatedly defoliated oaks as was indicated by
the decrease in their growth increment, the concentrations of
the sugars that occur in the bark in higher quantities (fructose,
glucose, sucrose) remained unaffected. Thus, it can be con-
cluded that the decrease in frost hardiness of the RD trees was
not due to a reduction in the concentrations of these sugar com-
pounds. In contrast, the concentrations of raffinose and stachyose
that occur in relatively low amounts in the bark were significantly
Table III. Results of multiple correlation analysis among the index of injury at –30 °C (I
–30
; as a measure of frost hardiness) of the bark tissue
as the dependent variable, and concentrations of fructose, glucose, raffinose, stachyose, sucrose, soluble sugars (sum of fructose, glucose, raf-
finose, stachyose and sucrose), quercitol, N, C:N ratio and defoliation as predictor variables (selected models), computed for the entire investi-
gation period. Number of samples = 83. The increase of the multiple determination coefficient R
2
with stepwise inclusion of additional predic-
tor variables is shown. All R
2
values are significant at P < 0.001. Different lower case letters indicate a significant increase in R
2
by including
additional variables into the model.
Predictor variable R
2
Stachyose 0.446 a
Stachyose, soluble sugars 0.531 b
Stachyose, soluble sugars, fructose 0.548 b
Stachyose, soluble sugars, fructose, C:N 0.552 b
Stachyose, soluble sugars, fructose, C:N, N 0.568 b
Stachyose, soluble sugars, fructose, C:N, N, quercitol, raffinose, glucose, defoliation 0.575 b
Figure 6. Quercitol concentrations in the bark of non-defoliated (con-
trol, closed circles) and repeatedly defoliated 20-year-old pedunculate
oaks (open triangles). Asterisks indicate significant differences
between the treatments on a given date. For the entire investigation
period, quercitol concentrations of repeatedly defoliated oaks were
significantly lower than those of control trees (indicated by different
upper case letters in the legend; ANOVA with repeated measurement
analysis).
Figure 7. Index of injury after artificial freezing (–30 °C) plotted
against the total sugar concentration of bark tissue from 20-year-old
pedunculate oaks. Mean values of each sampling date for repeatedly
defoliated (open triangles) and control trees (closed circles). The
regression (exponential decay) was calculated for the combined data
set of both treatments (r
2
= 0.527; P < 0.002).
462 F.M. Thomas et al.
reduced on some (stachyose) or all (raffinose) measurement
dates. A reduction in the concentrations of these sugars could
have impaired the frost hardiness of the RD trees since those
compounds have specific cryoprotective features (see above),
and, additionally, since they can enhance the cryoprotective
effect of sugars such as sucrose by inhibiting their crystalliza-
tion. Such an effect has been found for raffinose [10]. Raffinose
concentrations, which were found to exhibit pronounced dif-
ferences between minimum values in summer and maximum
values in winter [43], have also been linked to frost hardiness
in the stem tissue of Cornus sericea [3], in the leaves of Euca-
lyptus gunnii [4] and in the apical buds of Picea abies [28].
According to Stushnoff et al. (1997) [43], raffinose and stach-
yose are generally associated with cold hardiness, particularly
in cold-hardy woody plant taxa. In our study, the dates of
reduced raffinose and stachyose concentrations in the bark of
the RD trees include the period, in which the frost hardiness was
significantly lowered in these trees (cf. Figs. 3 and 5). This
points towards a defoliation-induced reduction in the concen-
trations of those sugars as a cause of diminished frost hardiness.
Cyclitols have also been assumed to act as cryoprotectants
[34]. In Q. robur, quercitol is the dominating cyclitol. It is
found in leaves, twigs, bark and buds and contributes up to 65%
to the neutral fraction and up to 3.3% to dry matter [35]. In con-
trast to other cyclitols such as ononitol, pinitol and quebrachi-
tol, the cryoprotective effect of quercitol does not seem to be
a specific, non-colligative one [32]; thus, its effect is likely to
depend on its concentration. In our study, repeated defoliation
significantly reduced the quercitol concentration of the bark on
all but the last measurement date (at the beginning of April;
Fig. 6). However, there were no significant correlations between
the frost hardiness (I
–30
values) of the bark tissue and its dry
matter-related quercitol content. Therefore, we have no clear
evidence that a reduction in the quercitol concentration contrib-
utes to the defoliation-induced decrease in frost hardiness.
Nitrogen-containing compounds may also be involved in
frost hardiness. Although there is, in general, no close relation-
ship between the amino acid concentration and frost hardiness,
particular amino acids such as arginine and proline can play an
important role in freezing tolerance [38, 51]. In addition, the
occurrence of soluble cryoprotective plant proteins in freezing-
tolerant plants has been postulated [17]. Cryoprotective proteins
have been found in Arabidopsis thaliana [42] and Hordeum
vulgare [9]. In our study, N concentrations were significantly
lower in the bark of the RD trees than in the control oaks
(Fig. 4), and were lower than N concentrations in the bark of
the adult Q. robur trees (5.43 ±0.24 mg·g
–1
D.M.) that were
adequately supplied with N as determined by foliar N concen-
trations [45]. In the bark of mature beech trees (Fagus sylvatica)
growing on acidic soils in Southern Sweden, the range of N con-
centrations also was slightly higher (5.5–7.0 mg·g
–1
D.M.;
[21]). In our investigation, the decrease in N concentration in
the bark of the RD trees may have been caused by reduced N
uptake as a consequence of decreased fine root production after
defoliation – a reduction in fine-root biomass after defoliation
of Q. robur has been found, e.g., by Block et al. (1995) [7] and
Gieger and Thomas (2002) [14]. Although the overall correla-
tions between N or C:N, respectively, and I
–30
were not very
tight, and although N and C:N did not contribute much to
explain the variation of the multiple correlation among chem-
ical components and I
–30
, our results might be a first hint that
a reduction in the concentration of nitrogenous compounds is
involved in the defoliation-induced decrease in frost hardiness.
More detailed analyses are necessary to elucidate this role of
nitrogenous compounds.
We conclude that the significantly reduced frost hardiness
of the bark of the repeatedly defoliated pedunculate oaks is
mainly due to the decrease in the concentrations of the sugars
raffinose and stachyose, which are generally able to increase
frost hardiness by means of specific non-colligative effects
even at low concentrations. In addition, the decrease in N com-
pounds may have contributed to the reduction in frost hardi-
ness, but this has to be corroborated by further studies. The
decrease in the concentrations of all these compounds lies
within a period of significantly reduced frost hardiness in the
repeatedly defoliated trees, and within a period in which sub-
zero temperatures down to –24 °C did occur in severe winters
in that region in the past [19] – such temperatures have not been
reached during our study and, therefore, freezing injury to the
oaks did not occur. Through the reduction in the concentrations
of sugars (particularly those of raffinose and stachyose) and,
perhaps, through an additional reduction of the concentrations
of N compounds, repeated defoliation decreases the capability
of the bark to acclimatize to winter frost. Thus, the hypothesis
that a defoliation-induced reduction of frost hardiness of the
bark is part of the causal complex in the occurrence of increased
oak mortality [47] can still be considered valid.
Acknowledgments: We thank Dr. Günter Hartmann and Dipl
Forstw. Ratburg Blank, Forest Research Station of Lower Saxony,
Dept. Forest Protection, for their co-operation in defoliating the trees;
Mr. Schäfer-Wildenberg from tree nursery H.G. Rahte (Wietze, Lower
Saxony) for providing the research facilities on the ground of the nurs-
ery; Dr. Eberhard Fritz, Institute of Forest Botany, University of Göt-
tingen, for his kind support in lyophilization of the bark samples, and
M.Sc. Sabine Maringer, Department of Chemical Physiology of Plants,
Institute of Ecology and Conservation Biology, University of Vienna,
for valuable assistance with gas chromatography.
REFERENCES
[1] Alaoui-Sossé B., Parmentier C., Dizengremel P., Barnola P., Rhyth-
mic growth and carbon allocation in Quercus robur. 1. Starch and
sucrose, Plant Physiol. Biochem. 32 (1994) 331–339.
[2] Alberdi M., Corcuera L.J., Cold acclimation in plants, Phytochem-
istry 30 (1991) 3177–3184.
[3] Ashworth E.N., Stirm V.E., Volenec J.J., Seasonal variations in sol-
uble sugars and starch within woody stems of Cornus sericea L.,
Tree Physiol. 13 (1993) 379–388.
[4] Beck E., Hansen J., Heim R., Schäfer C., Vogg G., Leborgne N.,
Teulieres C., Boudet A.M., Cold hardening and dehardening of trees,
in: Sandermann H. Jr., Bonnet-Masimbert M. (Eds.), Eurosilva –
Contribution to forest tree physiology, INRA, Paris, 1994, pp. 171–
193.
[5] Blank R., Ringporigkeit des Holzes und häufige Entlaubung durch
Insekten als spezifische Risikofaktoren der Eichen, Forst Holz 52
(1997) 235–242.
[6] Blank R., Riemer T., Quantifizierung des Einflusses blattfressender
Insekten auf den Spätholzzuwachs der Eiche in Nordwestdeutsch-
land, Forst Holz 54 (1999) 569–576.
[7] Block J., Delb H., Hartmann G., Seemann D., Schröck H.W.,
Schwere Folgeschäden nach Kahlfraß durch Schwammspinner im
Bienwald, Allg. Forst Z. / Der Wald 50 (1995) 1278–1281.
Defoliation, frost hardiness and sugars in oak 463
[8] BMELF (Bundesministerium für Ernährung, Landwirtschaft und
Forsten) (Ed.), Bundesweite Bodenzustandserhebung im Wald
(BZE) – Arbeitsanleitung, BMELF, Bonn, 1990.
[9] Bravo L.A., Gallardo J., Navarrete A., Olave N., Martínez J., Alberdi
M., Close T.J., Corcuera L.J., Cryoprotective activity of a cold-
induced dehydrin purified from barley, Physiol. Plant. 118 (2003)
262–269.
[10] Caffrey M., Fonseca V., Leopold A.C., Lipid-sugar interactions,
Plant Physiol. 86 (1988) 754–758.
[11] Crowe J.H., Carpenter J.F., Crowe L.M., Anchordoguy T.J., Are
freezing and dehydration similar stress vectors? A comparison of
modes of interaction of stabilizing solutes with biomolecules, Cry-
obiology 27 (1990) 219–231.
[12] Deutscher Wetterdienst, Monatlicher Witterungsbericht, Deutscher
Wetterdienst, Offenbach, Germany, 2001.
[13] Flint H.L., Boyce B.R., Beattie D.J., Index of injury – a useful
expression of freezing injury to plant tissues as determined by the
electrolytic method, Can. J. Plant Sci. 47 (1967) 229–230.
[14] Gieger T., Thomas F.M., Effects of defoliation and drought stress
on biomass partitioning and water relations of Quercus robur and
Quercus petraea, Basic Appl. Ecol. 3 (2002) 171–181.
[15] Gray G.R., Chauvin L P., Sarhan F., Huner N.P.A., Regulation of
cold acclimation, in: Li P.H., Chen T.H.H. (Eds.) Plant Cold Hardi-
ness – Molecular Biology, Biochemistry, and Physiology, Plenum
Press, New York and London, 1997, pp. 181–190.
[16] Große-Schulte T., Zusammenhänge zwischen Quercit-Speicherung
und Frosthärte in der Gattung Quercus, Diploma Thesis, Univ. Mün-
ster, Institute of Plant Ecology, 1995.
[17] Guy C.L., Cold acclimation and freezing stress tolerance: role of pro-
tein metabolism, Annu. Rev. Plant Physiol. Plant Mol. Biol. 41
(1990) 187–223.
[18] Hartmann G., Ursachenanalyse des Eichensterbens in Deutschland
– Versuch einer Synthese bisheriger Befunde, Mitt. Biol. Bundes-
anst. Land- u. Forstwirtsch. Berlin-Dahlem 318 (1996) 125–151.
[19] Hartmann G., Blank R., Winterfrost, Kahlfraß und Prachtkäferbefall
als Faktoren im Ursachenkomplex des Eichensterbens in Nord-
deutschland, Forst Holz 47 (1992) 443–452.
[20] Heizmann U., Kreuzwieser J., Schnitzler J P., Brüggemann N.,
Rennenberg H., Assimilate transport in the xylem sap of pedunculate
oak (Quercus robur) saplings, Plant Biol. 3 (2001) 132–138.
[21] Jönsson A.M., Mineral nutrients of beech (Fagus sylvatica) bark in
relation to frost sensitivity and soil treatments in southern Sweden,
Ann. For. Sci. 57 (2000) 1–8.
[22] Kaurin Å., Junttila O., Hansen J., Seasonal changes in frost hardiness
in cloudberry (Rubus chamaemorus) in relation to carbohydrate con-
tent with special reference to sucrose, Physiol. Plant. 52 (1981) 310–
314.
[23] Kolb T.E., Steiner K.C., Barbour H.F., Seasonal and genetic varia-
tions in loblolly pine cold tolerance, For. Sci. 31 (1985) 926–932.
[24] Kosola K.R., Dickmann D.I., Paul E.A., Parry D., Repeated insect
defoliation effects on growth, nitrogen acquisition, carbohydrates,
and root demography of poplars, Oecologia 129 (2001) 65–74.
[25] Landmann G., Becker M., Delatour C., Dreyer E., Dupouey J L.,
1993. Oak dieback in France: historical and recent records, possible
causes, current investigations, in: Bayerische Akademie der Wissen-
schaften (Ed.) Zustand und Gefährdung der Laubwälder, Rundge-
spräche der Kommission für Ökologie 5, F. Pfeil, Munich, Germany,
1993, pp. 97–113.
[26] Li C., Junttila O., Ernstsen A., Heino P., Palva E.T., Photoperiodic
control of growth, cold acclimation and dormancy development in
silver birch (Betula pendula) ecotypes, Physiol. Plant. 117 (2003)
206–212.
[27] Li P.H., Chen T.H.H., Plant Cold Hardiness – Molecular Biology,
Biochemistry, and Physiology, Plenum Press, New York and London,
1997.
[28] Lipavská H., Svobodová H., Albrechtová J., Annual dynamics of the
content of non-structural saccharides in the context of structural
development of vegetative buds of Norway spruce, J. Plant Physiol.
157 (2000) 365–373.
[29] Lobinger G., Zusammenhänge zwischen Insektenfraß, Witterungs-
faktoren und Eichenschäden, Bayerische Landesanstalt für Wald
und Forstwirtschaft, Freising, Germany, 1999.
[30] Murray M.B., Cape J.N., Fowler D., Quantification of frost damage
in plant tissues by rates of electrolyte leakage, New Phytol. 113
(1989) 307–311.
[31] Ögren E., Fall frost resistance in willows used for biomass produc-
tion. II. Predictive relationships with sugar concentration and dry
matter content, Tree Physiol. 19 (1999) 755–760.
[32] Orthen B., Popp M., Cyclitols as cryoprotectants for spinach and
chickpea thylakoids, Environ. Exp. Bot. 44 (2000) 125–132.
[33] Parker J., Seasonal changes in cold resistance and free sugars of
some hardwood tree barks, For. Sci. 8 (1962) 255–262.
[34] Popp M., Smirnoff N., Polyol accumulation and metabolism during
water deficit, in: Smirnoff N. (Ed.) Environment and plant metabo-
lism – Flexibility and acclimation, Bios Scientific Publishers,
Oxford, 1995, pp. 199–215.
[35] Popp M., Lied W., Bierbaum U., Gross M., Große-Schulte T., Hams
S., Oldenettel J., Schüler S., Wiese J., Cyclitols – Stable osmotica
in trees, in: Rennenberg H., Eschrich W., Ziegler H. (Eds.), Trees –
Contributions to modern tree physiology, Backhuys Publishers, Leiden,
The Netherlands, 1997, pp. 257–270.
[36] Rubtsov V.V., Influence of repeated defoliations by insects on wood
increment in common oak (Quercus robur L.), Ann. Sci. For. 53
(1996) 407–412.
[37] Sachs L., Applied statistics – A handbook of techniques, 2nd ed.,
Springer-Verlag, New York, 1984.
[38] Sakai A., Larcher W., Frost survival of plants, Ecological Studies
62, Springer-Verlag, Berlin, 1987.
[39] Santarius K.A., The mechanism of cryoprotection of biomembrane
systems by carbohydrates, in: Li P.H., Sakai A. (Eds.), Plant cold
hardiness and freezing stress – Mechanisms and crop implications,
Vol. 2, Academic Press, New York, 1982, pp. 475–486.
[40] Shapiro S.S., Wilk M.B., An analysis of variance test for normality
(complete samples), Biometrika 52 (1965) 591–611.
[41] Siwecki R., A decline of oak forests caused by abiotic and biotic fac-
tors and attempts at biological research in this syndrome, Arbor.
Korn. 34 (1989) 161–169.
[42] Steponkus P.L., Uemura M., Joseph R.A., Gilmour S.J., Thomashow
M.F., Mode of action of the COR15a gene on the freezing tolerance
of Arabidopsis thaliana, Proc. Natl. Acad. Sci. USA 95 (1998)
14570–14575.
[43] Stushnoff C., Seufferfeld M.J., Creegan T., Oligosaccharides as
endogenous cryoprotectants in woody plants, in: Li P.H., Chen
T.H.H. (Eds.), Plant cold hardiness – Molecular biology, biochem-
istry, and physiology, Plenum Press, New York and London, 1997,
pp. 301–309.
[44] Thomas F.M., Ahlers U., Effects of excess nitrogen on frost hardi-
ness and freezing injury of above-ground tissue in young oaks
(Quercus petraea and Q. robur), New Phytol. 144 (1999) 73–83.
[45] Thomas F.M., Blank R., The effect of excess nitrogen and of insect
defoliation on the frost hardiness of bark tissue of adult oaks, Ann.
Sci. For. 53 (1996) 395–406.
[46] Thomas F.M., Blank R., Hartmann G., Der Einfluß von Stammex-
position, Stickstoff-Status und Blattfraß auf die Frosthärte des
Bastes von Alteichen, Verh. Ges. Ökol. 26 (1996) 153–160.
[47] Thomas F.M., Blank R., Hartmann G., Abiotic and biotic factors and
their interactions as causes of oak decline in Central Europe, For.
Pathol. 32 (2002) 277–307.
[48] Van den Burg J., Foliar analysis for determination of tree nutrient
status – a compilation of literature data, Rapport No. 414, Rijksin-
stituut voor Onderzoek in de Bos- en Landschapsbouw “De Dorsch-
kamp”, Wageningen, The Netherlands, 1985.
[49] Van den Burg J., Foliar analysis for determination of tree nutrient
status – a compilation of literature data. 2. Literature 1985–1989,
Rapport No. 591, “De Dorschkamp”, Institute for Forestry and
Urban Ecology, Wageningen, The Netherlands, 1990.
[50] Wargo P.M., Consequences of environmental stress on oak: predis-
position to pathogens, Ann. Sci. For. 53 (1996) 359–368.
[51] Xin Z., Browse J., Cold comfort farm: the acclimation of plants to
freezing temperatures, Plant Cell Environ. 23 (2000) 893–902.