Báo cáo lâm nghiệp: "Interannual variation of soil respiration in a beech forest ecosystem over a six-year study" pps
Bạn đang xem bản rút gọn của tài liệu. Xem và tải ngay bản đầy đủ của tài liệu tại đây (330.06 KB, 7 trang )
499
Ann. For. Sci. 61 (2004) 499–505
© INRA, EDP Sciences, 2004
DOI: 10.1051/forest:2004044
Original article
Interannual variation of soil respiration in a beech forest ecosystem
over a six-year study
Daniel EPRON
a,b
*, Jérome NGAO
c
, André GRANIER
c
a
Laboratoire de Biologie et Écophysiologie, Université de Franche-Comté, Pôle Universitaire, BP 71427, 25211 Montbéliard Cedex, France
b
Current address: Université Henri Poincaré – UMR 1137 INRA UHP, Écologie et Écophysiologie forestières, BP 239,
54506 Vandœuvre-les-Nancy Cedex, France
c
UMR INRA UHP Écologie et Écophysiologie Forestières, Centre INRA de Nancy, 54280 Champenoux, France
(Received 3 March 2003; accepted 29 September 2003)
Abstract – Soil respiration was measured for six years from June 1996 to December 2001 in order to investigate both seasonal and interannual
variations in a young beech forest in North Eastern France (Hesse forest). Soil respiration exhibited pronounced seasonal variations that clearly
followed the seasonal changes in soil temperature (T) and soil water content (W). An exponential function (y = AWe
BT
) fitted the data well, and
including a linear effect of soil water content on soil respiration strongly improved the predictive capacity of the model. However, the increase
in residuals when plotted against the date of measurements clearly evidenced that changes in soil temperature or soil water content failed to
predict the increase in soil respiration with time, highlighting that the interannual variation in soil respiration was not solely due to direct climate
effects. When fitted against single year data, the temperature sensitivity coefficient (B) was very close for both years while the pre-exponential
factor (A) for 1997 was half of those for 2001. The model was further run over the entire data set, allowing A to vary from one year to another.
There was a close agreement between predicted and observed soil respiration and A exhibited a linear trend with time with a high value for 1999
after thinning.
carbon flux / beech / soil respiration / interannual variability / thinning / Fagus sylvatica
Résumé – Variation interannuelle de la respiration du sol dans une hêtraie au cours de six années de mesure. La respiration du sol a été
mesurée pendant six années de juin 1996 à décembre 2001 pour analyser les variations saisonnières et interannuelles dans une jeune hêtraie du
nord-est de la France (forêt de Hesse). La respiration du sol montrait des variations saisonnières marquées, reflétant clairement les changements
saisonniers de la température (T) et du contenu en eau du sol (W). Une fonction exponentielle (y=AWe
BT
) s’ajustait correctement sur les
données, et le fait d’inclure un effet linéaire du contenu en eau du sol augmentait considérablement les capacités prédictives du modèle.
Néanmoins, l’augmentation des résidus lorsqu’ils étaient tracés en fonction de la date de mesure montrait clairement que les changements de
température et de contenu en eau du sol ne permettaient pas de prédire les variations de respiration du sol au cours du temps, soulignant le fait
que les variations interannuelles de la respiration du sol n’étaient pas uniquement dues à des effets directs du climat. Lorsqu’ils étaient ajustés
sur les données d’une seule année, le coefficient de sensibilité à la température (B) était très proche pour les deux années de mesures alors que
le facteur pré-exponentiel (A) était deux fois plus faible en 1997 qu’en 2001. Lorsque le modèle est appliqué sur l’ensemble du jeu de données,
en permettant à A de varier d’une année sur l’autre, la respiration prédite était très proche de la respiration mesurée, et A montrait une
augmentation linéaire avec le temps, avec une valeur élevée en 1999 après une éclaircie.
flux de carbone / hêtre / respiration du sol / variabilité interannuelle / éclaircie / Fagus sylvatica
1. INTRODUCTION
Carbon sequestration in forested ecosystems often results
from a small difference between photosynthetic carbon fixation
and ecosystem respiration [15, 38], and soil respiration is the
main component of ecosystem respiration [15, 21].
Soil respiration is known to exhibit a high spatial and tem-
poral variability. Spatial heterogeneity of soil respiration has
often been described and related to either root biomass, micro-
bial biomass, litter amount, soil characteristics or site topogra-
phy [13, 16, 41]. Seasonal variations of soil respiration were
often associated with either changes in soil temperature [1, 8,
12, 13, 26] or changes in both soil temperature and soil water
content [5, 9, 14, 16, 22, 32, 41].
Up to now, only a few numbers of studies have deal with the
interannual variability of soil respiration. Interannual variations
* Corresponding author:
500 D. Epron et al.
in soil respiration may result from direct effects of environmen-
tal factors like soil temperature or soil water content that could
exhibit year to year variations. Indeed, occurrence of a summer
drought can account for a reduced soil respiration [2, 9, 35, 40].
Alternatively, changes in ecosystem processes due to long-term
climate effects, forest ageing or disturbance might also account
for interannual variations in soil respiration. Indeed, it has
recently been shown that summer carbon efflux has doubled
over a quarter century in four forest ecosystems in the southern
Appalachians [4]. Long lasting measurement series are still
required to improve our ability to scale up measurements made
over a limited period to provide a meaningful description of the
long-term dynamics of soil carbon.
This paper presents the results obtained after six years of
measurements in a young beech stand. Soil respiration was
measured from June 1996 to December 2001, together with soil
temperature and soil water content. In a previous paper [9], we
showed that soil respiration exhibited pronounced seasonal
variations, which did not solely reflect seasonal changes in soil
temperature. Especially, strong differences in soil respiration
between summer 1996 and summer 1997 were at least partly
explained by an inhibition of soil respiration at low soil water
content. The objective was now to investigate both seasonal and
interannual variability of soil respiration. The ability of an
empirical model using soil temperature and soil water content
as driving variables to predict both seasonal and interannual
changes in soil respiration was evaluated. Changes in model
parameters between years would highlight the contribution of
changes in ecosystem characteristics on the interannual varia-
bility of soil respiration.
2. MATERIALS AND METHODS
2.1. Site characteristics
The experimental plot (Carboeuroflux site) covers 0.6 ha and is
located in the central part of a 65 ha zone in the state forest of Hesse
(France, 48° 40’ N, 7° 05’ E, elevation 300 m). It is dominated by
beech (Fagus sylvatica). Other tree species are Carpinus betulus, Be-
tula alba, Fraxinus excelsior, Prunus avium, Quercus petraea, Larix
decidua. The understorey vegetation is very sparse. The plot was
thinned during winter 1994/1995 and during winter 1998/1999 as
shown by huge changes in leaf area index (Tab. I). Trees were about
30 year-old at the beginning of the measurements in 1996. Low values of
ground area are characteristic of young, frequently thinned plots. Var-
iations of stand and climate characteristics during the six years of
measurements are given in Table I. Soil is a gleyic luvisol according to
the F.A.O. classification (clay 22%, loam 70% and sand 8%). The pH of
the top soil (0–30 cm) is 4.9 with a C/N of 12.2 and an apparent density
of 0.85 kg dm
–3
. Water holding capacity was about 0.40 m
3
m
–3
.
Mineral soil is covered with mull type humus. Six sub-plots of about
100 m
2
each were randomly chosen within the experimental plot for
soil respiration measurements [9].
2.2. Measurements of soil respiration
Soil respiration was measured using the Li 6000-09 (LiCor Inc,
Lincoln, NE, USA) soil respiration chamber in which the increase of
the CO
2
concentration was recorded with the Li 6250 infrared gas ana-
lyser (LiCor Inc) as already described [9, 10]. The chamber edge is
inserted in the soil to a depth of 1.5 cm. The CO
2
concentration within
the soil respiration chamber was dropped 15 µmol mol
–1
below ambi-
ent, and the increase in the CO
2
concentration was recorded until it
raised by 30 µmol mol
–1
. For each day of measurements, twelve
records were done in each sub-plot, leading to a total of 72 measure-
ments collected over the experimental plot during a 8-hour period from
8 am to 4 pm. This high number of samples allowed the confidence
intervals of the mean at p = 0.05 to be within 10% of the mean despite
a large spatial variability. Measurements were initiated in June 1996
and were continued until December 2001. Measurements frequency
was not constant over the whole six-year period. Soil respiration data
were collected from June to November 1996 (5 days), from January
to November in 1997 (16 days), in April, June, August and October
1998 (4 days), in March, April, June, August and October 1999
(5 days), in April and August 2000 (2 days) and from March to December
in 2001 (9 days). The same operator using the same protocol did meas-
urements during the whole period with the same equipment. The gas
analyser was calibrated before each sampling days with CO
2
free air
and a 393 µmol mol
–1
CO
2
(± 2%) certified standard (Alpha gaz, Air
Liquide, France).
2.3. Measurements of soil temperature and soil water
content
Soil temperature was monitored simultaneously with soil respiration
using a copper/constantan thermocouple penetration probe (Li6000-
09 TC, LiCor Inc) inserted in the soil to a depth of 10 cm in the vicinity
of the soil respiration chamber. Volumetric water content of the soil
at 10 cm depth was measured with a neutron probe (NEA, Denmark)
in 8 aluminium access tubes at 1-week to 3-week intervals. A poly-
ethylene reflector and specific calibration curve were used for these
sub-surface measurements.
2.4. Data analysis
Daily means of soil respiration, soil water content and soil temper-
ature were used for examining seasonal and interannual trends. Non-
linear regression were performed with statview 5 (SAS Institute inc.
NC, USA) using either an exponential function (R=Ae
BT
), an Arrhe-
nius function (R=Ae
–B/T
) or a power function (R=AT
B
). These mod-
els were fitted through soil respiration (R) and soil temperature (T).
These models were also fitted using soil water content (W) rather than
soil temperature alone to account for a linear decrease in soil respira-
tion with decreasing soil water content. Indeed, it has already been
shown that soil respiration was best predicted when soil water content
was included in the model (R = AWe
BT
, [9]). These models were first
fitted on the whole data set. Criteria for a valid model were a maximum
coefficient of determination (r
2
), a minimum root mean squared error
(RMSE) and no bias in the distribution of the residues. This latter point
was assessed by testing the nullity of the slope of the regression
between residuals and soil temperature. The exponential function was
selected (see results) and it was further fitted on single year data for
1997 and 2001. There were enough observations for these two years
to support separate analyses. Finally, the exponential model was fitted
using non-linear least square regression curves (Sigma Plot 4.1, SPPS
Inc., IL, USA) over the entire data set, allowing the pre-exponential
factor to vary from year to year (A
Y
, Y varying from 1996 to 2001).
This was achieved by adding a dummy variable (D
Y
) coded 1 for year
Y and coded 0 for other years (R = Σ A
Y
WD
Y
e
BT
). Mean values of soil
respiration and models parameters are given with their standard error.
3. RESULTS
Soil respiration exhibited pronounced seasonal variations
with minimal values in winter and high values in early summer
Interannual variation of soil respiration 501
(Fig. 1). Soil respiration rates were low during the three first
years (1996–1998), ranging from 0.4 µmol m
–2
s
–1
in February
1997 to 4.1 µmol m
–2
s
–1
during August 1997. In contrast,
higher soil respiration rates were recorded during the three fol-
lowing years (1999–2001) with a maximal rate and a minimal
rate of 8.1 and 1.7 µmol m
–2
s
–1
respectively.
These year-to-year differences in soil respiration were high-
lighted when 1997 data are compared with 2001 data (Fig. 2).
Seasonal courses of soil respiration clearly followed the sea-
sonal changes in soil temperature and low soil water content
due to low rainfalls resulted in lower soil respiration rate in late
summer than in early summer. Soil temperature followed a similar
cycle for both years and the annual means of daily soil temper-
ature at 10-cm depth in 2001 was 0.4 °C higher than in 1997.
In contrast, soil water content decreased earlier in 2001 than in
Table I. Stand and climate characteristics of the Hesse forest during the six years of measurements.
1996 1997 1998 1999 2000 2001
LAI (m
2
m
–2
)
a
5.7 5.59 7.36 4.84 7.33 7.37
Stand density (stems ha
–1
) 4589 4428 4445 3331 3263 3178
Ground area (m
2
ha
–1
) 19.2 20.6 22.4 18.1 19.3 20.4
Average tree height (m) 12.7 14.0
Average stem diameter (cm) 21.3 22.1 23.0 23.6 24.6 25.7
Average air temperature (°C) 9.06 9.77 9.72 10.14 10.86 10.10
Average soil temperature (°C) 8.81 9.55 9.37 10.11 10.30 9.87
Cumulative annual rainfall (mm) 560 730 828 903 887 770
Cumulative summer rainfall (mm) 285 391 378 460 525 480
a
Estimated from litterfall collections.
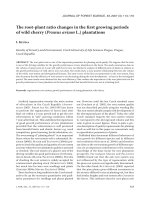
Figure 1. Soil respiration (A) and residual error term of predicted
soil respiration using an exponential model (B) as a function of time.
Vertical bars, when larger than the symbol, indicate the standard
error of the mean of soil respiration (n =72).
Figure 2. Seasonal courses of (A) daily mean soil temperature (T) at
10 cm depth, (B) mean soil volumetric water content (W) in the top
10 cm and (C) mean soil respiration (R) for 1997 (closed symbols)
and 2001 (open symbols). Vertical bars, when larger than the sym-
bol, indicate the standard error of the mean of soil respiration
(n = 72).
502 D. Epron et al.
1997 due to lower rainfalls in early summer. Soil water content
reached similar minimal values below 0.2 m
3
m
–3
during both
summers. As a consequence, soil respiration followed a similar
trend until the end of July (day 210), but with higher rates in
2001 than in 1997. Large discrepancies in August and early
September can be ascribed to the earlier drought in 2001.
Exponential, power and Arrhenius-type functions were fit-
ted over the entire set of data, using soil temperature as a driving
variable and either soil respiration or the ratio of soil respiration
over soil water content as dependent variables (see Fig. 3 for
the exponential one). The three function fitted the data well and
including a linear effect of soil water content on soil respiration
strongly improved the predictive capacity of the three kind of
model (r
2
increased from 0.56–0.59 to 071–0.72, Tab. II).
Analysis of residual (slope of the regression between residuals
and soil temperature) showed that the power function tend to
overestimate soil respiration at high temperature and to under-
estimate soil respiration at low temperature. Both the Arrhenius
function and the exponential function seem to provide an unbi-
ased estimate of soil respiration. However, when the residuals
of these models were plotted against the date of measurements
(Fig. 1 for the exponential function), the observed increase in
residuals clearly evidenced that changes in soil temperature or
soil water content failed to predict the increase in soil respira-
tion with time. Residuals during the 1999–2001 period were all
positive while most of them were negative before that period.
However, a linear trend was already evident during the 1996–
1999 period, while no clear trend was observed later.
When plotted against single year data, the model (y = AWe
BT
)
fitted the data very well with r
2
values of 0.92 in 1997 and 0.95
in 2001 (Fig. 4). The temperature sensitivity coefficient (B) was
very close for both years (0.154 ± 0.012 and 0.156 ± 0.013 for
Table II. Predicted model parameters (A, B), determination coefficients (r
2
), root mean squared error (RMSE) and the slope of model residuals
versus soil temperature for empirical models describing the relationship between soil respiration (R) and either soil temperature at 10 cm depth
(T) or soil temperature and soil water content in the top 10 cm (W).
Function Equation ABr
2
RMSE Slope
Exponential R = Ae
BT
R = AWe
BT
0.588
1.206
0.121
0.155
0.56
0.72
1.46
1.34
–0.004
–0.001
Arrhenius R = Ae
-B/T
R = AWe
-B/T
1.90 10
15
7.81 10
19
9.77 10
3
1.25 10
4
0.56
0.72
1.46
1.34
–0.003
–0.001
Power R = AT
B
R = AWT
B
0.170
0.273
1.117
1.384
0.59
0.71
1.41
1.33
0.033
0.050
p-values were below 0.001 for all non linear regressions (n = 41).
Figure 3. Relationship (A) between daily mean soil respiration (R)
and mean soil temperature (T) at a depth of 10 cm and (B) between
the ratio of mean soil respiration and mean soil volumetric water con-
tent in the top 10 cm (R/W). R/W is an algebraic manipulation of the
model R = AWe
BT
allowing a two-dimension representation of the
data. Data are from Figure 1. Lines are the best fit of an exponential
function (r
2
values were 0.56 in A and 0.72 in B, n = 41, p < 0.001).
Figure 4. Relationship between the ratio daily mean soil respiration
and mean soil volumetric water content in the top 10 cm (R/W) and
mean soil temperature (T) at a depth of 10 cm for 1997 (closed sym-
bols) and 2001 (open symbols). Data are from Figure 2. The line is
the best fit of an exponential function (r
2
= 0.92, n =16, p < 0.001 in
1997 and r
2
= 0.95, n = 9, p < 0.001 in 2001).
Interannual variation of soil respiration 503
1997 and 2001 respectively). In contrast, the pre-exponential
factor (A) has doubled from 1997 to 2001 (0.91 and 1.81 respec-
tively), and their 95% confidence intervals did not overlap
(upper limit for 1997 and lower limit for 2001 being respec-
tively 1.21 and 1.23).
There were not enough points for the four other years for fit-
ting the exponential function (2 to 5 days of measurements
only). Taking advantage of a very similar B values in 1997 and
2001, the model was run over the entire data set, adjusting a
single B value for all years (0.158 ± 0.009), but allowing the
pre exponential factor to vary from one year to another. There
was a close agreement between predicted and observed soil res-
piration (r
2
= 0.93, RMSE = 0.38) which was better than those
observed using a single A value for all years (r
2
= 0.72, RMSE =
1.34), as shown in Figure 5. Interestingly, the pre-exponential
factor (A) exhibited a linear trend with time with a high value
for 1999 after thinning (Fig. 6).
4. DISCUSSION
Exponential relationships have frequently and successfully
been used to predict soil respiration from soil temperature [3,
5, 9]. It has been reported that an exponential function would
systematically lead to underestimated fluxes at low tempera-
tures and overestimated fluxes at high temperatures, and suggested
that soil respiration was better described by an Arrhenius-type
relationships [25]. In this study, all models fit reasonably well
with the data and the exponential one was chosen thereafter.
Several functions are available to describe the effects of soil
water content on soil respiration [11, 16, 20, 22]. In this site,
including a linear effect of soil water content in the function
used to predict soil respiration from soil temperature greatly
enhance the predictive efficiency of the model, as already
shown [9]. Using more complex models would have unneces-
sarily increased the number of model parameters without a sig-
nificant gain in the explained variance. The B values obtained
on single year data (1997 and 2001), and on the whole data set
with either a single or a variable pre-exponential factor, were
almost similar and corresponds to a Q
10
value of 4.7–4.8 (Q
10
=
e
10B
). This is a rather high value that is however within the
range of published values for temperate forest ecosystems [2,
5, 9]. Indeed, the temperature sensitivity coefficient is though
to reflect both a direct sensitivity of the involved processes as
well as the change in size and activity of the respiring compo-
nents (i.e. root and microbial biomass) because the exponential
function was fitted over a large period of time. Growth of root
and microbial population occurred in late spring and early sum-
mer and their effects on soil respiration are therefore con-
founded with the increase in soil temperature.
Seasonal changes of soil respiration can be well predicted
with our simple exponential model when fitted on single year
data [9]. The doubling in the pre-exponential factor between
1997 and 2001 highlighted the contribution of changes in some
ecosystem characteristics on the interannual variability of soil
respiration that was not solely due to direct climate effects that
would have been taken into account in the model.
Interannual changes in soil respiration have already been
reported in forest ecosystem. Soil respiration increased by
about 50% between two adjacent years in boreal forest regen-
erations after a clearcut [30, 39]. Most of the time, these year-
to-year variations in soil respiration were ascribed to difference
Figure 5. Relationship between measured and predicted values of
soil respiration (R) with an exponential function (R=AWe
BT
) with T
the temperature of the soil at a depth of 10 cm and W the soil volu-
metric water content in the top 10 cm, (A) using a single pre expo-
nential factor for all years or (B) using an adjusted pre exponential
factor for each year (closed triangles, 1996; closed circles, 1997;
open triangles, 1998; open diamonds, 1999; close diamonds, 2000;
open circles). Values of r
2
were 0.72 in A and 0.93 in B (n = 41,
p < 0.001).
Figure 6. Predicted values of the pre-exponential factor (A) for each
year computed from an exponential function (R=AWe
BT
, see
Fig. 5B) describing the relationship between soil respiration (R) and
soil temperature at 10 cm depth (T) and soil water content in the top
10 cm (W).
504 D. Epron et al.
in soil water content during summer months [19, 35]. Similar
drought-induced decreases in soil respiration were reported for
beech, spruce and pine stands in one forest in Germany while
strong increase in soil respiration seemed independent of soil
water content in other beech and pines [2]. In Hesse forest, soil
respiration difference between 1996 and 1997 was also first
ascribed to difference in summer rainfalls [9] while there is now
some evidence that others causes are likely to account for these
year-to-year differences in soil respiration.
When the exponential model was fitted over the six years
periods, a close agreement between predicted and observed soil
respiration was obtained if the pre-exponential factor was
allowed to change from year to year. Even if the size of the data
set for the four other years limits the strength of year-to-year
comparison, one should recognised that the difference observed
between 1997 and 2001 was not fortuitous. Indeed, the pre-
exponential factor clearly exhibited a linear trend from 0.61 ±
0.13 in 1996 to 1.72 ± 0.24 in 2001 with an average increase
of about 0.2 µmol m
–2
s
–1
per year, except in 1999. A doubling
of summer soil respiration was also observed in four stands in
the southern Appalachians that was not directly related to cli-
matic factors, but these changes were operated across a long
span of 23–25 years [3]. More recently, it was showed that the
interannual variations in ecosystem respiration cannot be fully
explained by direct effects of climatic factors in the pine plan-
tation in the Duke forest, and was ascribed to some “functional
changes” [18]. Temporal changes in the basal respiration rates
in the current experiment may be due to the increment in root
and microbial biomass. Indeed, the experimental plot was
located in a young, actively growing, beech stand, and stand
biomass increased by about 10% each year (unpublished data).
An increase in soil respiration in a young slash pine plantation
has been ascribed to an increase in root biomass with age [12],
while ageing did not influence soil respiration of replanted cut
block in a sub-boreal forest [31]. Indirect effects of climate that
would affect phenology, photosynthesis or reserve constitution
are unlikely to fully account for the gradual increase of soil res-
piration with age but it should not be excluded in the present
study because the first years and summers were drier than the
last ones. Indeed, a multiple regression with the pre-exponen-
tial factor as dependent variable and average soil temperature
and summer precipitation as independent variables explains
67% (adjusted R
2
, p = 0.090) of the interannual variability in
soil respiration. Thus, a climatic effect might also contribute to
the interannual variability of soil respiration, either directly or
through an effect on annual productivity, which is related to soil
respiration [21].
Separating ageing phenomenon from the confounding
effects of thinning was impossible because the plot was thinned
during winter 1994/1995 and during winter 1998/1999. How-
ever, excessively high soil respiration rates were observed in
1999. Previous published data did not concerned thinning but
clear cutting, and showed either an increase [12, 27], a decrease
[36, 39], stability [29,37], or an increase followed by a decrease
in soil respiration [7]. Partial or total tree removal is thought to
increase soil respiration because more light reaching the soil
would increase soil temperature and reduced transpiration would
increase soil humidity. In addition to these climatic effects,
decrease in root biomass and increase in root necromass would
decrease the root component of soil respiration and would increase
the microbial component. About one fifth of the ground area
were removed by thinning. According to allometric equations
that were established before thinning [23], coarse root biomass
was decreased from 0.35 kg
DM
m
–2
while coarse root necro-
mass was similarly increased. Using 1997 estimates of fine root
biomass [10] the amount of fine root that were transferred from
the lived to the dead compartments was about 0.15 kg
DM
m
–2
.
The time courses of these transfers are unknown, as stored car-
bohydrate within roots would support their survival for some
time following thinning. It could take some years for the largest
roots. The increase in soil respiration after thinning would sug-
gest that the decrease in root respiration would be more than
compensated by the enhanced microbial respiration. A putative
explanation would be that suppressed competition for water
and nutrient by thinning, and increased rooting space, will stim-
ulate coarse root branching and elongation of the remaining
trees, and fine root proliferation. Indeed, reduced competition
for water after thinning increased lateral root growth in young
Pinus radiata [28]. Therefore, thinning-induced root prolifer-
ation would compensate for the initial decrease in root biomass,
maintaining the contribution of root respiration during the fol-
lowing years.
The fitted function was not used to estimate the annual soil
carbon flux for each year because the pre-exponential factor
was obtained from a limited number of observations for four
of the six years of measurements. In addition, measurements
were never carried during rainy days while post-rainfall respi-
ration burst have frequently been described [6, 17, 24, 33, 34].
The ecosystem processes that are behind these interannual
variations of soil respiration are probably complex, and causal
mechanisms would probably be difficult to assess, but these
results highlighted the need of long term records of soil fluxes
for parameterizing and validating soil carbon exchange model
at the ecosystem level.
Acknowledgements: This work were supported by the European pro-
grams Euroflux (ENV4-CT95-0078) and Carboeuroflux (EVK2-CT-
1999-00032). The “Communauté d’Agglomération du Pays de Mont-
béliard” (CAPM) is also acknowledged for financial supports. The two
anonymous reviewers are thanked for their valuable comments.
REFERENCES
[1] Anderson J.M., Carbon dioxide evolution from two temperate,
deciduous woodland soils, J. Appl. Ecol. 10 (1973) 361–378.
[2] Borken W., Xu Y.J., Davidson E.A., Beese F., Site and temporal
variation of soil respiration in European beech, Norway spruce and
Scots pine forests, Glob. Change Biol. 8 (2002) 1205–1216.
[3] Buchmann N., Kao W.Y., Ehleringer J.R., Carbon dioxide concen-
trations within forest canopies – variation with time, stand struc-
ture, and vegetation type, Glob. Change Biol. 2 (2000) 421–432.
[4] Coleman D.C., Hunter M.D., Hutton J., Pomeroy S., Swift L. Jr.,
Soil respiration from four aggrading forested watersheds measured
over a quarter century, For. Ecol. Manage. 157 (2002) 247–253.
[5] Davidson E.A., Beck E., Boone R.D., Soil water content and tem-
perature as independent or confounded factors controlling soil res-
piration in a temperate mixed hardwood forest, Glob. Change Biol.
4 (1998) 217–227.
[6] Davidson E.A., Verchot L.V., Cattânio J.H., Ackerman I.L., Carvalho
J.E.M., Effects of soil water content on soil respiration in forests
Interannual variation of soil respiration 505
and cattle pastures of eastern Amazonia, Biogeochemistry 48
(2000) 53–69.
[7] Edwards N.T., Ross-Todd B.M., Soil carbon dynamics in a mixed
deciduous forest following clear-cutting with and without residue
removal, Soil Sci. Soc. Amer. J. 47 (1983) 1014–1021.
[8] Edwards N.T., Effects of temperature and moisture on carbon
dioxide evolution in a mixed deciduous forest floor, Soil Sci. Soc.
Amer. J. 39 (1975) 361–365.
[9] Epron D., Farque L., Lucot E., Badot P.M., Soil CO
2
efflux in a
beech forest: dependence on soil temperature and soil water con-
tent, Ann. For. Sci. 56 (1999) 221–226.
[10] Epron D., Farque L., Lucot E., Badot P.M., Soil CO
2
efflux in a
beech forest: the contribution of root respiration. Ann. For. Sci. 56
(1999) 289–295.
[11] Epron D., Nouvellon Y., Roupsard O., Mouvondy W., Mabiala A.,
Saint André L., Joffre R., Jourdan C., Bonnefond J.M., Berbigier P.,
Hamel O., Spatial and temporal variation of soil respiration in a
Eucalyptus plantation in Congo, For. Ecol. Manage. (2004) under
press.
[12] Ewel K.C., Cropper W.P., Gholz H.L., Soil CO
2
evolution in Flo-
rida slash pine plantations. I. Changes through time, Can. J. For.
Res. 17 (1987) 325–329.
[13] Fang C., Moncrieff J.B., Gholz H.L., Clark K.L., Soil CO
2
efflux
and its spatial variation in a Florida slash pine plantation, Plant Soil
205 (1998) 135–146.
[14] Garret H.E., Cox G.S., Carbon dioxide evolution from the floor of
an oak-hickory forest, Soil Sci. Soc. Amer. Proc. 37 (1973) 641–644.
[15] Granier A., Ceschia E., Damesin C., Dufrêne E., Epron D., Gross
P., Lebaube S., Le Dantec V., Le Goff N., Lemoine D., Lucot E.,
Ottorini J.M., Pontailler J.Y., Saugier B., The carbon balance of a
young beech forest, Funct. Ecol. 14 (2000) 312–325.
[16] Hanson P.J., Wullschleger S.D., Bohlman S.A., Todd D.E., Seaso-
nal and topographic patterns of forest floor CO
2
efflux from an
upland oak forest, Tree Physiol. 13 (1993) 1–15.
[17] Holt J.A., Hodgen M.J., Lamb D., Soil respiration in the seasonally
dry tropics near Townville, North Queensland, Aust. J. Soil Res. 28
(1990) 737–745.
[18] Hui D., Luo Y., Katul G., Partitioning interannual variability in net
ecosystem exchange between climatic variability and functional
change, Tree Physiol. 23 (2003) 433–442.
[19] Irvine J., Law B.E., Contrasting soil respiration in young and old-
growth ponderosa pine forests, Glob. Change Biol. 8 (2002) 1183–
1194.
[20] Janssens I.A., Dore S., Epron D., Lankreijer H., Buchmann N.,
Longdoz B., Brossaud J., Montagnani L., Climatic influence on
seasonal and spatial differences in soil CO
2
efflux, in: Valentini R.
(Ed.), Fluxes of carbon, water and energy of European forests,
Springer-Verlag, Berlin, Heidelberg, New York, 2003, pp. 233–253.
[21] Janssens I.A., Lankreijer H., Metteucci G., Kowalski A.S., Buchmann
N., Epron D., Pilegaard K., Kutsch W., Longdoz B., Grünwald T.,
Montagnani L., Dore S., Rebmann C., Moors E.J., Grelle A., Rannik
Ü., Morgenstern K., Olchev S., Clement R., Gudmundsson J.,
Minerbi S., Berbigier P., Ibrom A., Moncrieff J., Aubinet M., Bernhofer
C., Jensen N.O., Vesala T., Granier A., Schulze E.D., Lindroth A.,
Dolman A.J., Jarvis P.G., Ceulemans R., Valentini R., Productivity
overshadows temperature in determining soil and ecosystem respi-
ration across European forests, Glob. Change Biol. 7 (2001) 269–278.
[22] Joffre R., Ourcival J.M., Rambal S., Rocheteau A., The key-role of
topsoil moisture on CO
2
efflux from a mediterranean Quercus ilex
forest, Ann. For. Sci. 60 (2003) 519–526.
[23] Le Goff N., Ottorini J.M., Root biomass and biomass increment in
a beech (Fagus sylvatica L.) stand in Northeast of France, Ann. For.
Sci. 58 (2001) 1–13.
[24] Liu X., Wan S., Su B., Hui D., Luo Y., Response of soil CO
2
efflux
to water manipulation in a tallgrass prairie ecosystem, Plant Soil
240 (2002) 213–223.
[25] Lloyd J., Taylor J.A., On the temperature dependence of soil respi-
ration, Funct. Ecol. 8 (1994) 315–323.
[26] Longdoz B., Yernaux M., Aubinet M., Soil CO
2
efflux measure-
ments in a mixed forest: impact of chamber disturbances, spatial
variability and seasonal evolution, Glob. Change Biol. 6 (2000)
907–917.
[27] Lytle D.E., Cronan C.S., Comparative soil CO
2
evolution, litter
decay, and root dynamics in clearcut and uncut spruce-fir forest,
For. Ecol. Manage. 103 (1998) 121–128.
[28] Gautam M.K., Mead D.J., Clinton P.W., Chang S.X., Biomass and
morphology of Pinus radiata coarse root components in a sub-
humid temperate silvopastoral system, For. Ecol. Manage. 177
(2003) 387–397.
[29] Marra J.L., Edmonds R.L., Coarse woody debris and soil respira-
tion in a clearcut on the Olympic Peninsula, Washington, USA,
Can. J. For. Res. (1996) 1337–1345.
[30] Pypker T.G., Fredeen A.L., Ecosystem CO
2
flux over two growing
seasons for a sub-Boreal clearcut 5 and 6 years after harvest, Agri-
cult. For. Meteorol. 114 (2002) 15–30.
[31] Pypker T.G., Fredeen A.L., Below ground CO
2
efflux from cut
blocks of varying ages in sub-Boreal British Columbia, For. Ecol.
Manage. 172 (2003) 246–259.
[32] Qi Y., Xu M., Separating the effects of moisture and temperature on
soil CO
2
efflux in a coniferous forest in the Sierra Nevada moun-
tains, Plant Soil 237 (2001) 15–23.
[33] Rey A., Pegoraro E., Tedeschi V., De Parri I., Jarvis P., Valentini
R., Annual variation in soil respiration and its components in a cop-
pice oak forest in central Italy, Glob. Change Biol. 8 (2002) 851–
866.
[34] Rochette P., Desjardins R.L., Pattey E., Spatial and temporal varia-
bility of soil respiration in agricultural fields, Can. J. Soil Sci. 71
(1991) 189–196.
[35] Savage K.E., Davidson E.A., Interannual variation of soil respira-
tion in two New England forests, Glob. Biogeochem. Cycles 15
(2001) 337–350.
[36] Striegl R.G., Wickland K.P., Effects of a clear-cut harvest on soil
respiration in a jack pine-lichen woodland, Can. J. For. Res. 28
(1998) 534–539.
[37] Toland D.E., Zak D.R., Seasonal patterns of soil respiration in
intact and clear-cut northern hardwood forests, Can. J. For. Res. 24
(1994) 1711–1716.
[38] Valentini R., Matteucci G., Dolman A.J., Schulze E.D., Rebmann
C., Moors E.J., Granier A., Gross P., Jensen N.O., Pilegaard K.,
Lindroth A., Grelle A., Bernhofer C., Grünwald T., Aubinet M.,
Ceulemans R., Kowalski A.S., Vesala T., Rannik Ü., Berbigier P.,
Lousteau D., Gudmundsson J., Thorgeirsson H., Ibrom A., Morgenstern
K., Clement R., Moncrieff J., Montagnani L., Minerbi S., Jarvis
P.G., Respiration as the main determinant of European forests car-
bon balance, Nature 404 (2000) 861–865.
[39] Weber M.G., Forest soil respiration after cutting and burning in
immature aspen ecosystems, For. Ecol. Manage. 31 (1990) 1–14.
[40] Wilson K.B., Baldocchi D.D., Comparing independent estimates of
carbon dioxide exchange over 5 years at a deciduous forest in the
southeastern United States, J. Geophys. Res. 106 (2001) 34167–
34178.
[41] Xu M., Qi Y., Soil-surface CO
2
efflux and its spatial and temporal
variations in a young ponderosa pine plantation in northern Califor-
nia, Glob. Change Biol. 7 (2001) 667–677.